European Parliament constituency
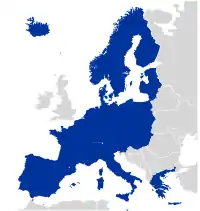
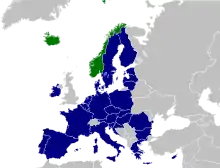
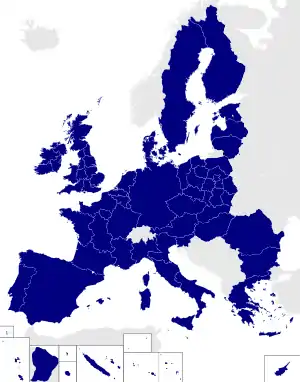
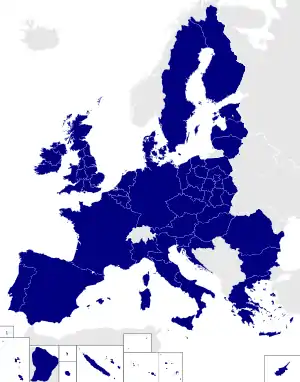
Members of the European Parliament (MEPs) are elected by the population of the member states of the European Union (EU). The European Electoral Act 2002 allows member states the choice to allocate electoral subdivisions or constituencies (French: Circonscriptions électorales, German: Wahlkreise, Italian: Circoscrizioni elettorali, Swedish: Valkretsar) for the European Parliament elections in several different ways.[1]
Most EU countries operate a single national constituency which elects MEPs for the whole country.[1] Belgium and Ireland are each subdivided into constituencies, with electoral results calculated separately in each constituency.[1] Germany, Italy and Poland are each subdivided into electoral districts, with the number of representatives determined at the national level after each election in proportion to the votes cast in each district.[1]
In Germany, political parties are entitled to present lists of candidates either at Länder or national level.
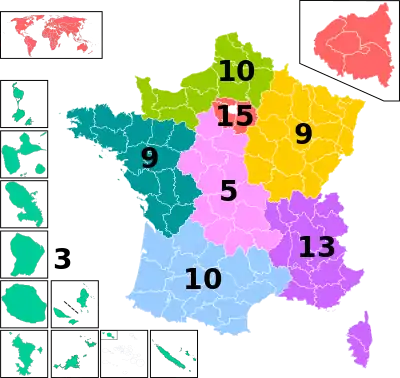
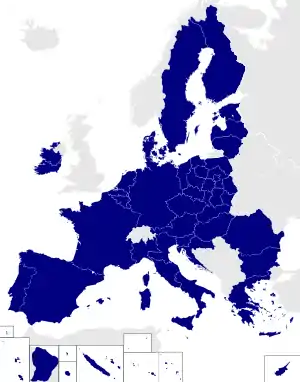
France was subdivided into 8 constituencies from 2004 until 2019. Denmark had a separate constituency for Greenland until 1985, when the autonomous territory withdrew from the EEC (later expanded to become the EU).
Currently, all constituencies use various forms of proportional representation (PR), except the single-seat German-speaking electoral college in Belgium, which uses first-past-the-post. The parliament as a whole is not PR, because seats are apportioned between member states by degressive proportionality.
Full list
| Constituency | Member State | Area/Community | Seats | Population, 2012[2] (thousands) | Area[3] (km2) | |||
|---|---|---|---|---|---|---|---|---|
| At election | Current | Total | Per current seat | Total | Per current seat | |||
| Austria | Austria | (Full country) | 18 | 19 | 8,430 | 444 | 83,879 | 4,415 |
| Dutch-speaking electoral college | Belgium | Flemish Community | 12 | 12 | 6,389 | 532 | 13,521 | 1,127 |
| French-speaking electoral college | French Community of Belgium | 8 | 8 | 4,663 | 583 | 16,152 | 2,019 | |
| German-speaking electoral college | German-speaking Community of Belgium | 1 | 1 | 77 | 77 | 854 | 854 | |
| Bulgaria | Bulgaria | (Full country) | 17 | 17 | 7,306 | 430 | 110,900 | 6,524 |
| Croatia | Croatia | (Full country) | 11 | 12 | 4,269 | 356 | 56,594 | 4,716 |
| Cyprus | Cyprus | (Full country) | 6 | 6 | 864 | 144 | 9,251 | 1,542 |
| Czech Republic | Czech Republic | (Full country) | 21 | 21 | 10,511 | 501 | 78,866 | 3,756 |
| Denmark | Kingdom of Denmark | (Full country) | 13 | 14 | 5,592 | 399 | 42,916 | 3,065 |
| Estonia | Estonia | (Full country) | 6 | 7 | 1,323 | 189 | 45,227 | 6,461 |
| Finland | Finland | (Full country) | 13 | 14 | 5,414 | 387 | 338,435 | 24,174 |
| France | France | (Full country) | 74 | 79 | 66,233 | 838 | 656,412 | 8,309 |
| Germany | Germany | (Full country) | 96 | 96 | 81,932 | 853 | 357,162 | 3,720 |
| Greece | Greece | (Full country) | 21 | 21 | 11,093 | 528 | 131,957 | 6,284 |
| Hungary | Hungary | (Full country) | 21 | 21 | 9,920 | 472 | 93,024 | 4,430 |
| Dublin | Ireland | Counties Dún Laoghaire–Rathdown, Fingal and South Dublin; and the city of Dublin | 3 | 4 | 1,271 | 318 | 921 | 230 |
| Midlands–North-West | Counties Cavan, Donegal, Galway, Kildare, Leitrim, Longford, Louth, Mayo, Meath, Monaghan, Roscommon, Sligo and Westmeath; and the city of Galway | 4 | 4 | 1,635 | 409 | 37,282 | 9,321 | |
| South | Counties Carlow, Clare, Cork, Kilkenny, Kerry, Laois, Limerick, Offaly, Tipperary, Waterford, Wexford and Wicklow; and the cities of Cork, Limerick and Waterford | 4 | 5 | 1,675 | 335 | 31,935 | 6,387 | |
| North-West | Italy | Aosta Valley, Liguria, Lombardy, Piedmont | 20 | 20 | 15,807 | 790 | 57,928 | 2,896 |
| North-East | Emilia-Romagna, Friuli-Venezia Giulia, Trentino-Alto Adige/Südtirol, Veneto | 14 | 15 | 11,482 | 765 | 62,327 | 4,155 | |
| Central | Latium, Marche, Tuscany, Umbria | 14 | 15 | 11,637 | 776 | 58,084 | 3,872 | |
| Southern | Abruzzo, Apulia, Basilicata, Calabria, Campania, Molise | 17 | 18 | 13,975 | 776 | 73,800 | 4,100 | |
| Islands | Sardinia, Sicily | 8 | 8 | 6,639 | 830 | 49,932 | 6,242 | |
| Latvia | Latvia | (Full country) | 8 | 8 | 2,034 | 254 | 64,573 | 8,072 |
| Lithuania | Lithuania | (Full country) | 11 | 11 | 2,988 | 272 | 65,300 | 5,936 |
| Luxembourg | Luxembourg | (Full country) | 6 | 6 | 531 | 88 | 2,586 | 431 |
| Malta | Malta | (Full country) | 6 | 6 | 420 | 70 | 316 | 53 |
| Netherlands | Netherlands | (Full country) | 26 | 29 | 16,755 | 578 | 41,540 | 1,432 |
| Pomeranian | Poland | Pomeranian Voivodeship | 3 | 3 | 2,287 | 762 | 18,310 | 6,103 |
| Kuyavian-Pomeranian | Kuyavian-Pomeranian Voivodeship | 2 | 2 | 2,097 | 1,049 | 17,972 | 8,986 | |
| Podlaskie and Warmian-Masurian | Podlaskie Voivodeship and Warmian-Masurian Voivodeship | 3 | 3 | 2,651 | 884 | 44,360 | 14,787 | |
| Warsaw | City of Warsaw and part of the Masovian Voivodeship (powiats: Grodzisk Mazowiecki, Legionowo, Nowy Dwór Mazowiecki, Otwock, Piaseczno, Pruszków, Warsaw West and Wołomin) | 6 | 6 | 2,795 | 466 | 11,205 | 1,868 | |
| Masovian | The remaining part of the Masovian Voivodeship (powiats: Ciechanów, Gostyń, Mława, Płock, Płońsk, Przasnysz, Sierpc, Sochaczew, Żuromin, Żyrardów, Białobrzegi, Grójec, Kozienice, Lipsko, Przysucha, Radom, Szydłowiec, Zwoleń, Garwolin, Łosice, Maków, Mińsk, Ostrołęka, Ostrów Mazowiecka, Pułtusk, Siedlce, Sokołów, Węgrów, Wyszków and the cities of Płock, Radom, Ostrołęka and Siedlce) | 3 | 3 | 2,499 | 833 | 24,353 | 8,118 | |
| Łódź | Łódź Voivodeship | 3 | 3 | 2,529 | 843 | 18,219 | 6,073 | |
| Greater Poland | Greater Poland Voivodeship | 5 | 5 | 3,350 | 670 | 15,183 | 3,037 | |
| Lublin | Lublin Voivodeship | 3 | 3 | 2,169 | 732 | 25,122 | 8,374 | |
| Subcarpathian | Subcarpathian Voivodeship | 3 | 3 | 2,129 | 710 | 17,846 | 5,949 | |
| Lesser Poland and Świętokrzyskie | Lesser Poland Voivodeship and Świętokrzyskie Voivodeship | 5 | 6 | 4,735 | 789 | 41,537 | 6,923 | |
| Silesian | Silesian Voivodeship | 7 | 7 | 4,621 | 660 | 12,333 | 1,762 | |
| Lower Silesian and Opole | Lower Silesian Voivodeship and Opole Voivodeship | 4 | 4 | 3,928 | 982 | 29,359 | 7,340 | |
| Lubusz and West Pomeranian | Lubusz Voivodeship and West Pomeranian Voivodeship | 4 | 4 | 2,745 | 686 | 36,880 | 9,220 | |
| Portugal | Portugal | (Full country) | 21 | 21 | 10,515 | 501 | 92,212 | 4,391 |
| Romania | Romania | (Full country) | 32 | 33 | 21,385 | 648 | 238,391 | 7,224 |
| Slovakia | Slovakia | (Full country) | 13 | 14 | 5,408 | 386 | 49,036 | 3,503 |
| Slovenia | Slovenia | (Full country) | 8 | 8 | 2,057 | 257 | 20,273 | 2,534 |
| Spain | Spain | (Full country) | 54 | 59 | 46,773 | 793 | 505,991 | 8,576 |
| Sweden | Sweden | (Full country) | 20 | 21 | 9,519 | 453 | 438,576 | 20,885 |
| Total | 751 | 705 | 445,056 | 631 | 4,238,831 | 6,013 | ||
- ^ Due to the UK's withdrawal, British constituencies were abolished from 2020 onwards.
Regional constituencies by member state
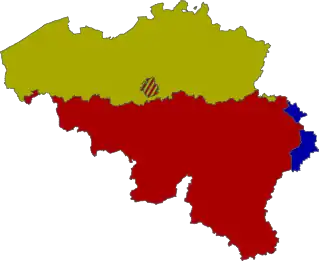 European Parliament constituencies in Belgium
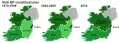
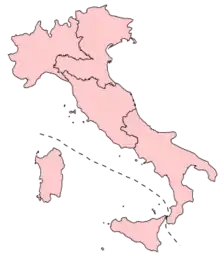 European Parliament constituencies in Italy
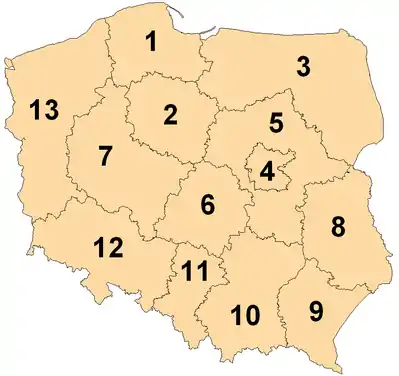
Kingdom of Denmark
.png.webp)
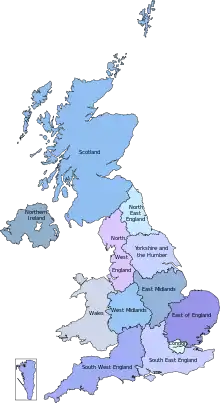
United Kingdom
Full lists

References
- Oelbermann, Kai-Friederike; Palomares, Antonio; Pukelsheim, Friedrich (2010). "The 2009 European Parliament Elections: From Votes to Seats in 27 Ways" (PDF). European Electoral Studies. 5 (1): 148–182. Archived (PDF) from the original on 15 September 2013.
- Eurostat (14 March 2014). "Average annual population (1000) by NUTS 2 region". Retrieved 26 May 2014.
- Eurostat (19 May 2014). "Total area and land area by NUTS 2 region". Retrieved 26 May 2014.
External links
| Wikimedia Commons has media related to European Parliament constituencies. |
- Fact Sheets on the European Union
- European Parliament election, 2004 (Belgium) – electoral law
- European Parliament election, 2004 (Finland) – electoral law
- European Parliament election, 2004 (France) – electoral law
- European Parliament election, 2004 (Ireland) – electoral law
- European Parliament election, 2004 (Poland) – electoral law
- European Parliament election, 2004 (United Kingdom) – electoral law