Spain (European Parliament constituency)
For elections in the European Union, Spain is a European Parliament constituency, currently represented by 59 members of the European Parliament (MEPs). It covers the entirety of Spain and is the second largest European Parliament constituency in terms of geographic area after France, as well as the third most populated after Germany and France.
| Spain | |
|---|---|
| European Parliament constituency | |
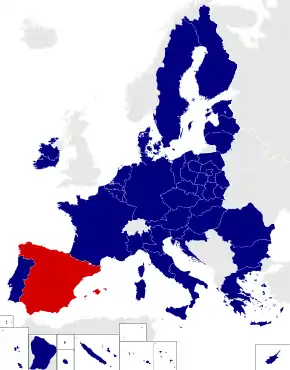 Location among the current constituencies | |
| Member state | Spain |
| Created | 1987 |
| MEPs | 60 (1986–1993) 64 (1993–2004) 54 (2004–2009) 50 (2009–2011) 54 (2011–2020) 59 (2020–present) |
| Sources | |
Electoral system
The constituency was created as per the 1985 Treaty of Accession and was first contested in the 1987 European election in Spain. The Treaty provided for Spain to be allocated 60 representatives within the European Parliament, but successive amendments to the Treaty on European Union and the Treaties establishing the European Communities have seen this number change: 64 under Council Decision 93/81/Euratom, ECSC, EEC and Amsterdam; 50 under Nice and 54 under Lisbon.[1][2][3][4][5] The European Parliament Committee on Constitutional Affairs proposed on 23 January 2018 an increase of the number of seats allocated to Spain from 54 to 59 after Brexit has taken place, a proposal that first needs to be adopted by the Parliament, then approved by the European Council, to be made effective.[6][7]
Voting is on the basis of universal suffrage, which comprises all nationals and non-national European citizens over eighteen and in full enjoyment of their political rights. Amendments to the electoral law in 2011 required for Spaniards abroad to apply for voting before being permitted to vote, a system known as "begged" or expat vote (Spanish: Voto rogado).[8] Seats are elected using the D'Hondt method and a closed list proportional representation, with no threshold being applied in order to be entitled to enter seat distribution.[9][10] However, the use of the D'Hondt method may result in an effective threshold depending on the district magnitude.[11]
The electoral law provides that parties, federations, coalitions and groupings of electors are allowed to present lists of candidates. However, they are required to secure the signature of at least 15,000 registered electors. Electors are barred from signing for more than one list of candidates. Parties, federations and coalitions are allowed to replace this requirement with the signature of at least 50 elected officials—deputies, senators, MEPs or members from the legislative assemblies of autonomous communities or from local city councils—. Concurrently, parties and federations intending to enter in coalition to take part jointly at an election are required to inform the relevant Electoral Commission within ten days of the election being called.[9][10]
MEPs
| MEPs for Spain 1987– | |||||||||||||
|---|---|---|---|---|---|---|---|---|---|---|---|---|---|
| Parliament | Election | Distribution | |||||||||||
| 2nd | 1987 |
| |||||||||||
| 3rd | 1989 |
| |||||||||||
| 4th | 1994 |
| |||||||||||
| 5th | 1999 |
| |||||||||||
| 6th | 2004 |
| |||||||||||
| 7th | 2009 |
| |||||||||||
| 2011[n 1] |
| ||||||||||||
| 8th | 2014 |
| |||||||||||
| 9th | 2019 |
| |||||||||||
| 2020[n 2] |
| ||||||||||||
Elections
2019
| Parties and coalitions | Popular vote | Seats | ||||
|---|---|---|---|---|---|---|
| Votes | % | ±pp | Total | +/− | ||
| Spanish Socialist Workers' Party (PSOE)1 | 7,369,789 | 32.86 | +9.85 | 21 | +7 | |
| People's Party (PP)1 | 4,519,205 | 20.15 | –5.94 | 13 | –3 | |
| Citizens–Party of the Citizenry (Cs)1 2 | 2,731,825 | 12.18 | +2.51 | 8 | +2 | |
| United We Can Change Europe (Podemos–IU)3 | 2,258,857 | 10.07 | –7.94 | 6 | –5 | |
| Vox (Vox)1 | 1,393,684 | 6.21 | +4.64 | 4 | +4 | |
| Republics Now (Ahora Repúblicas)4 | 1,252,139 | 5.58 | –0.51 | 3 | ±0 | |
| Free for Europe (Junts)1 5 | 1,018,435 | 4.54 | +1.04 | 3 | +1 | |
| Coalition for a Solidary Europe (CEUS)6 | 633,090 | 2.82 | +0.89 | 1 | ±0 | |
| Commitment to Europe (CpE)7 | 296,491 | 1.32 | –0.60 | 0 | –1 | |
| Animalist Party Against Mistreatment of Animals (PACMA) | 295,546 | 1.32 | +0.19 | 0 | ±0 | |
| Green Coalition–Citizen Europe (CV–EC) | 65,504 | 0.29 | New | 0 | ±0 | |
| Zero Cuts–The Greens–European Green Group (Recortes Cero–LV–GVE) | 50,002 | 0.22 | +0.02 | 0 | ±0 | |
| Volt Europa (Volt) | 32,432 | 0.14 | New | 0 | ±0 | |
| Feminist Initiative (IFem) | 29,276 | 0.13 | –0.02 | 0 | ±0 | |
| Communists (PCPE–PCPC–PCPA) | 28,508 | 0.13 | –0.06 | 0 | ±0 | |
| Act (PACT) | 25,528 | 0.11 | New | 0 | ±0 | |
| Andalusia by Herself (AxSí)8 | 23,995 | 0.11 | –0.21 | 0 | ±0 | |
| For a Fairer World (PUM+J) | 21,584 | 0.10 | New | 0 | ±0 | |
| Communist Party of the Workers of Spain (PCTE) | 19,080 | 0.09 | New | 0 | ±0 | |
| Pirates of Catalonia–European Pirates (pirates.cat/ep) | 16,755 | 0.07 | –0.18 | 0 | ±0 | |
| Centrists for Europe (CCD–Lliures–UIJ–centrados) | 15,615 | 0.07 | New | 0 | ±0 | |
| Forum of Citizens (FAC) | 14,175 | 0.06 | –0.15 | 0 | ±0 | |
| Positive Left (IZQP) | 12,939 | 0.06 | New | 0 | ±0 | |
| With You, We Are Democracy (Contigo) | 12,430 | 0.06 | New | 0 | ±0 | |
| Extremadurans (CEx–CREx–PREx) | 11,894 | 0.05 | +0.01 | 0 | ±0 | |
| FE de las JONS–Spanish Alternative–La Falange–National Democracy (ADÑ)8 | 11,699 | 0.05 | –0.20 | 0 | ±0 | |
| Republican Alternative (ALTER) | 11,076 | 0.05 | ±0.00 | 0 | ±0 | |
| Actual Equality (IGRE) | 9,076 | 0.04 | New | 0 | ±0 | |
| Red Current Movement (MCR) | 8,402 | 0.04 | +0.01 | 0 | ±0 | |
| Humanist Party (PH) | 7,947 | 0.04 | –0.05 | 0 | ±0 | |
| Euro Latino Independent Movement (MIEL) | 6,809 | 0.03 | New | 0 | ±0 | |
| Internationalist Solidarity and Self-Management (SAIn) | 5,543 | 0.02 | –0.02 | 0 | ±0 | |
| Blank ballots | 216,736 | 0.97 | –1.33 | |||
| Total1 | 22,426,066 | 59 | +5 | |||
| Valid votes | 22,426,066 | 99.14 | +0.94 | |||
| Invalid votes | 193,918 | 0.86 | –0.94 | |||
| Votes cast / turnout | 22,619,984 | 60.73 | +16.92 | |||
| Abstentions | 14,628,904 | 39.27 | –16.92 | |||
| Registered voters | 37,248,888 | |||||
| Sources[12] | ||||||
2014
| Parties and coalitions | Popular vote | Seats | ||||
|---|---|---|---|---|---|---|
| Votes | % | ±pp | Total | +/− | ||
| People's Party (PP) | 4,098,339 | 26.09 | –16.03 | 16 | –8 | |
| Spanish Socialist Workers' Party (PSOE) | 3,614,232 | 23.01 | –15.77 | 14 | –9 | |
| Plural Left (IP)1 | 1,575,308 | 10.03 | +6.32 | 6 | +4 | |
| We Can (Podemos) | 1,253,837 | 7.98 | New | 5 | +5 | |
| Union, Progress and Democracy (UPyD) | 1,022,232 | 6.51 | +3.66 | 4 | +3 | |
| Coalition for Europe (CEU)2 | 851,971 | 5.42 | +0.61 | 3 | ±0 | |
| The Left for the Right to Decide (EPDD)3 | 630,072 | 4.01 | +2.60 | 2 | +1 | |
| Citizens–Party of the Citizenry (C's)4 | 497,146 | 3.16 | +3.02 | 2 | +2 | |
| The Peoples Decide (LPD)5 | 326,464 | 2.08 | –0.06 | 1 | +1 | |
| European Spring (PE)6 | 302,266 | 1.92 | +1.56 | 1 | +1 | |
| Vox (Vox) | 246,833 | 1.57 | New | 0 | ±0 | |
| Animalist Party Against Mistreatment of Animals (PACMA) | 177,499 | 1.13 | +0.87 | 0 | ±0 | |
| Blank Seats (EB) | 115,682 | 0.74 | New | 0 | ±0 | |
| Citizens' Democratic Renewal Movement (RED) | 105,666 | 0.67 | New | 0 | ±0 | |
| X Party, Party of the Future (Partido X) | 100,561 | 0.64 | New | 0 | ±0 | |
| Andalusian Party (PA)7 | 49,523 | 0.32 | +0.15 | 0 | ±0 | |
| Pirate Confederation–European Pirates (Piratas) | 38,690 | 0.25 | New | 0 | ±0 | |
| Asturias Forum (FAC) | 32,962 | 0.21 | New | 0 | ±0 | |
| Electors' Group for the Disabled and Rare Diseases (DER) | 32,833 | 0.21 | New | 0 | ±0 | |
| Zero Cuts (Recortes Cero) | 30,827 | 0.20 | New | 0 | ±0 | |
| Communist Party of the Peoples of Spain (PCPE) | 29,324 | 0.19 | +0.09 | 0 | ±0 | |
| Feminist Initiative (IFem) | 23,140 | 0.15 | +0.09 | 0 | ±0 | |
| Spanish Phalanx of the CNSO (FE–JONS) | 21,687 | 0.14 | +0.08 | 0 | ±0 | |
| United Free Citizens (CILUS) | 18,287 | 0.12 | New | 0 | ±0 | |
| Social Impulse (Impulso Social) | 17,879 | 0.11 | New | 0 | ±0 | |
| Spain on the Move (LEM) | 17,035 | 0.11 | New | 0 | ±0 | |
| Humanist Party (PH) | 14,896 | 0.09 | +0.05 | 0 | ±0 | |
| National Democracy (DN) | 13,079 | 0.08 | +0.02 | 0 | ±0 | |
| Europe Project (ACNV–BAR–PRAO–REPO–UNIO) | 11,502 | 0.07 | New | 0 | ±0 | |
| Land Party (PT) | 9,940 | 0.06 | New | 0 | ±0 | |
| Individual Freedom Party (P–LIB) | 9,670 | 0.06 | New | 0 | ±0 | |
| Republican Social Movement (MSR) | 8,909 | 0.06 | +0.02 | 0 | ±0 | |
| United Extremadura (EU) | 8,821 | 0.06 | +0.03 | 0 | ±0 | |
| Republican Alternative (ALTER) | 8,593 | 0.05 | New | 0 | ±0 | |
| For the Republic, for the Rupture with the European Union (RRUE)8 | 8,309 | 0.05 | –0.03 | 0 | ±0 | |
| Internationalist Solidarity and Self-Management (SAIn) | 6,929 | 0.04 | ±0.00 | 0 | ±0 | |
| Regionalist Party of the Leonese Country (PREPAL) | 6,759 | 0.04 | +0.01 | 0 | ±0 | |
| Extremadurans for Europe (IPEx–PREx–CREx) | 5,967 | 0.04 | New | 0 | ±0 | |
| Red Current Movement (MCR) | 4,980 | 0.03 | New | 0 | ±0 | |
| Blank ballots | 361,567 | 2.30 | +0.91 | |||
| Total | 15,710,216 | 54 | ±0 | |||
| Valid votes | 15,710,216 | 98.20 | –1.18 | |||
| Invalid votes | 287,925 | 1.80 | +1.18 | |||
| Votes cast / turnout | 15,998,141 | 43.81 | –1.09 | |||
| Abstentions | 20,515,943 | 56.19 | +1.09 | |||
| Registered voters | 36,514,084 | |||||
| Sources[13][14] | ||||||
2009
| Parties and coalitions | Popular vote | Seats | ||||
|---|---|---|---|---|---|---|
| Votes | % | ±pp | Total | +/− | ||
| People's Party (PP)1 | 6,670,377 | 42.12 | +0.91 | 24 | ±0 | |
| Spanish Socialist Workers' Party (PSOE)1 | 6,141,784 | 38.78 | –4.68 | 23 | –2 | |
| Coalition for Europe (CEU)1 2 | 808,246 | 5.10 | –0.12 | 3 | +1 | |
| United Left–Initiative for Catalonia Greens: The Left (IU–ICV) | 588,248 | 3.71 | –0.44 | 2 | ±0 | |
| Union, Progress and Democracy (UPyD) | 451,866 | 2.85 | New | 1 | +1 | |
| Europe of the Peoples–Greens (EdP–V)3 | 394,938 | 2.49 | –0.95 | 1 | ±0 | |
| Internationalist Initiative–Solidarity among Peoples (II–SP) | 178,121 | 1.12 | New | 0 | ±0 | |
| The Greens–European Green Group (LV–GVE) | 89,147 | 0.56 | +0.12 | 0 | ±0 | |
| Anti-Bullfighting Party Against Mistreatment of Animals (PACMA) | 41,913 | 0.26 | New | 0 | ±0 | |
| For a Fairer World (PUM+J) | 24,507 | 0.15 | +0.09 | 0 | ±0 | |
| Libertas–Citizens of Spain (Libertas) | 22,903 | 0.14 | New | 0 | ±0 | |
| Anti-capitalist Left–Global Revolt (IzAn–RG) | 19,735 | 0.12 | New | 0 | ±0 | |
| Spanish Alternative (AES) | 19,583 | 0.12 | New | 0 | ±0 | |
| Communist Party of the Peoples of Spain (PCPE) | 15,221 | 0.10 | +0.07 | 0 | ±0 | |
| Socialist Party of Andalusia (PSA)4 | 13,993 | 0.09 | +0.05 | 0 | ±0 | |
| Internationalist Socialist Workers' Party (POSI) | 12,344 | 0.08 | +0.03 | 0 | ±0 | |
| Family and Life Party (PFyV) | 10,456 | 0.07 | +0.02 | 0 | ±0 | |
| Democratic and Social Centre (CDS) | 10,144 | 0.06 | –0.02 | 0 | ±0 | |
| Spanish Phalanx of the CNSO (FE–JONS) | 10,031 | 0.06 | +0.03 | 0 | ±0 | |
| National Democracy (DN) | 9,950 | 0.06 | +0.02 | 0 | ±0 | |
| Feminist Initiative (IFem) | 9,721 | 0.06 | New | 0 | ±0 | |
| National Front (FrN) | 7,970 | 0.05 | New | 0 | ±0 | |
| Catalan Republican Party (RC) | 7,547 | 0.05 | New | 0 | ±0 | |
| Humanist Party (PH) | 7,009 | 0.04 | +0.01 | 0 | ±0 | |
| Valencian Union (UV)5 | 6,072 | 0.04 | –0.01 | 0 | ±0 | |
| Republican Social Movement (MSR) | 6,009 | 0.04 | New | 0 | ±0 | |
| Internationalist Solidarity and Self-Management (SAIn) | 5,877 | 0.04 | New | 0 | ±0 | |
| Liberal Democratic Centre (CDL) | 5,733 | 0.04 | New | 0 | ±0 | |
| Authentic Phalanx (FA) | 5,165 | 0.03 | +0.02 | 0 | ±0 | |
| United Extremadura (EU)6 | 5,007 | 0.03 | +0.02 | 0 | ±0 | |
| Regionalist Party of the Leonese Country (PREPAL) | 4,767 | 0.03 | +0.01 | 0 | ±0 | |
| Communist Unification of Spain (UCE) | 3,483 | 0.02 | New | 0 | ±0 | |
| Asturian Nationalist Unity (UNA) | 3,183 | 0.02 | New | 0 | ±0 | |
| Andecha Astur (AA) | 2,255 | 0.01 | New | 0 | ±0 | |
| Liberal Centrist Union (UCL) | 1,991 | 0.01 | ±0.00 | 0 | ±0 | |
| Blank ballots | 220,471 | 1.39 | +0.78 | |||
| Total1 | 15,835,767 | 54 | ±0 | |||
| Valid votes | 15,835,767 | 99.38 | +0.36 | |||
| Invalid votes | 99,380 | 0.62 | –0.36 | |||
| Votes cast / turnout | 15,935,147 | 44.90 | –0.24 | |||
| Abstentions | 19,557,420 | 55.10 | +0.24 | |||
| Registered voters | 35,492,567 | |||||
| Sources[15][16] | ||||||
2004
| Parties and coalitions | Popular vote | Seats | ||||
|---|---|---|---|---|---|---|
| Votes | % | ±pp | Total | +/− | ||
| Spanish Socialist Workers' Party (PSOE) | 6,741,112 | 43.46 | +8.13 | 25 | +1 | |
| People's Party (PP) | 6,393,192 | 41.21 | +1.47 | 24 | –3 | |
| Galeusca–Peoples of Europe (Galeusca)1 | 798,816 | 5.15 | –2.87 | 2 | –2 | |
| United Left–Initiative for Catalonia Greens–EUiA (IU–ICV–EUiA)2 | 643,136 | 4.15 | –2.36 | 2 | –2 | |
| Europe of the Peoples (EdP)3 | 380,709 | 2.45 | +1.34 | 1 | –1 | |
| European Coalition (CE)4 | 197,231 | 1.27 | –2.17 | 0 | –2 | |
| The Greens–European Green Group (LV–GVE)5 | 68,536 | 0.44 | –0.22 | 0 | ±0 | |
| Cannabis Party for Legalisation and Normalisation (PCLyN) | 54,460 | 0.35 | New | 0 | ±0 | |
| Aralar (Aralar) | 19,993 | 0.13 | New | 0 | ±0 | |
| Socialist Action Party (PASOC) | 13,810 | 0.09 | New | 0 | ±0 | |
| Democratic and Social Centre (CDS) | 11,820 | 0.08 | –0.10 | 0 | ±0 | |
| For a Fairer World (PUM+J) | 9,202 | 0.06 | New | 0 | ±0 | |
| Popular Unity Candidacy (CUP) | 8,180 | 0.05 | New | 0 | ±0 | |
| Internationalist Socialist Workers' Party (POSI)6 | 7,976 | 0.05 | +0.02 | 0 | ±0 | |
| Family and Life Party (PFyV) | 7,958 | 0.05 | New | 0 | ±0 | |
| New Green Left (NIV) | 6,876 | 0.04 | New | 0 | ±0 | |
| National Democracy (DN) | 6,314 | 0.04 | ±0.00 | 0 | ±0 | |
| The Phalanx (FE) | 5,935 | 0.04 | –0.01 | 0 | ±0 | |
| The Unemployed (Los Parados) | 5,314 | 0.03 | New | 0 | ±0 | |
| Commoners' Land–Castilian Nationalist Party (TC–PNC) | 5,267 | 0.03 | –0.03 | 0 | ±0 | |
| Spanish Phalanx of the CNSO (FE–JONS) | 4,484 | 0.03 | New | 0 | ±0 | |
| Communist Party of the Peoples of Spain–Internationalist Struggle (PCPE–LI) | 4,281 | 0.03 | –0.09 | 0 | ±0 | |
| Humanist Party (PH) | 3,923 | 0.03 | –0.03 | 0 | ±0 | |
| Spanish Democratic Party (PADE) | 3,454 | 0.02 | –0.06 | 0 | ±0 | |
| Regionalist Party of the Leonese Country (PREPAL) | 3,308 | 0.02 | –0.01 | 0 | ±0 | |
| Catalan State (EC) | 2,594 | 0.02 | New | 0 | ±0 | |
| We–People's Unity (Nós–UP) | 2,516 | 0.02 | New | 0 | ±0 | |
| Authentic Phalanx (FA) | 2,008 | 0.01 | New | 0 | ±0 | |
| Liberal Coalition (CL) | 1,719 | 0.01 | New | 0 | ±0 | |
| Carlist Party (PC) | 1,600 | 0.01 | New | 0 | ±0 | |
| Liberal Centrist Union (UCL) | 1,544 | 0.01 | New | 0 | ±0 | |
| Basque Citizens (EH) | n/a | n/a | –1.45 | 0 | –1 | |
| Blank ballots | 95,014 | 0.61 | –1.08 | |||
| Total | 15,512,282 | 54 | –10 | |||
| Valid votes | 15,512,282 | 99.02 | –0.19 | |||
| Invalid votes | 154,209 | 0.98 | +0.19 | |||
| Votes cast / turnout | 15,666,491 | 45.14 | –17.91 | |||
| Abstentions | 19,039,553 | 54.86 | +17.91 | |||
| Registered voters | 34,706,044 | |||||
| Sources[17][18] | ||||||
1999
| Parties and coalitions | Popular vote | Seats | ||||
|---|---|---|---|---|---|---|
| Votes | % | ±pp | Total | +/− | ||
| People's Party (PP) | 8,410,993 | 39.74 | –0.38 | 27 | –1 | |
| Spanish Socialist Workers' Party–Progressives (PSOE–p) | 7,477,823 | 35.33 | +4.54 | 24 | +2 | |
| United Left–United and Alternative Left (IU–EUiA)1 | 1,221,566 | 5.77 | –6.15 | 4 | –5 | |
| Convergence and Union (CiU) | 937,687 | 4.43 | –0.23 | 3 | ±0 | |
| European Coalition (CE)2 | 677,094 | 3.20 | +1.03 | 2 | +2 | |
| Nationalist Coalition–Europe of the Peoples (CN–EP)3 | 613,968 | 2.90 | +0.06 | 2 | ±0 | |
| Galician Nationalist Bloc (BNG) | 349,079 | 1.65 | +0.90 | 1 | +1 | |
| Basque Citizens (EH)4 | 306,923 | 1.45 | +0.48 | 1 | +1 | |
| The Greens–Left of the Peoples (LV–IP)5 | 300,874 | 1.42 | –0.11 | 0 | ±0 | |
| The Greens–Green Group (LV–GV) | 138,835 | 0.66 | +0.07 | 0 | ±0 | |
| Centrist Union–Democratic and Social Centre (UC–CDS) | 38,911 | 0.18 | –0.81 | 0 | ±0 | |
| Leonese People's Union (UPL) | 33,604 | 0.16 | New | 0 | ±0 | |
| Confederation of Feminist Organizations (COFEM/FEMEK) | 28,901 | 0.14 | New | 0 | ±0 | |
| Communist Party of the Peoples of Spain (PCPE) | 26,189 | 0.12 | –0.04 | 0 | ±0 | |
| Asturian Renewal Union (URAS) | 22,400 | 0.11 | New | 0 | ±0 | |
| Party for Independence (PI) | 17,544 | 0.08 | New | 0 | ±0 | |
| Spanish Democratic Party (PADE) | 16,001 | 0.08 | New | 0 | ±0 | |
| United Extremadura (EU) | 15,716 | 0.07 | ±0.00 | 0 | ±0 | |
| Asturianist Party (PAS) | 15,299 | 0.07 | –0.01 | 0 | ±0 | |
| Independent Spanish Phalanx (FEI) | 13,940 | 0.07 | +0.04 | 0 | ±0 | |
| Commoners' Land–Castilian Nationalist Party (TC–PNC)6 | 13,267 | 0.06 | +0.04 | 0 | ±0 | |
| Alliance for National Unity (AUN) | 12,486 | 0.06 | New | 0 | ±0 | |
| Humanist Party (PH) | 12,415 | 0.06 | +0.02 | 0 | ±0 | |
| The Phalanx (FE) | 10,792 | 0.05 | New | 0 | ±0 | |
| Independent Socialists of Extremadura (SIEx) | 10,040 | 0.05 | New | 0 | ±0 | |
| Regionalist Unity of Castile and León (URCL) | 9,950 | 0.05 | ±0.00 | 0 | ±0 | |
| Andalusia Assembly (A) | 8,750 | 0.04 | New | 0 | ±0 | |
| Natural Law Party (PLN) | 8,671 | 0.04 | New | 0 | ±0 | |
| Party of Self-employed of Spain and Spanish Independent Groups (PAE–I) | 8,394 | 0.04 | New | 0 | ±0 | |
| Valencian Community Alternative (ACV) | 8,073 | 0.04 | New | 0 | ±0 | |
| National Democracy (DN) | 8,053 | 0.04 | New | 0 | ±0 | |
| Andecha Astur (AA) | 7,321 | 0.03 | New | 0 | ±0 | |
| Union of Regions (UDR) | 7,251 | 0.03 | New | 0 | ±0 | |
| Extremaduran Coalition (PREx–CREx)7 | 7,230 | 0.03 | ±0.00 | 0 | ±0 | |
| Regionalist Party of the Leonese Country (PREPAL) | 6,977 | 0.03 | ±0.00 | 0 | ±0 | |
| Coalition for the Repeal of the Maastricht Treaty (DM)8 | 5,664 | 0.03 | –0.01 | 0 | ±0 | |
| Blank ballots | 357,583 | 1.69 | +0.54 | |||
| Total | 21,166,264 | 64 | ±0 | |||
| Valid votes | 21,166,264 | 99.21 | –0.33 | |||
| Invalid votes | 168,684 | 0.79 | +0.33 | |||
| Votes cast / turnout | 21,334,948 | 63.05 | +3.91 | |||
| Abstentions | 12,505,484 | 36.95 | –3.91 | |||
| Registered voters | 33,840,432 | |||||
| Sources[19][20] | ||||||
1994
| Parties and coalitions | Popular vote | Seats | ||||
|---|---|---|---|---|---|---|
| Votes | % | ±pp | Total | +/− | ||
| People's Party (PP) | 7,453,900 | 40.12 | +18.71 | 28 | +13 | |
| Spanish Socialist Workers' Party (PSOE)1 | 5,719,707 | 30.79 | –9.43 | 22 | –5 | |
| United Left (IU) | 2,497,671 | 13.44 | +7.38 | 9 | +5 | |
| Convergence and Union (CiU)2 | 865,913 | 4.66 | +0.12 | 3 | +1 | |
| Nationalist Coalition (CN)3 | 518,532 | 2.79 | +0.18 | 2 | +1 | |
| For the Europe of the Peoples (PEP)4 | 239,339 | 1.29 | –0.14 | 0 | –1 | |
| Forum–Democratic and Social Centre (Foro–CDS) | 183,418 | 0.99 | –6.16 | 0 | –5 | |
| Popular Unity (HB) | 180,324 | 0.97 | –0.73 | 0 | –1 | |
| Andalusian Coalition–Andalusian Power (PA–PAP)5 | 140,445 | 0.76 | –1.10 | 0 | –1 | |
| Galician Nationalist Bloc (BNG) | 139,221 | 0.75 | +0.46 | 0 | ±0 | |
| Green Group (GV) | 109,567 | 0.59 | New | 0 | ±0 | |
| Ruiz-Mateos Group (Ruiz-Mateos) | 82,410 | 0.44 | –3.40 | 0 | –2 | |
| The Greens–Ecologist Confederation of Catalonia (EV–CEC)6 | 42,237 | 0.23 | –0.07 | 0 | ±0 | |
| Communist Party of the Peoples of Spain (PCPE) | 29,692 | 0.16 | –0.34 | 0 | ±0 | |
| Hunting, Fishing, Nature, Tradition (CPNT) | 29,025 | 0.16 | New | 0 | ±0 | |
| Revolutionary Workers' Party (POR) | 16,144 | 0.09 | New | 0 | ±0 | |
| Asturianist Party (PAS)7 | 14,846 | 0.08 | +0.05 | 0 | ±0 | |
| United Extremadura (EU)8 | 13,580 | 0.07 | ±0.00 | 0 | ±0 | |
| Spanish Phalanx of the CNSO (FE–JONS) | 11,733 | 0.06 | –0.09 | 0 | ±0 | |
| Regionalist Unity of Castile and León (URCL) | 10,019 | 0.05 | New | 0 | ±0 | |
| Natural Law Party (PLN) | 7,845 | 0.04 | New | 0 | ±0 | |
| Humanist Party (PH) | 7,499 | 0.04 | –0.08 | 0 | ±0 | |
| Coalition for a New Socialist Party (CNPS)9 | 7,349 | 0.04 | –0.07 | 0 | ±0 | |
| Regionalist Party of the Leonese Country (PREPAL) | 6,197 | 0.03 | New | 0 | ±0 | |
| Independent Spanish Phalanx (FEI) | 5,602 | 0.03 | New | 0 | ±0 | |
| Carlist Traditionalist Communion (CTC) | 5,226 | 0.03 | New | 0 | ±0 | |
| Justice and Welfare Party (JyB) | 4,992 | 0.03 | New | 0 | ±0 | |
| Extremaduran Regionalist Party (PREx) | 4,836 | 0.03 | New | 0 | ±0 | |
| National Democratic Alternative (ADN) | 4,689 | 0.03 | New | 0 | ±0 | |
| Carlist Party (PC) | 4,640 | 0.02 | –0.03 | 0 | ±0 | |
| Galician Alternative (AG) | 4,431 | 0.02 | New | 0 | ±0 | |
| GPOR–PST (LVS) Coalition (GPOR–PST)10 | 3,765 | 0.02 | –0.22 | 0 | ±0 | |
| Lanzarote Independents Party (PIL) | 0 | 0.00 | New | 0 | ±0 | |
| The Greens of the Region of Murcia (LVRM) | 0 | 0.00 | New | 0 | ±0 | |
| Canarian Nationalist Party (PNC) | 0 | 0.00 | New | 0 | ±0 | |
| Left of the Peoples (IP)11 | n/a | n/a | –0.81 | 0 | –1 | |
| Blank ballots | 213,621 | 1.15 | –0.12 | |||
| Total | 18,578,415 | 64 | +4 | |||
| Valid votes | 18,578,415 | 99.54 | +0.56 | |||
| Invalid votes | 85,640 | 0.46 | –0.56 | |||
| Votes cast / turnout | 18,664,055 | 59.14 | +4.43 | |||
| Abstentions | 12,894,944 | 40.86 | –4.43 | |||
| Registered voters | 31,558,999 | |||||
| Sources[21][22] | ||||||
1989
| Parties and coalitions | Popular vote | Seats | ||||
|---|---|---|---|---|---|---|
| Votes | % | ±pp | Total | +/− | ||
| Spanish Socialist Workers' Party (PSOE) | 6,275,552 | 39.57 | +0.51 | 27 | –1 | |
| People's Party (PP)1 | 3,395,015 | 21.41 | –4.13 | 15 | –2 | |
| Democratic and Social Centre (CDS) | 1,133,429 | 7.15 | –3.11 | 5 | –2 | |
| United Left (IU) | 961,742 | 6.06 | +0.81 | 4 | +1 | |
| Convergence and Union (CiU) | 666,602 | 4.20 | –0.23 | 2 | –1 | |
| Ruiz-Mateos Group (Ruiz-Mateos)2 | 608,560 | 3.84 | +3.23 | 2 | +2 | |
| Nationalist Coalition (CN)3 | 303,038 | 1.91 | +0.16 | 1 | +1 | |
| Andalusian Party (PA) | 295,047 | 1.86 | +0.90 | 1 | +1 | |
| Left of the Peoples (IP)4 | 290,286 | 1.83 | +0.47 | 1 | +1 | |
| Popular Unity (HB) | 269,094 | 1.70 | –0.17 | 1 | ±0 | |
| For the Europe of the Peoples (PEP)5 | 238,909 | 1.51 | –0.19 | 1 | ±0 | |
| Workers' Party of Spain–Communist Unity (PTE–UC) | 197,095 | 1.24 | +0.08 | 0 | ±0 | |
| Green List (Adhered to the European Greens) (LV)6 | 164,524 | 1.04 | +0.14 | 0 | ±0 | |
| The Ecologist Greens (LVE) | 161,903 | 1.02 | New | 0 | ±0 | |
| Federation of Regional Parties (FPR)7 | 151,835 | 0.96 | –0.16 | 0 | ±0 | |
| Communist Party of the Peoples of Spain–PCC (PCPE–PCC) | 79,970 | 0.50 | New | 0 | ±0 | |
| National Front (FN) | 60,672 | 0.38 | –0.26 | 0 | ±0 | |
| Spanish Vertex Ecological Development Revindication (VERDE) | 58,686 | 0.37 | New | 0 | ±0 | |
| Social Democratic Coalition (CSD) | 52,577 | 0.33 | +0.20 | 0 | ±0 | |
| Green Alternative–Ecologist Movement of Catalonia (AV–MEC) | 47,250 | 0.30 | New | 0 | ±0 | |
| Galician Nationalist Bloc (BNG) | 46,052 | 0.29 | +0.01 | 0 | ±0 | |
| Workers' Socialist Party–Revolutionary Workers' Party (PST–PORE)8 | 38,683 | 0.24 | –0.32 | 0 | ±0 | |
| Europe for Life (EPV) | 30,252 | 0.19 | New | 0 | ±0 | |
| Spanish Phalanx of the CNSO (FE–JONS) | 24,340 | 0.15 | +0.03 | 0 | ±0 | |
| Free Catalonia (CLL) | 19,774 | 0.12 | New | 0 | ±0 | |
| Humanist Party (PH) | 19,356 | 0.12 | ±0.00 | 0 | ±0 | |
| Alliance for the Republic (AxR)9 | 17,189 | 0.11 | –0.02 | 0 | ±0 | |
| Asturian Nationalist Unity (UNA) | 13,165 | 0.08 | New | 0 | ±0 | |
| Centrist Unity–Democratic Spanish Party (PED) | 10,392 | 0.07 | +0.02 | 0 | ±0 | |
| Andalusian Liberation (LA) | 9,421 | 0.06 | +0.01 | 0 | ±0 | |
| Initiative for a European Democracy (IDE) | 8,789 | 0.06 | New | 0 | ±0 | |
| Carlist Party (PC) | 8,477 | 0.05 | New | 0 | ±0 | |
| BACTERIA Electors' Group (BACTERIA) | 0 | 0.00 | New | 0 | ±0 | |
| Blank ballots | 200,794 | 1.27 | +0.28 | |||
| Total | 15,858,470 | 60 | ±0 | |||
| Valid votes | 15,858,470 | 98.98 | +0.17 | |||
| Invalid votes | 163,806 | 1.02 | –0.17 | |||
| Votes cast / turnout | 16,022,276 | 54.71 | –13.81 | |||
| Abstentions | 13,261,706 | 45.29 | +13.81 | |||
| Registered voters | 29,283,982 | |||||
| Sources[23][24] | ||||||
1987
| Parties and coalitions | Popular vote | Seats | ||||
|---|---|---|---|---|---|---|
| Votes | % | ±pp | Total | +/− | ||
| Spanish Socialist Workers' Party (PSOE) | 7,522,706 | 39.06 | n/a | 28 | n/a | |
| People's Alliance (AP) | 4,747,283 | 24.65 | n/a | 17 | n/a | |
| Democratic and Social Centre (CDS) | 1,976,093 | 10.26 | n/a | 7 | n/a | |
| United Left (IU) | 1,011,830 | 5.25 | n/a | 3 | n/a | |
| Convergence and Union (CiU) | 853,603 | 4.43 | n/a | 3 | n/a | |
| Popular Unity (HB) | 360,952 | 1.87 | n/a | 1 | n/a | |
| Coalition for the Europe of the Peoples (EA–ERC–PNG) | 326,911 | 1.70 | n/a | 1 | n/a | |
| Left of the Peoples (IP) | 261,328 | 1.36 | n/a | 0 | n/a | |
| Europeanist Union (PNV–PGN) | 226,570 | 1.18 | n/a | 0 | n/a | |
| Workers' Party of Spain–Communist Unity (PTE–UC) | 222,680 | 1.16 | n/a | 0 | n/a | |
| Andalusian Party (PA) | 185,550 | 0.96 | n/a | 0 | n/a | |
| People's Democratic Party (PDP) | 170,866 | 0.89 | n/a | 0 | n/a | |
| Valencian Union (UV) | 162,128 | 0.84 | n/a | 0 | n/a | |
| National Front (FN) | 122,799 | 0.64 | n/a | 0 | n/a | |
| Social Action (AS) | 116,761 | 0.61 | n/a | 0 | n/a | |
| The Greens (LV) | 107,625 | 0.56 | n/a | 0 | n/a | |
| Regionalist Aragonese Party (PAR) | 105,865 | 0.55 | n/a | 0 | n/a | |
| Canarian Independent Groups (AIC) | 96,895 | 0.50 | n/a | 0 | n/a | |
| Workers' Socialist Party (PST) | 77,132 | 0.40 | n/a | 0 | n/a | |
| Confederation of the Greens (CV) | 65,574 | 0.34 | n/a | 0 | n/a | |
| Galician Nationalist Bloc (BNG) | 53,116 | 0.28 | n/a | 0 | n/a | |
| United Extremadura (EU) | 39,369 | 0.20 | n/a | 0 | n/a | |
| Revolutionary Workers' Party of Spain (PORE) | 30,157 | 0.16 | n/a | 0 | n/a | |
| National Assembly of Medicine Students and Associates (ANEMYA) | 30,143 | 0.16 | n/a | 0 | n/a | |
| Internationalist Socialist Workers' Party (POSI) | 25,270 | 0.13 | n/a | 0 | n/a | |
| Social Democratic Coalition (CSD) | 25,058 | 0.13 | n/a | 0 | n/a | |
| Spanish Phalanx of the CNSO (FE–JONS) | 23,407 | 0.12 | n/a | 0 | n/a | |
| Humanist Platform (PH–FV) | 22,333 | 0.12 | n/a | 0 | n/a | |
| Communist Unification of Spain (UCE) | 21,482 | 0.11 | n/a | 0 | n/a | |
| Majorcan Union (UM) | 19,066 | 0.10 | n/a | 0 | n/a | |
| Valencian Coalition Party (PCV) | 14,749 | 0.08 | n/a | 0 | n/a | |
| Regionalist Party of Cantabria (PRC) | 14,553 | 0.08 | n/a | 0 | n/a | |
| Nationalist Party of Castile and León (PANCAL) | 12,616 | 0.07 | n/a | 0 | n/a | |
| Andalusian Liberation (LA) | 9,881 | 0.05 | n/a | 0 | n/a | |
| Democratic Spanish Party (PED) | 9,146 | 0.05 | n/a | 0 | n/a | |
| Blank ballots | 189,729 | 0.99 | n/a | |||
| Total | 19,261,226 | 60 | n/a | |||
| Valid votes | 19,261,226 | 98.81 | n/a | |||
| Invalid votes | 232,872 | 1.19 | n/a | |||
| Votes cast / turnout | 19,494,098 | 68.52 | n/a | |||
| Abstentions | 8,956,393 | 31.48 | n/a | |||
| Registered voters | 28,450,491 | |||||
| Sources[25][26] | ||||||
Notes
- Note that, once the Treaty of Lisbon came into force on 1 December 2011, Spain's MEP delegation was increased from 50 to 54 and applied retroactively.
- Note that, as a result of Brexit, Spain's MEP delegation may grow to 59, with the additional 5 seats being allocated to PSOE (1), PP (1), Cs (1), Vox (1) and Junts (1).
References
- "Treaty concerning the accession of the Kingdom of Spain and the Portuguese Republic to the European Economic Community and to the European Atomic Energy Community". of 15 November 1985. Official Journal of the European Communities. Retrieved 21 July 2017.
- "Decision amending the Act concerning the election of the representatives of the European Parliament by direct universal suffrage, annexed to Council Decision 76/787/ECSC, EEC, Euratom of 20 September 1976". Council Decision No. 93/81/Euratom, ECSC, EEC of 9 February 1993. Official Journal of the European Communities. Retrieved 21 July 2017.
- "Treaty of Amsterdam amending the Treaty on European Union, the Treaties establishing the European Communities and certain related acts". of 10 November 1997. Official Journal of the European Communities. Retrieved 21 July 2017.
- "Treaty of Nice amending the Treaty on European Union, the Treaties establishing the European Communities and certain related acts". of 10 March 2001. Official Journal of the European Communities. Retrieved 21 July 2017.
- "Treaty of Lisbon amending the Treaty on European Union and the Treaty establishing the European Community". of 17 December 2007. Official Journal of the European Union. Retrieved 21 July 2017.
- "EUOBSERVER : France, Spain set to gain seats in post-Brexit EU parliament". FOCUS Information Agency (in Bulgarian). Retrieved 23 January 2018.
- "MEPs to vote on shrinking Parliament post Brexit". POLITICO. 23 January 2018. Retrieved 23 January 2018.
- Reig Pellicer, Naiara (16 December 2015). "Spanish elections: Begging for the right to vote". cafebabel.co.uk. Retrieved 17 July 2017.
- "General Electoral System Organic Law of 1985". Organic Law No. 5 of 19 June 1985. Official State Gazette (in Spanish). Retrieved 6 March 2017.
- "Representation of the people Institutional Act". www.juntaelectoralcentral.es. Retrieved 16 June 2017.
- Gallagher, Michael (30 July 2012). "Effective threshold in electoral systems". Trinity College, Dublin. Archived from the original on 30 July 2017. Retrieved 22 July 2017.CS1 maint: bot: original URL status unknown (link)
- "Electoral Results Consultation. European Parliament. May 2019. National totals". Ministry of the Interior (in Spanish). Retrieved 26 September 2019.
- "Electoral Results Consultation. European Parliament. May 2014. National totals". Ministry of the Interior (in Spanish). Retrieved 24 September 2017.
- "European election 25 May 2014". historiaelectoral.com (in Spanish). Electoral History. Retrieved 24 September 2017.
- "Electoral Results Consultation. European Parliament. June 2009. National totals". Ministry of the Interior (in Spanish). Retrieved 24 September 2017.
- "European election 7 June 2009". historiaelectoral.com (in Spanish). Electoral History. Retrieved 24 September 2017.
- "Electoral Results Consultation. European Parliament. June 2004. National totals". Ministry of the Interior (in Spanish). Retrieved 24 September 2017.
- "European election 13 June 2004". historiaelectoral.com (in Spanish). Electoral History. Retrieved 24 September 2017.
- "Electoral Results Consultation. European Parliament. June 1999. National totals". Ministry of the Interior (in Spanish). Retrieved 24 September 2017.
- "European election 13 June 1999". historiaelectoral.com (in Spanish). Electoral History. Retrieved 24 September 2017.
- "Electoral Results Consultation. European Parliament. June 1994. National totals". Ministry of the Interior (in Spanish). Retrieved 24 September 2017.
- "European election 12 June 1994". historiaelectoral.com (in Spanish). Electoral History. Retrieved 24 September 2017.
- "Electoral Results Consultation. European Parliament. June 1989. National totals". Ministry of the Interior (in Spanish). Retrieved 24 September 2017.
- "European election 15 June 1989". historiaelectoral.com (in Spanish). Electoral History. Retrieved 24 September 2017.
- "Electoral Results Consultation. European Parliament. June 1987. National totals". Ministry of the Interior (in Spanish). Retrieved 24 September 2017.
- "European election 10 June 1987". historiaelectoral.com (in Spanish). Electoral History. Retrieved 24 September 2017.
External links
- European Election News by European Election Law Association (Eurela)
- List of MEPs europarl.europa.eu