Dutch-speaking electoral college
The Dutch-speaking electoral college is one of three constituencies of the European Parliament in Belgium. It currently elects 12 MEPs using the D'Hondt method of party-list proportional representation. Previously it elected 13 MEPS, until the 2013 accession of Croatia. Before that, it elected 14 MEPs, until the 2007 accession of Bulgaria and Romania.
| Dutch-speaking electoral college | |
|---|---|
| European Parliament constituency | |
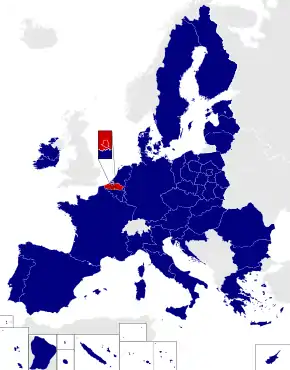
 Location among the current constituencies | |
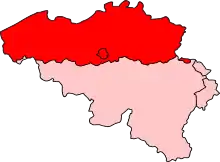
 Shown within Belgium | |
| Member state | Belgium |
| Created | 1979 |
| MEPs | 12 |
| Sources | |
Boundaries
The constituency generally corresponds to the Flemish Community of Belgium, and is sometimes called the Flemish-speaking electoral college.[1][2] In officially bilingual Brussels, electors can choose between lists of this electoral college or those of the French-speaking electoral college.
Prior to the 2011–2012 state reform, electors could choose between both lists not only in Brussels, but in an area encompassing unilingually Dutch territory, Brussels-Halle-Vilvoorde. Some towns in the officially Dutch-speaking Brussels Periphery still have this option however.
Members of the European Parliament
2009 – 2014
- Ivo Belet, CD&V
- Frieda Brepoels / Mark Demesmaeker, N-VA
- Philip Claeys, VB
- Philippe De Backer, Open Vld
- Jean-Luc Dehaene, CD&V
- Saïd El Khadraoui, Sp.a
- Derk-Jan Eppink, LDD
- Annemie Neyts-Uyttebroeck, Open Vld
- Bart Staes, Groen!
- Marianne Thyssen, CD&V
- Kathleen Van Brempt, Sp.a
- Frank Vanhecke, independent
- Guy Verhofstadt, Open Vld
2004 – 2009
- Ivo Belet, CD&V/N-VA
- Frederika Brepoels, CD&V/N-VA
- Philip Claeys, Vlaams Blok
- Jean-Luc Dehaene, CD&V/N-VA
- Karel De Gucht, VLD/Vivant
- Mia De Vits, SPA/Spirit
- Koenraad Dillen, Vlaams Blok
- Saïd El Khadraoui, SPA/Spirit
- Annemie Neyts, VLD/Vivant
- Bart Staes, Groen!
- Dirk Sterckx, VLD/Vivant
- Marianne Thyssen, CD&V/N-VA
- Frank Vanhecke, Vlaams Blok
- Anne Van Lancker, SPA/Spirit
Election results
2014
| Party | EU party | EP group | Votes | % | Change | Seats | Change | |
|---|---|---|---|---|---|---|---|---|
| New-Flemish Alliance | EFA | ECR | 1,123,363 | 26.67 | +16.79 | 4 | +4 | |
| Open Flemish Liberals and Democrats | ALDE | ALDE | 859,254 | 20.40 | −0.2 | 3 | 0 | |
| Christian Democratic and Flemish | EPP | EPP | 840,814 | 19.96 | −3.34 | 2 | −1 | |
| Socialist Party Different | PES | S&D | 555,354 | 13.18 | −0.05 | 1 | −1 | |
| Flemish Interest | EAF | None | 284,891 | 6.76 | −9.14 | 1 | −1 | |
| Green | EGP | Greens/EFA | 447,449 | 10.62 | +2.72 | 1 | 0 | |
| Workers Party of Belgium+ | None | None | 101,246 | 2.40 | +1.42 | 0 | 0 | |
| Total | 4,212,371 | 100 | 12 | −1 | ||||
2009
| Party | Affiliation | Votes | % | Change | Seats | Change | |
|---|---|---|---|---|---|---|---|
| Christian Democratic and Flemish | EPP | 948,123 | 23.26 | −4.89 | 3 | 0 | |
| Open Flemish Liberals and Democrats | ELDR | 837,884 | 20.56 | −1.35 | 3 | 0 | |
| Flemish Interest | None | 647,170 | 15.88 | −7.28 | 2 | −1 | |
| Socialist Party Different | PES | 539,393 | 13.23 | −4.60 | 2 | −1 | |
| New-Flemish Alliance | EFA/EPP-ED group (previous term) | 402,545 | 9.88 | +9.88 | 1 | 0 | |
| Green! | EGP | 322,149 | 7.90 | −0.08 | 1 | 0 | |
| List Dedecker | None, (joined ECR) | 296,699 | 7.28 | N/A | 1 | N/A | |
| Workers Party of Belgium+ | None | 40,057 | 0.98 | +0.37 | 0 | 0 | |
| Social Liberal Party | EFA | 26,541 | 0.65 | N/A | 0 | N/A | |
| Others | 15,383 | 0.38 | 0 | ||||
| Total | 4,075,944 | 100 | 13 | −1 | |||
2004
| Party | Affiliation | Votes | % | Change | Seats | Change | |
|---|---|---|---|---|---|---|---|
| Christian Democratic and Flemish/New Flemish Alliance | 1,131,119 | 28.15 | +6.47 | 4 | +1 | ||
| Vlaams Blok | 930,731 | 23.16 | +8.07 | 3 | +1 | ||
| Flemish Liberals and Democrats | 880,279 | 21.91 | −1.7 | 3 | 0 | ||
| Social Progressive Alternative-Spirit | 716,317 | 17.83 | +3.62 | 3 | +1 | ||
| Groen! | 320,874 | 7.99 | −3.99 | 1 | −1 | ||
| Workers Party of Belgium | 24,807 | 0.62 | 0.05 | 0 | 0 | ||
| Left Socialist Party | 14,166 | 0.35 | N/A | 0 | N/A | ||
| Total | 4,018,293 | 100 | 14 | 0 | |||
1999
| Party | Affiliation | Votes | % | Change | Seats | Change | |
|---|---|---|---|---|---|---|---|
| Flemish Liberals and Democrats | 847,099 | 21.88% | +3.52% | 3 | 0 | ||
| Christian People's Party | 839,720 | 21.68% | −5.75% | 3 | −1 | ||
| Vlaams Blok | 584,392 | 15.09% | +2.53% | 2 | 0 | ||
| Socialist Party | 550,237 | 14.21% | −3.42% | 2 | −1 | ||
| People's Union-ID | 471,238 | 12.17% | +5.08% | 2 | +1 | ||
| Agalev-Groen | 464,042 | 11.98% | +1.25% | 2 | +1 | ||
| Vivant | 67,107 | 1.73% | N/A | 0 | N/A | ||
| Others | 48,589 | 1.25% | 0 | 0 | |||
| Total | 3,872,424 | 100 | 14 | 0 | |||
1994
| Party | Affiliation | Votes | % | Change | Seats | Change | |
|---|---|---|---|---|---|---|---|
| Christian People's Party | 1,013,266 | 27.43% | −6.65% | 4 | −1 | ||
| Flemish Liberals and Democrats | 678,421 | 18.36% | +1.26% | 3 | +1 | ||
| Socialist Party | 651,371 | 17.63% | −2.41% | 3 | 0 | ||
| Vlaams Blok | 463,919 | 12.56% | +5.97% | 2 | +1 | ||
| Agalev | 396,198 | 10.73% | −1.47% | 1 | 0 | ||
| People's Union | 262,043 | 7.09% | −1.61% | 1 | +1 | ||
| WOW | 127,504 | 3.45% | N/A | 0 | N/A | ||
| Others | 101,427 | 2.75% | 0 | 0 | |||
| Total | 100 | 14 | +1 | ||||
1989
| Party | Affiliation | Votes | % | Change | Seats | Change | |
|---|---|---|---|---|---|---|---|
| Christian People's Party | 1,247,075 | 34.08% | +1.55% | 5 | +1 | ||
| Socialist Party | 733,242 | 20.04% | −8.09% | 3 | −1 | ||
| Party for Freedom and Progress | 625,561 | 17.10% | +2.91% | 2 | 0 | ||
| Agalev-Groen | 446,539 | 12.20% | +5.12% | 1 | 0 | ||
| People's Union-EVA | 318,153 | 8.70% | −5.21% | 1 | −1 | ||
| Vlaams Blok | 241,117 | 6.59% | +4.49% | 1 | +1 | ||
| Others | 47,219 | 1.29% | 0 | 0 | |||
| Total | 100 | 13 | 0 | ||||
1984
| Party | Affiliation | Votes | % | Change | Seats | Change | |
|---|---|---|---|---|---|---|---|
| Christian People's Party | 1,132,682 | 32.53% | −15.56% | 4 | −3 | ||
| Socialist Party | 979,702 | 28.13% | +7.23% | 4 | +1 | ||
| Party for Freedom and Progress | 494,277 | 14.19% | −1.13% | 2 | 0 | ||
| People's Union | 484,494 | 13.91% | +4.20% | 2 | +1 | ||
| Agalev | 246,712 | 7.08% | +4.75% | 1 | +1 | ||
| Vlaams Blok | 73,174 | 2.10% | N/A | 0 | N/A | ||
| Others | 71,239 | 2.05% | 0 | 0 | |||
| Total | 100 | 13 | 0 | ||||
1979
| Party | Affiliation | Votes | % | Change | Seats | Change | |
|---|---|---|---|---|---|---|---|
| Christian People's Party | 1,607,941 | 48.09% | N/A | 7 | N/A | ||
| Belgian Socialist Party | 698,889 | 20.90% | N/A | 3 | N/A | ||
| Party for Freedom and Progress | 512,363 | 15.32% | N/A | 2 | N/A | ||
| People's Union | 324,540 | 9.71% | N/A | 1 | N/A | ||
| Agalev | 77,986 | 2.33% | N/A | 0 | N/A | ||
| Others | 121,783 | 3.64% | N/A | 0 | N/A | ||
| Total | 100 | N/A | 13 | N/A | |||
Returned members
Below are all members since the creation of the Dutch-speaking electoral college. Only members who were sworn in at the beginning of each parliamentary turn are mentioned. Under Belgian law, MEPs can resign and be automatically replaced. This was the case, for example, for Johan Van Overtveldt, who resigned to become Minister of Finance on 14 October 2014 and was replaced by Sander Loones.
References
- https://www.internationalviewpoint.org/spip.php?page=imprimir_articulo&id_article=22
- Perrineau, P.; Grunberg, G.; Ysmal, C. (30 April 2016). Europe at the Polls: The European Elections of 1999. Springer. ISBN 9781137044419 – via Google Books.