Economy of Chad
The economy of Chad suffers from the landlocked country's geographic remoteness, drought, lack of infrastructure, and political turmoil. About 85% of the population depends on agriculture, including the herding of livestock. Of Africa's Francophone countries, Chad benefited least from the 50% devaluation of their currencies in January 1994. Financial aid from the World Bank, the African Development Bank, and other sources is directed largely at the improvement of agriculture, especially livestock production. Because of lack of financing, the development of oil fields near Doba, originally due to finish in 2000, was delayed until 2003. It was finally developed and is now operated by Exxon Mobil Corporation.
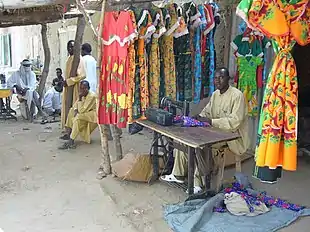 A tailor in Chad | |
| Currency | Central African CFA franc (XAF) |
|---|---|
| Calendar year | |
Trade organisations | AU, AfCFTA, WTO |
| Statistics | |
| GDP | |
GDP growth |
|
GDP per capita | |
GDP by sector |
|
| 4.037% (2018 est.)[1] | |
Population below poverty line | 80% (2001 est.) |
Labour force | 4.293 million (2007) |
Labour force by occupation | agriculture: 80% (subsistence farming, herding, and fishing); industry and services: 20% (2006 est.) |
Main industries | oil, cotton textiles, meatpacking, brewing, natron (sodium carbonate), soap, cigarettes, construction materials |
| External | |
| Exports | $4.114 billion (2011 est.) |
Export goods | oil, cattle, cotton, gum arabic |
Main export partners |
|
| Imports | $3.512 billion (2011 est.) |
Import goods | machinery and transportation equipment, industrial goods, foodstuffs, textiles |
Main import partners |
|
FDI stock | $4.5 billion (2006 est.) |
Gross external debt | $1.769 billion (2011 est.) |
| Public finances | |
| Revenues | $2.501 billion (2011 est.) |
| Expenses | $3.482 billion (2011 est.) |
| Economic aid | $238.3 million (recipient) note – $125 million committed by Taiwan (1997); $30 million committed by African Development Bank; ODA $150 million (2001) |
Foreign reserves | $887.5 million (31 December 2011 est.) |
Agriculture
Chad produced in 2018:
- 987 thousand tons of sorghum;
- 893 thousand tons of peanut;
- 756 thousand tons of millet;
- 484 thousand tonnes of yam (8th largest producer in the world);
- 475 thousand tons of sugarcane;
- 437 thousand tons of maize;
- 284 thousand tons of cassava;
- 259 thousand tons of rice;
- 255 thousand tons of sweet potato;
- 172 thousand tons of sesame seed;
- 151 thousand tons of bean;
- 120 thousand tons of cotton;
In addition to smaller productions of other agricultural products. [8]
Macro-economic trend
The following table shows the main economic indicators in 1980–2017.
| Year[9] | 1980 | 1985 | 1990 | 1995 | 2000 | 2005 | 2006 | 2007 | 2008 | 2009 | 2010 | 2011 | 2012 | 2013 | 2014 | 2015 | 2016 | 2017 |
|---|---|---|---|---|---|---|---|---|---|---|---|---|---|---|---|---|---|---|
| GDP in $ (PPP) |
1.90 Bln. | 3.04 Bln. | 4.41 Bln. | 5.77 Bln. | 7.12 Bln. | 16.09 Bln. | 16.69 Bln. | 17.70 Bln. | 18.60 Bln. | 19.51 Bln. | 22.44 Bln. | 22.93 Bln. | 25.41 Bln. | 27.30 Bln. | 29.71 Bln. | 30.56 Bln. | 28.96 Bln. | 28.55 Bln. |
| GDP per capita in $ (PPP) |
433 | 610 | 781 | 874 | 952 | 1,781 | 1,802 | 1,864 | 1,911 | 1,956 | 2,195 | 2,188 | 2,366 | 2,480 | 2,633 | 2,642 | 2,443 | 2,344 |
| GDP Growth (real) |
−6.0% | 7.9% | 3.2% | −0.8% | −0.9% | 28.5% | 0.6% | 3.3% | 3.1% | 4.1% | 13.6% | 0.1% | 8.8% | 5.8% | 6.9% | 1.8% | −6.4% | −3.1% |
| Government debt (Percentage of GDP) |
... | ... | ... | ... | 68% | 28% | 26% | 22% | 20% | 32% | 30% | 31% | 29% | 31% | 42% | 44% | 52% | 53% |
Other statistics
GDP: purchasing power parity – $28.62 billion (2017 est.)
GDP – real growth rate: -3.1% (2017 est.)
GDP – per capita: $2,300 (2017 est.)
Gross national saving: 15.5% of GDP (2017 est.)
GDP – composition by sector:
agriculture:
52.3% (2017 est.)
industry:
14.7% (2017 est.)
services:
33.1% (2017 est.)
Population below poverty line:: 46.7% (2011 est.)
Distribution of family income – Gini index: 43.3 (2011 est.)
Inflation rate (consumer prices): -0.9% (2017 est.)
Labor force: 5.654 million (2017 est.)
Labor force – by occupation: agriculture 80%, industry and services 20% (2006 est.)
Budget:
revenues:
1.337 billion (2017 est.)
expenditures:
1.481 billion (2017 est.)
Budget surplus (+) or deficit (-): -1.5% (of GDP) (2017 est.)
Public debt: 52.5% of GDP (2017 est.)
Industries: oil, cotton textiles, brewing, natron (sodium carbonate), soap, cigarettes, construction materials
Industrial production growth rate: -4% (2017 est.)
electrification: total population: 4% (2013)
electrification: urban areas: 14% (2013)
electrification: rural areas: 1% (2013)
Electricity – production: 224.3 million kWh (2016 est.)
Electricity – production by source:
fossil fuel:
98%
hydro:
0%
nuclear:
0%
other renewable:
3% (2017)
Electricity – consumption: 208.6 million kWh (2016 est.)
Electricity – exports: 0 kWh (2016 est.)
Electricity – imports: 0 kWh (2016 est.)
Agriculture – products: cotton, sorghum, millet, peanuts, sesame, corn, rice, potatoes, onions, cassava (manioc, tapioca), cattle, sheep, goats, camels
Exports: $2.464 billion (2017 est.)
Exports – commodities: oil, livestock, cotton, sesame, gum arabic, shea butter
Exports – partners: US 38.7%, China 16.6%, Netherlands 15.7%, UAE 12.2%, India 6.3% (2017)
Imports: $2.16 billion (2017 est.)
Imports – commodities: machinery and transportation equipment, industrial goods, foodstuffs, textiles
Imports – partners: China 19.9%, Cameroon 17.2%, France 17%, US 5.4%, India 4.9%, Senegal 4.5% (2017)
Debt – external: $1.724 billion (31 December 2017 est.)
Reserves of foreign exchange and gold: $22.9 million (31 December 2017 est.)
See also
References
- "World Economic Outlook Database, October 2019". IMF.org. International Monetary Fund. Retrieved 6 December 2019.
- "Global Economic Prospects, January 2020 : Slow Growth, Policy Challenges" (PDF). openknowledge.worldbank.org. World Bank. p. 147. Retrieved 19 January 2020.
- "Human Development Index (HDI)". hdr.undp.org. HDRO (Human Development Report Office) United Nations Development Programme. Retrieved 11 December 2019.
- "Inequality-adjusted Human Development Index (IHDI)". hdr.undp.org. HDRO (Human Development Report Office) United Nations Development Programme. Retrieved 11 December 2019.
- "Ease of Doing Business in Chad". Doingbusiness.org. Retrieved 23 January 2017.
- "Export Partners of Chad". CIA World Factbook. 2015. Retrieved 26 July 2016.
- "Import Partners of Chad". CIA World Factbook. 2015. Retrieved 26 July 2016.
- Chad production in 2018, by FAO
- "Report for Selected Countries and Subjects". www.imf.org. Retrieved 24 August 2018.
- General
 This article incorporates public domain material from the CIA World Factbook website https://www.cia.gov/the-world-factbook/.