Economy of Turkmenistan
The economy of Turkmenistan is one of the fastest-growing economies in the world. Turkmenistan is largely a desert country with intensive agriculture in irrigated areas, and huge gas and oil resources. In terms of natural gas reserves, it is ranked 6th in the world. Turkmenistan’s two largest agricultural crops are cotton, most of which is produced for export, and wheat, which is domestically consumed.[8] Turkmenistan is among the top ten producers of cotton in the world.
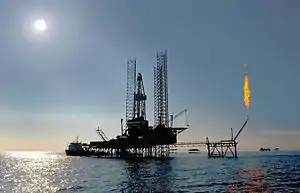 Oil platform of Turkmenistan in Caspian sea | |
| Currency | Turkmenistan manat (TMT) |
|---|---|
| Calendar year | |
Trade organisations | CIS, ECO |
| Statistics | |
| GDP | |
| GDP rank | 84th (PPP, 2016) |
GDP growth |
|
GDP per capita | |
GDP by sector | agriculture (12.7%), industry (50.1%), services (37.7%) (2018 est.) |
| 13.15% (2018)[1] | |
Population below poverty line | 0.2% (2018 est.) |
Labour force | 2.405 million (2018 est.) |
Labour force by occupation | agriculture (44.2%), industry (15%), services (40.8%) (2018 est.) |
| Unemployment | 15% (2020 est.) |
Main industries | natural gas, oil, petroleum products, textiles, food processing |
| External | |
| Exports | |
Export goods | gas, crude oil, petrochemicals, textiles, cotton fiber |
Main export partners | |
| Imports | |
Import goods | machinery and equipment, chemicals, foodstuffs |
Main import partners | |
Gross external debt | |
| Public finances | |
| N/A | |
| Revenues | $9.047 billion (2019 est.) |
| Expenses | $10.659 billion (2019 est.) |
| Economic aid | $16 million from the US (As of 2001) |
Foreign reserves | |
From 1998 to 2005, Turkmenistan suffered from a lack of adequate export routes for natural gas and from obligations on extensive short-term external debt. At the same time, however, total exports rose by an average of roughly 15% per year from 2003 to 2008, largely because of higher international oil and gas prices. As in the Soviet era, central planning and state control pervade the system, and the Niyazov government (in power 1991–2006) consistently rejected market reform programs.[9] The state subsidized a wide variety of commodities and services from the early 1990s to 2019.[9][10][11] Since his election in 2007, President Gurbanguly Berdimuhamedow has unified the country's dual currency exchange rate, ordered the redenomination of the manat, reduced state subsidies for gasoline, and initiated development of a special tourism zone (Awaza) on the Caspian Sea. Since 2009, Turkmenistan has maintained the fixed exchange rate. As of 2018, 1 United States dollar is equivalent to 3.50[12] Turkmenistan manat.[8]
Fiscal policy
The budget-making process and its implementation go according to the Law “On Budget System”. The law fixes legal foundations of organizing management and operating budget system, regulates interrelations between budgets of all levels. The government of Turkmenistan discusses the state budget draft and submits it to the President of Turkmenistan. Prior to one month of the beginning of the financial year the President of Turkmenistan submits to the Assembly of Turkmenistan (Mejlis) the state budget draft for consideration and adoption.
Budget statistics are unreliable because the government spends large amounts of extra-budgetary funds.[9] In 2012, it is estimated that the budget expenditures are US$26.9 billion, and revenues are US$26.4 billion, creating a slight deficit. Ministry of Finance is responsible for state finances.
Industry
In the post-Soviet era, Turkmenistan’s industrial sector has been dominated increasingly by the fuel and cotton processing industries to the detriment of light industry.[9] Between 1991 and 2004, some 14 new cotton-processing plants were opened, sharply increasing the capability of processing domestically produced cotton.[9] The construction industry depends mainly on government building projects because construction of private housing is a low priority.[9]
Gas
Turkmenistan's major gas deposits were discovered in its central and eastern areas in the 1940s and '50s, and in the 1980s the republic became the second largest producer of gas in the Soviet Union, behind the Russian SFSR. During the Soviet era gas was exported mainly to other Soviet republics, as Turkmenistan steadily increased delivery from about 9.2 million m³ in 1940 to about 234 million m³ in 1960 and about 51 billion m³ in 1975. This export was under centralised control, and most of the export revenue was absorbed into the Soviet central budget.[13]
This changed in 1991, when Turkmenistan gained independence and established full control over gas export and export revenues. However, Soviet-era pipelines dictate that much of the gas goes to the Caucasus, Russia and Ukraine. In the 1990s many of Turkmenistan's gas customers in the CIS failed to pay on time or negotiated barter deals. In the mid-1990s Turkmenistan stopped delivering gas to some CIS members, citing failure to pay and unprofitable barter deals. At the same time, the government tried to attract investments in building gas pipelines via Iran to Turkey and Western Europe via Afghanistan to Pakistan. Neither deal went through due to an unfavourable regional security environment and high costs; inflation and the budget deficit rose but privatisation was resisted. In the late 1990s the government renegotiated its export and price arrangements with Gazprom and renewed deliveries to Georgia, Ukraine, and some other countries.[13] It also opened its first pipeline not to pass through Russia, the Korpezhe-Kurt Kui Pipeline.
.svg.png.webp)
The figures in the table below are taken from BP Statistical Review.[14] The unit is billion cubic meters (bcm) per year. It lists gas production, consumption, exports as total and also divided into countries. One observes that the production and exports peaked in 2008 and dramatically decreased in 2009. This is due an explosion that occurred in the Central Asia–Center gas pipeline system in April 2009 for which Turkmenistan blamed Gazprom.[15] Russia later restricted its imports to only around 10 bcm, and then 5 bcm.[16] Production and exports started increasing again from 2010 owing to the opening of the Central Asia–China gas pipeline. Exports to Russia ceased in late 2015. Supplies to Iran were cancelled in early 2017, with Ashgabat claiming Tehran owed some $1.8 billion for supplies delivered nearly 10 years before.[17]
| Year | Production | Consumption | Exports | Exports to Russia | Exports to China | Exports to Iran |
|---|---|---|---|---|---|---|
| 2005 | 57 | 16.1 | 40.9 | 35.1 | 0 | 5.8 |
| 2008 | 66.1 | 20.5 | 45.6 | 39.1 | 0 | 6.5 |
| 2009 | 36.4 | 19.9 | 16.7 | 10.7 | 0 | 5.8 |
| 2010 | 42.4 | 22.6 | 19.7 | 9.7 | 3.5 | 6.5 |
| 2011 | 59.5 | 25.0 | 34.5 | 10.1 | 14.3 | 10.2 |
| 2012 | 62.3 | 23.3 | 41.1 | 9.9 | 21.3 | 9.0 |
| 2013 | 62.3 | 22.3 | 40.1 | 9.9 | 24.4 | 4.7 |
Oil
As of 2010, Turkmenistan had 202,000 barrels per day oil production. Dragon Oil produced around 50,000 barrels per day. Domestic consumption was about 100,000 barrels per day.[18] The oil production data in the table below are taken from BP Statistical Review.[14]
| Year | Production (thsd. bar/d) | Production (mil. tonnes/y) | Consumption (mil. tonnes/y) |
|---|---|---|---|
| 2002 | 183 | 9 | 3.9 |
| 2005 | 193 | 9.5 | 4.3 |
| 2008 | 208 | 10.3 | 5.1 |
| 2009 | 211 | 10.4 | 4.6 |
| 2010 | 217 | 10.7 | 4.5 |
| 2011 | 217 | 10.7 | 4.7 |
| 2012 | 222 | 11.0 | 4.8 |
| 2013 | 231 | 11.4 | 4.8 |
Construction materials
Three cement plants operate in Turkmenistan. These are located near Ashgabat, Balkan and Lebap provinces. Total production in 2013 is estimated to exceed 2 million tonnes.[19]
Chemicals
Turkmenistan is building a potash plant with annual capacity of 2.8 million tonnes of potash fertilizers. The bulk of them will be exported since the domestic demand in the country does not exceed 10,000 tonnes.[20] The construction of the plant that would produce 640,000 tonnes/year of urea (carbamide) and 400,000 tonnes/year of ammonia is due to be completed by June 2014. [21] By 2016, the country is expected to produce 1m tonnes of urea (carbamide) annually. [22]
In 2017, a potash plant with a capacity of over 1 million tonnes, which is said to be Central Asia's biggest, is opened.[23]
Services
Banking
The financial system is under full state control.[9] The banking system, which was reduced substantially after the 1998 financial crisis, includes 12 national banks.[9] These institutions have the same basic division of responsibility as in the Soviet era, overseen by the Central Bank of Turkmenistan.[9] Lending operations and household savings have not been important functions of this system.[9] In 2005 an estimated 95 percent of loans went to state enterprises.[9] Turkmengosstrakh, the state insurance firm, has a complete monopoly of the very small insurance industry.[9]
Tourism
Agriculture
In the early 2000s, the contribution of Turkmenistan’s state-run agriculture sector to gross domestic product increased under close state supervision.[9] As during the Soviet era, cotton is the dominant agricultural commodity because it is an export staple.[9] However, in recent years state policy makers have increased the range of crops with the aim of making Turkmenistan self-sufficient in food.[9] In the post-Soviet era, the area planted to grains (mainly wheat) has nearly tripled.[9] However, most agricultural land is of poor quality and requires irrigation.[9] Turkmenistan’s irrigation infrastructure and water-use policies have not responded efficiently to this need.[9] Irrigation now depends mainly on the decrepit karakum Canal, which carries water across Turkmenistan from the Amu Darya.[9] The Dostluk dam, opened at Serakhs on the Iranian border in 2005, has increased available irrigation water and improved efficiency.[9] Plans call for a similar dam on the Atrek River west of Ashgabat.[9] Private farmers grow most of Turkmenistan’s fruits and vegetables (chiefly tomatoes, watermelons, grapes, and onions), but all production phases of the main cash crops—grain and cotton—remain under state control.[9] In 2006 grain crop failures led to steadily increasing bread lines and reinstatement of a ration system in most regions.[9] At the root of those failures was a culture of falsifying output figures together with poor administration of the sector.[9] In 2018, independent media reported food shortages in the country, with hundreds of people queuing for hours to buy bread and flour.[24]
Turkmenistan produced in 2018:
- 1.0 million tons of wheat;
- 618 thousand tons of cotton (14th largest world producer);
- 350 thousand tons of tomato;
- 293 thousand tons of potato;
- 249 thousand tons of watermelon;
- 243 thousand tons of sugar beet;
- 239 thousand tons of grape;
- 130 thousand tons of rice;
- 87 thousand tons of onion;
- 71 thousand tons of cabbage;
- 70 thousand tons of carrot;
- 63 thousand tons of apple;
- 63 thousand tons of vegetable;
In addition to smaller productions of other agricultural products, like apricot (34 thousand tons), plum (33 thousand tons) and peach (29 thousand tons). [25]
Trade
In 2016, Turkmenistan exported $6.987 billion in goods making it the 100th largest export economy in the world. The top exports are gas, crude oil, petrochemicals, textiles and cotton fiber. Most of these exports will end up in China 70%, Turkey 5.3%, Italy 5.3%, Afghanistan 4.5%, Russia 4.1%.[26]
Also in that year Turkmenistan imported $5.001 billion in goods resulting it being the 121th largest importer in the world. This is $1.986 billion less in imports compared to exports meaning the country has a positive trade balance of $1.986 billion. Its top imports are machinery and equipment, chemicals, foodstuffs. The top origins of imports are Turkey 26.4%, Russia 10.5%, Japan 8.6%, Germany 8.2%, South Korea 7.8%, China 7.2%, Italy 5.2%.[26]
Labor
Recent statistics are not available on Turkmenistan’s labor force.[9] In 2004 the labor force was estimated to include more than 2.3 million workers, 48.2 percent of whom worked in agriculture, 37.8 percent in services, and 14 percent in industry and construction.[9] Because the state dominates the economy, an estimated 90 percent of workers are in effect state employees.[9] Unemployment statistics are not available because unemployment does not exist officially.[9] It is believed that downsizing the government workforce, which began in 2003, increased unemployment in subsequent years.[9] However, it is estimated that the unemployment rate is 11% as of a 2014 estimate.[26]
The average monthly salary in Turkmenistan in 2007 was 507 TMT (178 USD) and the same indicator in 2012 was 943 TMT (331 USD).[27] This is equivalent to 86% increase. This dramatic increase is mainly due to the yearly increase of 10% of the state employer salaries by the Government of Turkmenistan.
Privatization
By 1999, privatization in trade, catering, consumer services was fully completed. Availability of adequate legal base, opening of credit lines, including the foreign ones, simplified the procedure of private enterprises opening and licensing, led to enlargement of the sphere of entrepreneurship. The private sector dominates in agriculture (60%), trade (70%) and transport (56%). Turkmenistan plans to privatize several state companies during 2013-2016. [28]
Macro-economic trend
The following table shows the main economic indicators in 1993–2017.[29]
| Year | 1993 | 1995 | 2000 | 2005 | 2006 | 2007 | 2008 | 2009 | 2010 | 2011 | 2012 | 2013 | 2014 | 2015 | 2016 | 2017 |
|---|---|---|---|---|---|---|---|---|---|---|---|---|---|---|---|---|
| GDP in $ (PPP) |
10.90 Bln. | 8.90 Bln. | 11.56 Bln. | 27.48 Bln. | 31.44 Bln. | 35.84 Bln. | 41.93 Bln. | 44.84 Bln. | 49.55 Bln. | 58.01 Bln. | 65.61 Bln. | 73.45 Bln. | 82.50 Bln. | 88.78 Bln. | 95.48 Bln. | 103.49 Bln. |
| GDP per capita in $ (PPP) |
2,975 | 2,070 | 2,554 | 5,755 | 6,509 | 7,335 | 8,478 | 8,954 | 9,740 | 11,212 | 12,455 | 13,687 | 15,093 | 15,952 | 16,922 | 18,126 |
| GDP growth (real) |
−10.0 % | −7.2 % | 18.6 % | 13.0 % | 11.0 % | 11.1 % | 14.7 % | 6.1 % | 9.2 % | 14.7 % | 11.0 % | 10.2 % | 10.3 % | 6.4 % | 6.2 % | 6.5 % |
| Inflation (in Percent) |
3,102.4 % | 1,005.2 % | 23.6 % | 10.7 % | 8.2 % | 6.3 % | 14.5 % | −2.7 % | 4.4 % | 5.3 % | 5.3 % | 6.8 % | 6.0 % | 7.4 % | 3.6 % | 8.0 % |
| Government debt (Pct. of GDP) |
... | ... | 44 % | 5 % | 3 % | 2 % | 3 % | 2 % | 4 % | 10 % | 18 % | 20 % | 17 % | 22 % | 24 % | 28 % |
Other statistics
Household income or consumption by percentage share:
- lowest 10%: 2.6%
- highest 10%: 31.7% (1998)
Industrial production growth rate: official government estimate: 22% (2003 est.)
Electricity:
- production: 15.02 TWh (2009)
- consumption: 11.22 TWh (2009)
- exports: 1.56 TWh (2009)
- imports: 0 kWh (2002)
Electricity - production by source:
- fossil fuel: 99.9%
- hydro: 0.1%
- nuclear: 0%
- other: 0% (2001)
Exchange rates: Turkmen manats per US$1 – 5,200 (January 2000), 5,350 (January 1999), 4,070 (January 1997), 2,400 (January 1996)
in recent years the unofficial rate has hovered around 24,000 to 25,000 Turkmen manats to the dollar. The official rate has consistently been 5,200 Manat to the dollar.
After denomination of national currency the last official rate is 3.5 manat-1$[30]
Notes
- "World Economic Outlook Database, October 2019". IMF.org. International Monetary Fund. Retrieved 16 November 2019.
- "Global Economic Prospects, June 2020". openknowledge.worldbank.org. World Bank. p. 80. Retrieved 16 June 2020.
- "Human Development Index (HDI)". hdr.undp.org. HDRO (Human Development Report Office) United Nations Development Programme. Retrieved 11 December 2019.
- "Inequality-adjusted Human Development Index (IHDI)". hdr.undp.org. HDRO (Human Development Report Office) United Nations Development Programme. Retrieved 11 December 2019.
- "Export Partners of Turkmenistan". CIA World Factbook. 2018. Retrieved 2019-08-03.
- "Import Partners of Turkmenistan". CIA World Factbook. 2015. Retrieved 2016-08-03.
- "Turkmen Central Bank reserves". PortTurkey.com. 31 December 2014. Retrieved 2015-07-06.
- "The World Factbook". Retrieved 4 March 2015.
- "Country Profile: Turkmenistan" (PDF). Federal Research Division, Library of Congress. February 2007. Archived from the original on March 11, 2013.
 This article incorporates text from this source, which is in the public domain.CS1 maint: unfit URL (link)
 - Turkmenistan Cuts Last Vestiges Of Program For Free Utilities
- "Lines, price rises and expensive booze – the cost of happiness in Turkmenistan | Eurasianet". eurasianet.org. Retrieved 2020-11-03.
- "XE: (USD/TMT) US Dollar to Turkmenistani Manat Rate". www.xe.com. Retrieved 2016-06-18.
- Abazov, Rafis. Historical Dictionary of Turkmenistan, p. 64-5. Scarecrow Press, 2005, ISBN 0-8108-5362-0.
- "Statistical Review of World Energy 2014". Retrieved 4 March 2015.
- "BBC NEWS - Asia-Pacific - Russia blamed for pipeline blast". Retrieved 4 March 2015.
- "Is Turkmenistan Being Pulled Into Russia's Orbit?". RadioFreeEurope/RadioLiberty. Retrieved 2019-01-17.
- "Is Turkmenistan Being Pulled Into Russia's Orbit?". RadioFreeEurope/RadioLiberty. Retrieved 2019-01-17.
- http://www.eia.gov/cabs/Turkmenistan/pdf.pdf
- "В Туркменистане в этом году будет произведено более 2 миллионов тонн цемента - Экономика - Гундогар". Retrieved 4 March 2015.
- "Archived copy". Archived from the original on 2013-10-07. Retrieved 2013-10-05.CS1 maint: archived copy as title (link)
- "Turkmenistan approves agreement for new urea, ammonia plant". Retrieved 4 March 2015.
- "Turkmenistan seeks to triple fertiliser production". Central Asia Online. 22 November 2013. Retrieved 4 March 2015.
- "Turkmenistan opens potash plant, targets Chinese, Indian markets". Reuters. 31 Mar 2017. Retrieved 17 April 2017.
- The Sights And Sounds Of Discontent In Turkmenistan
- Turkmenistan production in 2018, by FAO
- "The World Factbook-TURKMENISTAN". Central Intelligence Agency. Retrieved 9 January 2018.
- "Archived copy" (PDF). Archived from the original (PDF) on 2013-03-30. Retrieved 2013-04-10.CS1 maint: archived copy as title (link)
- "Turkmenistan plans sell-offs, but not in oil and gas". Reuters. 12 January 2013. Retrieved 4 March 2015.
- "Report for Selected Countries and Subjects". Retrieved 2018-08-28.
- "The State Bank for Foreign Economic Affairs of Turkmenistan". Retrieved 8 March 2018.
External links
- Turkmenistan: Potential 'Super-Giant' Emerges On Energy Scene
- Turkmenistan: The ongoing development of agricultural industry
- Map of the oil and gas infrastructure in Turkmenistan
| Sovereign states |
|
|---|---|
| States with limited recognition | |
| Dependencies and other territories |
|
| |