Economy of Russia
The economy of Russia is an upper-middle income[27] mixed and transition economy. It is the fifth-largest national economy in Europe, the eleventh-largest in the world in terms of nominal GDP, and the sixth-largest by purchasing power parity.
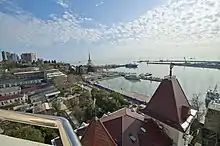
 MIBC, one of the largest financial centres of Europe | |
| Currency | Russian ruble (RUB, ₽) |
|---|---|
| calendar year[1] | |
Trade organizations | WTO, BRICS, GECF, CIS, APEC, EAEU, G-20 and others |
Country group |
|
| Statistics | |
| Population | |
| GDP | |
| GDP rank | |
GDP growth | |
GDP per capita | |
GDP per capita rank | |
GDP by sector |
|
| 3.2% (2020 est.)[5] | |
Population below poverty line | |
Labor force | |
Labor force by occupation |
|
| Unemployment | |
Average gross salary | RUB 46,057 / €497 / $584 monthly (September 2019) |
| RUB 40,070 / €433 / $509 monthly (September 2019) | |
Main industries |
|
| External | |
| Exports | |
Export goods | Petroleum and petroleum products, natural gas, metals, wood and wood products, chemicals, and a wide variety of civilian and military manufactures |
Main export partners |
|
| Imports | |
Import goods | Machinery, vehicles, pharmaceutical products, plastic, semi-finished metal products, meat, fruits and nuts, optical and medical instruments, iron, steel |
Main import partners |
|
FDI stock | |
Gross external debt | |
| Public finances | |
| 10.6% of GDP (2017)[20] | |
| −1.4% (of GDP) (2017 est.)[1] | |
| Revenues | 258.6 billion (2017 est.)[1] |
| Expenses | 281.4 billion (2017 est.)[1] |
Foreign reserves | |
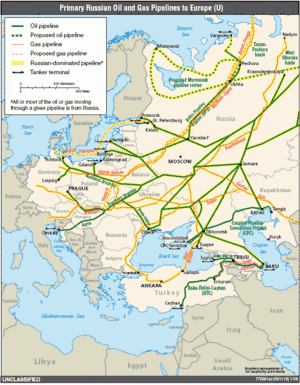
Russia's vast geography is an important determinant of its economic activity, with some sources estimating that Russia contains over 30 percent of the world's natural resources.[28][29][30] The World Bank estimates the total value of Russia's natural resources at $75 trillion US dollars.[31][32] Russia relies on energy revenues to drive most of its growth. Russia has an abundance of oil, natural gas and precious metals, which make up a major share of Russia's exports. As of 2012, the oil-and-gas sector accounted for 16% of GDP, 52% of federal budget revenues and over 70% of total exports.[33][34] Russia is considered an "energy superpower".[35][36] It has the world's largest proven natural gas reserves and is the largest exporter of natural gas. It is also the second-largest exporter of petroleum.
Russia has a large and sophisticated arms industry, capable of designing and manufacturing high-tech military equipment, including a fifth-generation fighter jet, nuclear powered submarines, firearms, and short range/long range ballistic missiles. The value of Russian arms exports totalled $15.7 billion in 2013—second only to the US. Top military exports from Russia include combat aircraft, air defence systems, ships and submarines.[37][38]
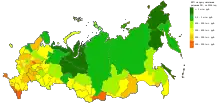
The economic development of the country has been uneven geographically with the Moscow region contributing a very large share of the country's GDP.[39] There has been a substantial rise in wealth inequality in Russia since 1990 (far more than in China and other Eastern European countries).[40][41] Credit Suisse has described Russian wealth inequality as so extreme compared to other countries that it "deserves to be placed in a separate category."[41][42] One study estimates that "the wealth held offshore by rich Russians is about three times larger than official net foreign reserves, and is comparable in magnitude to total household financial assets held in Russia."[40]
Economic history
Industrialization under Stalin
Beginning in 1928, the course of the Soviet Union's economy was guided by a series of five-year plans. By the 1950s, the Soviet Union had rapidly evolved from a mainly agrarian society into a major industrial power.[43] By the 1970s the Soviet Union entered the Era of Stagnation. The complex demands of the modern economy and inflexible administration overwhelmed and constrained the central planners. The volume of decisions facing planners in Moscow became overwhelming. The cumbersome procedures for bureaucratic administration foreclosed the free communication and flexible response required at the enterprise level for dealing with worker alienation, innovation, customers, and suppliers.

From 1975 to 1985, corruption and data fiddling became common practice among bureaucracy to report satisfied targets and quotas thus entrenching the crisis. Starting in 1986, Mikhail Gorbachev attempted to address economic problems by moving towards a market-oriented socialist economy. Gorbachev's policies of Perestroika failed to rejuvenate the Soviet economy; instead, a process of political and economic disintegration culminated in the breakup of the Soviet Union in 1991.
Transition to market economy (1991–98)
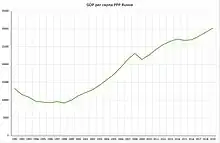
Following the collapse of the Soviet Union, Russia had undergone a radical transformation, moving from a centrally planned economy to a globally integrated market economy. Corrupt and haphazard privatization processes turned over major state-owned firms to politically connected "oligarchs", which has left equity ownership highly concentrated.
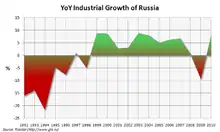
Yeltsin's program of radical, market-oriented reform came to be known as a "shock therapy". It was based on the policies associated with the Washington Consensus, recommendations of the IMF and a group of top American economists, including Larry Summers.[44][45][46] With deep corruption afflicting the process, the result was disastrous, with real GDP falling by more than 40% by 1999, hyperinflation which wiped out personal savings, crime and destitution spreading rapidly.[47][48] This was accompanied by a drop in the standard of living, including surging economic inequality and poverty,[49] along with increased excess mortality[50][51] and a decline in life expectancy.[52]
The majority of state enterprises were privatized amid great controversy and subsequently came to be owned by insiders[53] for far less than they were worth.[45] For example, the director of a factory during the Soviet regime would often become the owner of the same enterprise. Under the government's cover, outrageous financial manipulations were performed that enriched a narrow group of individuals at key positions of business and government.[54] Many of them promptly invested their newfound wealth abroad producing an enormous capital flight.[55]
Difficulties in collecting government revenues amid the collapsing economy and a dependence on short-term borrowing to finance budget deficits led to the 1998 Russian financial crisis.
In the 1990s Russia was "the largest borrower" from the International Monetary Fund with loans totaling $20 billion. The IMF was the subject of criticism for lending so much as Russia introduced little of the reforms promised for the money and a large part of these funds could have been "diverted from their intended purpose and included in the flows of capital that left the country illegally".[56][57]
Recovery and growth (1999–2008)
Russia bounced back from the August 1998 financial crash with surprising speed. Much of the reason for the recovery was the devaluation of the ruble, which made domestic producers more competitive nationally and internationally.
Between 2000 and 2002, there was a significant amount of pro-growth economic reforms including a comprehensive tax reform, which introduced a flat income tax of 13%; and a broad effort at deregulation which improved the situation for small and medium-sized enterprises.[58]
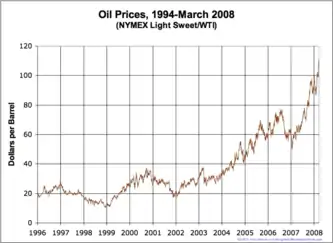
Between 2000 and 2008, Russian economy got a major boost from rising commodity prices. GDP grew on average 7% per year.[47] Disposable incomes more than doubled and in dollar-denominated terms increased eightfold.[59] The volume of consumer credit between 2000–2006 increased 45 times, fuelling a boom in private consumption.[60][61] The number of people living below poverty line declined from 30% in 2000 to 14% in 2008.[62][63]
Inflation remained a problem however, as the central bank aggressively expanded money supply to combat appreciation of the ruble.[64] Nevertheless, in 2007 the World Bank declared that the Russian economy achieved "unprecedented macroeconomic stability".[65] Until October 2007, Russia maintained impressive fiscal discipline with budget surpluses every year from 2000.[58]
2009–14
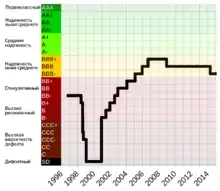
Russian banks were hit by the global credit crunch in 2008, though no long term damage was done thanks to proactive and timely response by the government and central bank, which shielded the banking system from effects of the global financial crisis.[66][67][68] A sharp, but brief recession in Russia was followed by a strong recovery beginning in late 2009.[47]
After eighteen years of negotiations, Russia's membership to the WTO was accepted in 2011.[69] In 2013, Russia was labeled a high-income economy by the World Bank.[70]
Russian leaders repeatedly spoke of the need to diversify the economy away from its dependence on oil and gas and foster a high-technology sector.[71] In 2012 oil, gas and petroleum products accounted for over 70% of total exports.[34] This economic model appeared to show its limits, when after years of strong performance, Russian economy expanded by a mere 1.3% in 2013.[47] Several reasons have been proposed to explain the slowdown, including prolonged recession in the EU, which is Russia's largest trading partner, stagnant oil prices, lack of spare industrial capacity and demographic problems.[72] Political turmoil in neighboring Ukraine added to the uncertainty and suppressed investment.
According to a survey provided by Financial Times in 2012, Russia was second by economic performance among G20, following Saudi Arabia, based on seven measures: gross domestic product growth, budget deficit and government debt for 2012; economic recovery – output compared with the pre-crisis peak; change in debt since 2009; change in unemployment from 2009 to 2013; and, finally, the deviation of the current account from balance. Forbes magazine lists Russia as #91 in the best countries for business. The country has made substantial improvement recently in areas like innovation and trade freedom. (Forbes ranks each country in a number of categories and draws from multiple sources such as the World Economic Forum, World Bank, and Central Intelligence Agency).[73] Since 2008, Moscow has been by Forbes magazine repeatedly named the "billionaire capital of the world".
2014–present
.svg.png.webp)
Following the annexation of Crimea in March 2014 and Russia's involvement in the ongoing conflict in Ukraine, the United States, the EU (and some other European countries), Canada and Japan imposed sanctions on Russia's financial, energy and defense sectors.[74] This led to the decline of the Russian ruble and sparked fears of a Russian financial crisis. Russia responded with sanctions against a number of countries, including a one-year period of total ban on food imports from the European Union and the United States. As of 2018 it is estimated that Western sanctions may have reduced Russian economy by as much as 6%.[75]
According to the Russian economic ministry in July 2014, GDP growth in the first half of 2014 was 1%. The ministry projected growth of 0.5% for 2014.[76] The Russian economy grew by a better than expected 0.6% in 2014.[77] As of the 2nd quarter of 2015 inflation, compared to the second quarter of 2014, was 8%; the economy had contracted by 4.6% as the economy entered recession.[78] To balance the state budget in 2015, oil price would need to be around US$74 as opposed to US$104 for 2014.[79] Russia used to have around US$500 billion in forex reserves, but holds US$360 billion in summer 2015 and plans to keep accumulating forex reserves for years to come, until they reach again $500 billion.[80]
According to Herman Gref from Sberbank, the contraction of the Russian economy is "not a crisis but rather a new reality" to which it has to adapt, primarily due to the low oil prices. He also presented a number of metrics demonstrating the change - the GDP has fallen by 3.7%, income - by 4.3%, salaries - by 9.3% and inflation reached 12.9%. However, during December 2015 it was reported by the Moscow Times that the number of people living at or below the poverty line, "those with monthly incomes of less than 9,662 rubles ($140)" increased by more than 2.3 million people.[81] Russia is rated one of the most unequal of the world’s major economies.[82]
During 2014-2015 a quarter of banks in Russia left the market, the expenses of Russian bank guarantee fund reached 1 trillion roubles plus additional government funds for recapitalisation of banks reached 1.9 trillion roubles.[83]
At the end of 2016, the United States imposed further sanctions on the Russian Federation in response to what the US government said was Russian interference in the 2016 United States elections.[84]
In 2016, the Russian economy was the sixth largest in the world by PPP and twelfth largest at market exchange rates.[85] Between 2000 and 2012 Russia's energy exports fueled a rapid growth in living standards, with real disposable income rising by 160%.[86] In dollar-denominated terms this amounted to a more than sevenfold increase in disposable incomes since 2000.[59] In the same period, unemployment and poverty more than halved and Russians' self-assessed life satisfaction also rose significantly.[87] This growth was a combined result of the 2000s commodities boom, high oil prices, as well as prudent economic and fiscal policies.[88] However, these gains have been distributed unevenly, as the 110 wealthiest individuals were found in a report by Credit Suisse to own 35% of all financial assets held by Russian households.[89][90] Russia also has the second-largest volume of illicit money outflows, having lost over $880 billion between 2002 and 2011 in this way.[91] Since 2008 Forbes has repeatedly named Moscow the "billionaire capital of the world".[92]
The Russian economy risked going into recession from early 2014, mainly due to falling oil prices, sanctions, and the subsequent capital flight.[93] While in 2014 GDP growth remained positive at 0.6%,[94] in 2015 the Russian economy shrunk by 3.7% and was expected to shrink further in 2016.[95] However, the World Bank and the IMF estimated that Russia's economy will begin to recover by 2017.[96][97] By 2016, the Russian economy rebounded with 0.3% GDP growth and is officially out of the recession. The growth continued in 2017, with an increase of 1.5%.[98][99]
In January 2016, the US company Bloomberg rated Russia's economy as the 12th most innovative in the world,[100] up from 14th in January 2015[101] and 18th in January 2014.[102] Russia has the world's 15th highest patent application rate, the 8th highest concentration of high-tech public companies, such as internet and aerospace and the third highest graduation rate of scientists and engineers.[100] Former finance minister Alexei Kudrin has said that Russia needs to reduce geopolitical tensions to improve its economic conditions.[103]
In May 2016 the average nominal monthly wages fell below $450 per month,[104] and tax on the income of individuals is payable at the rate of 13% on most incomes.[105] Approximately 19.2 million of Russians lived below the national poverty line in 2016,[106] significantly up from 16.1 million in 2015.
A poll completed in 2018 among 1400 managers of non-hydrocarbons Russian businesses demonstrated high level of pessimism, with majority describing the economic situation in the country as "catastrophic". 73% of respondents in large businesses and 77% in medium and small are dealing with a "crisis" while only 4% described it as "good". 50% suffered from increased real tax rates, 60% were hit by increasing public utilities tariffs.[107]
In 2019 Russia’s Natural Resources and Environment Ministry estimated the value of natural resources to $844 billion or 60% of the country's GDP.[108]
_Per_Capita_in_2015.svg.png.webp) Gross domestic product (PPP) per capita in 2014
Gross domestic product (PPP) per capita in 2014 Unemployment rate of Russia since the fall of the Soviet Union
 Map showing countries who have higher or lower GDP per capita than Russia
Data
The following table shows the main economic indicators in 1992–2018. Inflation under 5% is in green.[109]
| Year | GDP (in bn. US$ PPP) |
GDP per capita (in US$ PPP) |
GDP growth (real) |
Inflation rate (in Percent) |
Unemployment (in Percent) |
Government debt (in % of GDP) |
|---|---|---|---|---|---|---|
| 1992 | 1,703.0 | 11,482 | n/a | n/a | 5,2 % | n/a |
| 1993 | n/a | |||||
| 1994 | n/a | |||||
| 1995 | n/a | |||||
| 1996 | n/a | |||||
| 1997 | n/a | |||||
| 1998 | n/a | |||||
| 1999 | 92.1 % | |||||
| 2000 | ||||||
| 2001 | ||||||
| 2002 | ||||||
| 2003 | ||||||
| 2004 | ||||||
| 2005 | ||||||
| 2006 | ||||||
| 2007 | ||||||
| 2008 | ||||||
| 2009 | ||||||
| 2010 | ||||||
| 2011 | ||||||
| 2012 | ||||||
| 2013 | ||||||
| 2014 | ||||||
| 2015 | ||||||
| 2016 | ||||||
| 2017 | ||||||
| 2018[110] |
Currency and central bank
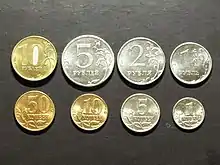

The Russian ruble (sign: ₽) is the unit of currency of the Russian Federation. It is also accepted as legal tender in the partially recognised states of Abkhazia and South Ossetia and the unrecognised Donetsk People's Republic and Lugansk People's Republic.
The Russian monetary system is managed by the Bank of Russia. Founded on 13 July 1990 as the State Bank of the RSFSR, Bank of Russia assumed responsibilities of the central bank following the breakup of the Soviet Union in 1991.[111]
According to the Constitution, Bank of Russia is an independent entity, with the primary responsibility of protecting the stability of the national currency, the ruble. It is also chief regulator and a lender of last resort for the banking industry in Russia. Bank of Russia is governed by a board of directors, headed by a governor who is appointed by the President of Russia.[112]
Large current account surpluses caused rapid real appreciation of the ruble between 2000 and 2008. Bank of Russia attempted to combat this trend by aggressively accumulating foreign currency reserves. This was a major contributing cause to relatively high inflation rates during this period. Central bank policy evolved following the global financial crisis. Instead of targeting a fixed exchange rate vs a basket of dollar and euro, Bank of Russia shifted its focus to inflation targeting.[64][113] In April 2012 Russian inflation reached record low of 3.6%.[114]
The Russian Central Bank has been planning to free float the Russian ruble and has been widening the currency's trading band and expects the ruble to be fully free floating in 2015. However, the ruble has fallen significantly since 2013 when the central bank announced the plans. On 3 October 2014, the USD–RUB exchange reached 40.00 Russian rubles to USD, up from 32.19 rubles the same time last year; this represents a decline of 24.26%. The Russian Central bank has stated that Russian banks are able to withstand a devaluation of up to 25%–30% in January 2014 when the ruble has just begun its decline, therefore Central Bank intervention may be needed; however, plans to free-float the currency continued, as of January 2014.[115][116] The Russian Central Bank spent $88 billion in order to stem the fall of the ruble in 2014. Due to central bank intervention and stronger oil prices the ruble rebounded sharply at the beginning of 2015. In April 2015, Ksenia Yudaeva, Bank of Russia's First Deputy Governor, stated that she believed the currency had stabilized at the present rate of around 50 rubles to USD.[117][118]
Along with a rapid devaluation of the ruble, inflation in Russia has greatly increased. In October 2014 the rate of inflation was reported to be 8%, although this was well below the 2333.30% inflation rate experienced in 1992.[119] In November 2017 inflation was at its lowest ever point since the fall of the Soviet Union at 2.5%.
Public policy
Fiscal policy
Russia was expected to have a Government Budget deficit of $21 billion in 2016.[120] The budget deficit narrowed to 0.6% of GDP in 2017 from 2.8% in 2016.[121]
National wealth fund
On 1 January 2004, the Government of Russia established the Stabilization fund of the Russian Federation as a part of the federal budget to balance it if oil price falls. On 1 February 2008 the Stabilization fund was divided into two parts. The first part is a reserve fund equal to 10% of GDP (10% of GDP equals to about $200 billion now), and was to be invested in a similar way as the Stabilization Fund. The second part is the National Prosperity Fund of Russian Federation. Deputy Finance Minister Sergei Storchak estimated it would reach 600–700 billion rubles by 1 February 2008. The National Prosperity Fund is to be invested into more risky instruments, including the shares of foreign companies.[122]
Public debt
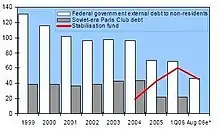
Russia has very low debt-to-GDP ratio, it is among the lowest ratios in the world. Most of its external debt is private. In 2016 its debt to GDP ratio was 12%.[123]
As a chief successor state to the Soviet Union, Russia took up the responsibility for paying USSR's external debts.[124]
Protectionism
Russia is one of the leading nations for protectionist policies. According to the independent Global Trade Alert, Russia put significant protectionist policies in place. Russia's strategic trade bloc consisting of Russia, Belarus, and Kazakhstan is responsible for a significant portion of worldwide protectionism during 2013.[125] Of the protectionist policies, 43% were targeted bailouts and direct subsidies for local companies, while 15% were tariff measures.[126] Since 2008, Russia has implemented many protectionist measures, about the same scale as did India, however the most protectionist state was the United States.[127]
Corruption
.png.webp)
Starting from Putin's second term, very few corruption cases have been the subject of outrage. Putin's system is remarkable for its ubiquitous and open merging of the civil service and business, as well as its use of relatives, friends, and acquaintances to benefit from budgetary expenditures and take over state property. Corporate, property, and land raiding is commonplace.[128]
Corruption in Russia is perceived as a significant problem[129] impacting all aspects of life, including public administration,[130] law enforcement,[131] healthcare[132] and education.[133] The phenomenon of corruption is strongly established in the historical model of public governance in Russia and attributed to general weakness of rule of law in Russia.[130] According to the 2018 results of the Corruption Perceptions Index by Transparency International, Russia ranked 138th out of 180 countries with a score of 28 out of 100, tying with Guinea, Iran, Lebanon, Mexico and Papua New Guinea.[134]
There are many different estimates of the actual cost of corruption.[128] According to official government statistics from Rosstat, the "shadow economy" occupied only 15% of Russia's GDP in 2011, and this included unreported salaries (to avoid taxes and social payments) and other types of tax evasion.[135] According to Rosstat's estimates, corruption in 2011 amounted to only 3.5 to 7% of GDP. In comparison, some independent experts maintain that corruption consumes as much of 25% of Russia's GDP.[136] A World Bank report puts this figure at 48%.[137] There is also an interesting shift in the main focus of bribery: whereas previously officials took bribes to shut their eyes to legal infractions, they now take them simply to perform their duties.[138] Many experts admit that in recent years corruption in Russia has become a business. In the 1990s, businessmen had to pay different criminal groups to provide a "krysha" (literally, a "roof", i.e., protection). Nowadays, this "protective" function is performed by officials. Corrupt hierarchies characterize different sectors of the economy,[128] including education.[128]
In the end, the Russian population pays for this corruption.[128] For example, some experts believe that rapid increases in monthly bills significantly outpacing the rate of inflation are a direct result of high volumes of corruption at the highest levels.[139] In a 2020 survey 45% of Russian citizens approved tax evasion, a sharp rise from 35% from 2019, and 60% have experienced reduced income in May as compared to February.[140]
Sectors
In Russia, services are the biggest sector of the economy and account for 58% of GDP. Within services the most important segments are: wholesale and retail trade, repair of motor vehicles, motorcycles and personal and household goods (17% of total GDP); public administration, health and education (12%); real estate (9%) and transport storage and communications (7%). Industry contributes 40% to total output. Mining (11% of GDP), manufacturing (13%) and construction (4%) are the most important industry segments. Agriculture accounts for the remaining 2%.

Energy
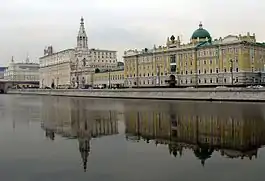
The mineral-packed Ural Mountains and the vast fossil fuel (oil, gas, coal), and timber reserves of Siberia and the Russian Far East make Russia rich in natural resources, which dominate Russian exports. Oil and gas exports, specifically, continue to be the main source of hard currency.
The petroleum industry in Russia is one of the largest in the world. Russia has the largest reserves, and is the largest exporter, of natural gas. It has the second largest coal reserves, the eighth largest oil reserves, and is the largest exporter, or second largest exporter of oil in the world in absolute numbers. It periodically changes positions with Saudi Arabia.[141] Per capita oil production in Russia, though, is not that high. As of 2007, Russia was producing 69.603 bbl/day per 1,000 people, much less than Canada (102.575 bbl/day), Saudi Arabia (371.363 bbl/day), or Norway (554.244 bbl/day), but more than two times the USA (28.083 bbl/day) or the UK (27.807 bbl/day).[142]
Mining
Russia is also a leading producer and exporter of minerals and gold. Russia is the largest diamond-producing nation in the world, estimated to produce over 33 million carats in 2013, or 25% of global output valued at over $3.4 billion, with state-owned ALROSA accounting for approximately 95% of all Russian production.[143]
Expecting the area to become more accessible as climate change melts Arctic ice, and believing the area contains large reserves of untapped oil and natural gas, Russian explorers on 2 August 2007 in submersibles planted the Russian flag on the Arctic seabed, staking a claim to energy sources right up to the North Pole. Reaction to the event was mixed: President Vladimir Putin congratulated the explorers for "the outstanding scientific project", while Canadian officials stated the expedition was just a public show.[144]
Under the Federal Law "On Continental Shelf Development" upon proposal from the federal agency managing the state fund of mineral resources, or its territorial offices, the Russian government approves the list of some sections of the mineral resources that are passed for development without any contests and auctions, some sections of federal importance of the Russian continental shelf, some sections of the mineral resources of federal importance that are situated in Russia and stretch out on its continental shelf, some gas deposits of federal importance that are handed over for prospecting and developing mineral resources under a joint license. The Russian government is also empowered to decide on the handover of the previously mentioned sections of the mineral resources for development without any contests and auctions.
Forestry
Russia has more than a fifth of the world's forests, which makes it the largest forest country in the world.[145] However, according to a 2012 study by the Food and Agriculture Organization of the United Nations and the government of the Russian Federation,[146] the considerable potential of Russian forests is underutilized and Russia's share of the global trade in forest products is less than 4%.[147]
Agriculture

Russia comprises roughly three-quarters of the territory of the former Soviet Union. Following the breakup of the Soviet Union in 1991 and after nearly 10 years of decline, Russian agriculture began to show signs of improvement due to organizational and technological modernization. Northern areas concentrate mainly on livestock, and the southern parts and western Siberia produce grain. The 2014 devaluation of the rouble and imposition of sanctions spurred domestic production, and in 2016 Russia exceeded Soviet grain production levels, and in that year became the world's largest exporter of wheat.[148] In 2016 agriculture surpassed the arms industry as Russia's second largest export sector after oil and gas.[149] As of 2020, Russia faces problems of over-nutrition with over 23% of adults obese and over 57% overweight. Under 2.5% of the population suffer from undernourishment.[150]
Industry
Defense industry
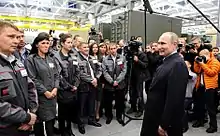

Russia's defense industry employs 2.5 – 3 million people, accounting for 20% of all manufacturing jobs. Russia is the world's second largest conventional arms exporter after the United States. The largest firearm manufacturer in the country, Kalashnikov Concern, produces about 95% of all small arms in Russia and supplies to more than 27 countries around the world.[151] The most popular types of weaponry bought from Russia are Sukhoi and MiG fighters, air defense systems, helicopters, battle tanks, armored personnel carriers and infantry fighting vehicles. The research organization Centre for Analysis of Strategies and Technologies ranked the air defense system producer Almaz-Antey as the industry's most successful company in 2007, followed by aircraft-maker Sukhoi. Almaz-Antey's revenue that year was $3.122 billion, and it had a work force of 81,857 people.[152]
Aerospace

Aircraft manufacturing is an important industry sector in Russia, employing around 355,300 people. The Russian aircraft industry offers a portfolio of internationally competitive military aircraft such as MiG-29 and Su-30, while new projects such as the Sukhoi Superjet 100 are hoped to revive the fortunes of the civilian aircraft segment. In 2009, companies belonging to the United Aircraft Corporation delivered 95 new fixed-wing aircraft to its customers, including 15 civilian models. In addition, the industry produced over 141 helicopters. It is one of the most science-intensive hi-tech sectors and employs the largest number of skilled personnel. The production and value of the military aircraft branch far outstrips other defense industry sectors, and aircraft products make up more than half of the country's arms exports.[153]
Space industry of Russia consists of over 100 companies and employs 250,000 people.[154] The largest company of the industry is RKK Energia, the main manned space flight contractor. Leading launch vehicle producers are Khrunichev and TsSKB Progress. Largest satellite developer is Reshetnev Information Satellite Systems, while NPO Lavochkin is the main developer of interplanetary probes.
Automotive industry

Automobile production is a significant industry in Russia, directly employing around 600,000 people or 0.7% of the country's total workforce. In addition, the industry supports around 2–3 million people in related industries. Russia was the world's 15th largest car producer in 2010, and accounts for about 7% of the worldwide production. In 2009 the industry produced 595,807 light vehicles, down from 1,469,898 in 2008 due to the global financial crisis. The largest companies are light vehicle producers AvtoVAZ and GAZ, while KAMAZ is the leading heavy vehicle producer.
Electronics
Russia is experiencing a regrowth of microelectronics, with the revival of JCS Mikron.[155][156]
Retail
As of 2013, Russians spent 60% of their pre-tax income shopping, the highest percentage in Europe. This is possible because many Russians pay no rent or house payments, owning their own home after privatization of state-owned Soviet housing. Shopping malls were popular with international investors and shoppers from the emerging middle class. Eighty-two malls had been built near major cities including a few that were very large. A supermarket selling groceries is a typical anchor store in a Russian mall.[157]
Retail sales in Russia[158][159]
| Year | 2002 | 2003 | 2004 | 2005 | 2006 | 2007 | 2008 | 2009 | 2010 | 2011 |
|---|---|---|---|---|---|---|---|---|---|---|
| Total retail sales (RUB trillions) | 3.77 | 4.53 | 5.64 | 7.04 | 8.69 | 10.76 | missing year | 14.60 | 16.49 | 19.08 |
Telecommunications
Russia's telecommunications industry is growing in size and maturity. As of December 2007, there were an estimated 4,900,000 broadband lines in Russia.[160]
In 2006, there were more than 300 BWA operator networks, accounting for 5% of market share, with dial-up accounting for 30%, and Broadband Fixed Access accounting for the remaining 65%.[161] In December 2006, Tom Phillips, chief government and regulatory affairs officer of the GSM Association stated:
- "Russia has already achieved more than 100% mobile penetration thanks to the huge popularity of wireless communications among Russians and the government's good work in fostering a market driven mobile sector based on strong competition."[162]
The financial crisis, which had already hit the country at the end of 2008, caused a sharp reduction of the investments by the business sectors and a notable reduction of IT budget made by government in 2008–2009. As a consequence, in 2009 the IT market in Russia declined by more than 20% in ruble terms and by one-third in euro terms. Among the particular segments, the biggest share of the Russian IT market still belongs to hardware.[163]
Key data on the telecommunications market in Russia[161]
| Year | 2004 | 2005 | 2006 | 2007 | 2008 | 2009 | 2010 | 2011 (est.) |
|---|---|---|---|---|---|---|---|---|
| Telecommunications market value (€ bn) | 12.9 | 16.0 | 20.9 | 25.0 | 27.5 | 24.4 | 28.5 | 30.6 |
| Telecommunications market growth rate (%) | 32.0 | 23.5 | 30.6 | 20.2 | 10.0 | −11.4 | 17.1 | 7.3 |
Transportation
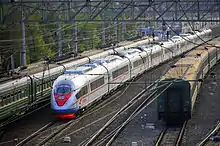
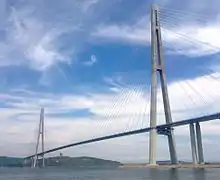
Russian Railways accounts for 2.5%[164] of Russia's GDP. The percentage of freight and passenger traffic that goes by rail is unknown, since no statistics are available for private transportation such as private automobiles or company-owned trucks. In 2007, about 1.3 billion passengers[165] and 1.3 billion tons of freight[166] went via Russian Railways. In 2007 the company owned 19,700 goods and passenger locomotives, 24,200 passenger cars (carriages) (2007) and 526,900 freight cars (goods wagons) (2007).[167] A further 270,000 freight cars in Russia are privately owned.

In 2009 Russia had 128,000 kilometres of common-carrier railroad line, of which about half was electrified and carried most of the traffic; over 40% was double track or better.[168][169]
Construction
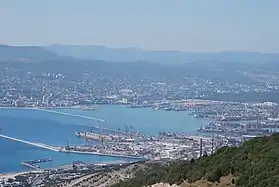
In 2009 the Russian construction industry survived its most difficult year in more than a decade. The 0.8% reduction recorded by the industry for the first three quarters of 2010 looked remarkably healthy in comparison with the 18.4% slump recorded the previous year, and construction firms became much more optimistic about the future than in previous months. The most successful construction firms concluded contracts worth billions of dollars and planned to take on employees and purchase new building machinery. The downturn served to emphasise the importance of the government to the construction market.[170]
Insurance
According to the Central Bank of Russia 422 insurance companies operate on the Russian insurance market by the end of 2013. The concentration of insurance business is significant across all major segments except compulsory motor third party liability market (CMTPL), as the Top 10 companies in 2013 charged 58.1% premiums in total without compulsory health insurance (CHI).[171] Russian insurance market in 2013 demonstrated quite significant rate of growth in operations. Total amount of premiums charged (without CHI) in 2013 is RUB 904.9 bln (increase on 11.8% compared to 2012), total amount of claims paid is RUB 420.8 bln (increase on 13.9% compared to 2012). Premiums to GDP ratio (total without CHI) in 2013 increased to 1.36% compared to 1.31 a year before. The share of premiums in household spending increased to 1.39%. Level of claims paid on the market total without CHI is 46.5%, an insufficient increase compared to 2012. The number of policies in 2013 increased on 0.1% compared to 2012, to 139.6 mln policies.
Although relative indicators of the Russian insurance market returned to pre-crisis levels, the progress is achieved mainly by the increase of life insurance and accident insurance, the input of these two market segments in premium growth in 2013 largely exceeds their share on the market. As before, life insurance and accident insurance are often used by banks as an appendix to a credit contract protecting creditors from the risk of credit default in case of borrower’s death or disability. The rise of these lines is connected, evidently, with the increase in consumer loans, as the total sum of credit obligations of population in 2013 increased by 28% to RUB 9.9 trillion. At the same time premium to GDP ratio net of life and accident insurance remained at the same level of 1.1% as in 2012. Thus, if "banking" lines of business are excluded, Russian insurance market is in stagnation stage for the last four years, as premiums to GDP ratio net of life and accident insurance remains at the same level of 1.1% since 2010.[172]
Information technology
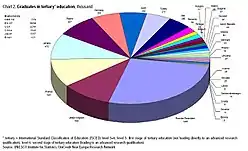
The IT market is one of the most dynamic sectors of the Russian economy. Russian software exports have risen from just $120 million in 2000 to $3.3 billion in 2010.[174] Since the year 2000 the IT market has started growth rates of 30–40% a year, growing by 54% in 2006 alone. The biggest sector in terms of revenue is system and network integration, which accounts for 28.3% of the total market revenues.[175] Meanwhile, the fastest growing segment of the IT market is offshore programming.

Currently, Russia controls 3% of the offshore software development market and is the third leading country (after India and China) among software exporters. Such growth of software outsourcing in Russia is caused by a number of factors. One of them is the supporting role of the Russian Government. The government has launched a program promoting construction of IT-oriented technology parks (Technoparks)—special zones that have an established infrastructure and enjoy a favorable tax and customs regime, in seven different places around the country: Moscow, Novosibirsk, Nizhny Novgorod, Kaluga, Tumen, Republic of Tatarstan and St. Peterburg Regions. Another factor stimulating the IT sector growth in Russia is the presence of global technology corporations such as Intel, Google, Motorola, Sun Microsystems, Boeing, Nortel, Hewlett-Packard, SAP AG, and others, which have intensified their software development activities and opened their R&D centers in Russia.[174]
Under a government decree signed On June 2013, a special "roadmap" is expected to ease business suppliers’ access to the procurement programs of state-owned infrastructure monopolies, including such large ones as Gazprom, Rosneft, Russian Railways, Rosatom, and Transneft. These companies will be expected to increase the proportion of domestic technology solutions they use in their operations. The decree puts special emphasis on purchases of innovation products and technologies. According to the new decree, by 2015, government-connected companies must double their purchases of Russian technology solutions compared to the 2013 level and their purchasing levels must quadruple by 2018.[176]
Russia is one of the few countries in the world with a home grown internet search engine who owns a relevant marketshare as the Russian-based search engine Yandex is used by 53.8% of internet users in the country.[177][178][179]
Known Russian IT companies are ABBYY (FineReader OCR system and Lingvo dictionaries), Kaspersky Lab (Kaspersky Anti-Virus, Kaspersky Internet Security), Mail.Ru (portal, search engine, mail service, Mail.ru Agent messenger, ICQ, Odnoklassniki social network, online media sources).
Tourism
Tourism in Russia has seen rapid growth since the late Soviet period, first domestic tourism and then international tourism. Rich cultural heritage and great natural variety place Russia among the most popular tourist destinations in the world.
In 2013, Russia was visited by 28.4 million tourists being the ninth most visited country in the world.[180] The most visited destinations in Russia are Moscow and Saint Petersburg, recognized as World Cities.
External trade and investment
Trade
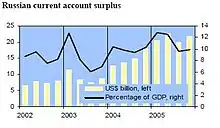
Russia recorded a trade surplus of USD$15.8 billion in 2013.[181] Balance of trade in Russia is reported by the Central Bank of Russia. Historically, from 1997 until 2013, Russia balance of trade averaged 8338.23 USD million reaching an all-time high of 20647 USD million in December 2011 and a record low of −185 USD million in February 1998. Russia runs regular trade surpluses primarily due to exports of commodities.
In 2015, Russia main exports are oil and natural gas (62.8% of total exports), ores and metals (5.9%), chemical products (5.8%), machinery and transport equipment (5.4%) and food (4.7%). Others include: agricultural raw materials (2.2%) and textiles (0.2%).[182]
Russia imports food, ground transports, pharmaceuticals and textile and footwear. Main trading partners are: China (7% of total exports and 10% of imports), Germany (7% of exports and 8% of imports) and Italy. This page includes a chart with historical data for Russia balance of trade. Exports in Russia decreased to 39038 USD million in January 2013 from 48568 USD million in December 2012. Exports in Russia is reported by the Central Bank of Russia. Historically, from 1994 until 2013, Russia Exports averaged 18668.83 USD million reaching an all-time high of 51338 USD million in December 2011 and a record low of 4087 USD million in January 1994. Russia is the 16th largest export economy in the world (2016)[183] and is a leading exporter of oil and natural gas. In Russia, services are the biggest sector of the economy and account for 58% of GDP. Within services the most important segments are: wholesale and retail trade, repair of motor vehicles, motorcycles and personal and household goods (17% of total GDP); public administration, health and education (12%); real estate (9%) and transport storage and communications (7%). Industry contributes 40% to total output. Mining (11% of GDP), manufacturing (13%) and construction (4%) are the most important industry segments. Agriculture accounts for the remaining 2%. This page includes a chart with historical data for Russia Exports. Imports in Russia decreased to 21296 USD million in January 2013 from 31436 USD million in December 2012. Imports in Russia is reported by the Central Bank of Russia. Historically, from 1994 until 2013, Russia imports averaged 11392.06 USD million reaching an all-time high of 31553 USD million in October 2012 and a record low of 2691 USD million in January 1999. Russia main imports are food (13% of total imports) and ground transports (12%). Others include: pharmaceuticals, textile and footwear, plastics and optical instruments. Main import partners are China (10% of total imports) and Germany (8%). Others include: Italy, France, Japan and United States. This page includes a chart with historical data for Russia Imports.
Foreign trade of Russia - Russian export and import[184]
| Year | 2005 | 2006 | 2007 | 2008 | 2009 | 2010 | 2011 | 2012 | 2013 | 2014 | 2015 | 2016 |
|---|---|---|---|---|---|---|---|---|---|---|---|---|
| Export (US$ Billions) | 241 | 302 | 352 | 468 | 302 | 397 | 517 | 525 | 527 | 498 | 344 | 285 |
| Import (US$ Billions) | 99 | 138 | 200 | 267 | 171 | 229 | 306 | 316 | 315 | 287 | 183 | 182 |
| Top Trading Partners for Russia for 2015 [184] | |||||||||||||||||||||||||||||||||||||||||||||||||||||||||||||||||||||||||||||||||||||||||||||||||||||||||||
|---|---|---|---|---|---|---|---|---|---|---|---|---|---|---|---|---|---|---|---|---|---|---|---|---|---|---|---|---|---|---|---|---|---|---|---|---|---|---|---|---|---|---|---|---|---|---|---|---|---|---|---|---|---|---|---|---|---|---|---|---|---|---|---|---|---|---|---|---|---|---|---|---|---|---|---|---|---|---|---|---|---|---|---|---|---|---|---|---|---|---|---|---|---|---|---|---|---|---|---|---|---|---|---|---|---|---|---|
|
| ||||||||||||||||||||||||||||||||||||||||||||||||||||||||||||||||||||||||||||||||||||||||||||||||||||||||||
Foreign trade rose 34% to $151.5 billion in the first half of 2005, mainly due to the increase in oil and gas prices which now form 64% of all exports by value. Trade with CIS countries is up 13.2% to $23.3 billion. Trade with the EU forms 52.9%, with the CIS 15.4%, Eurasian Economic Community 7.8% and Asia-Pacific Economic Community 15.9%.
Mergers and acquisitions
Between 1985 and 2018 almost 28,500 mergers or acquisitions have been announced in Russia. This cumulates to an overall value of around 984 bil. USD which translates to 5.456 bil. RUB. In terms of value, 2007 has been the most active year with 158 bil. USD, whereas the number of deals peaked in 2010 with 3,684 (964 compared to the value record year 2007). Since 2010 value and numbers have decreased constantly and another wave of M&A is expected.[185]
The majority of deals in, into or out of Russia have taken place in the financial sector (29%), followed by banks (8.6%), oil and gas (7.8%) and Metals and Mining (7.2%).
Here is a list of the top deals with Russian companies participating ranked by deal value in mil. USD:
| Date Announced | Acquiror Name | Acquiror Mid Industry | Acquiror Nation | Target Name | Target Mid Industry | Target Nation | Value of Transaction ($mil) |
|---|---|---|---|---|---|---|---|
| 10/22/2012 | Rosneft Oil Co | Oil & Gas | Russian Fed | TNK-BP Ltd | Oil & Gas | Russian Fed | 27854.12 |
| 07/24/2012 | Rosneft Oil Co | Oil & Gas | Russian Fed | TNK-BP Ltd | Oil & Gas | Russian Fed | 26061.15 |
| 04/22/2003 | Yukosneftegaz | Oil & Gas | Russian Fed | Sibirskaia Neftianaia Co | Oil & Gas | Russian Fed | 13615.23 |
| 09/28/2005 | Gazprom | Oil & Gas | Russian Fed | Sibneft | Oil & Gas | Russian Fed | 13101.08 |
| 04/13/2005 | Shareholders | Other Financials | Russian Fed | Polyus | Metals & Mining | Russian Fed | 12867.39 |
| 12/16/2010 | MMC Norilsk Nickel PJSC | Metals & Mining | Russian Fed | MMC Norilsk Nickel PJSC | Metals & Mining | Russian Fed | 12800 |
| 07/27/2007 | Shareholders | Other Financials | Russian Fed | HydroOGK | Power | Russian Fed | 12381.83 |
| 12/10/2016 | QHG Shares Pte Ltd | Other Financials | Singapore | Rosneft Oil Co | Oil & Gas | Russian Fed | |
| 06/30/2010 | KazakhGold Group Ltd | Metals & Mining | Kazakhstan | Polyus Zoloto | Metals & Mining | Russian Fed | 10261.33 |
| 08/05/2008 | Vladimir Potanin | Other Financials | Russian Fed | MMC Norilsk Nickel PJSC | Metals & Mining | Russian Fed | 10021.11 |
The majority of the top 10 deals are within the Russian Oil and Gas sector, followed by Metals and Mining.
See also
|
|
|
Notes
- International sanctions were imposed on Russia following the Ukrainian crisis by the United States, European Union (EU28), Canada, Japan, Australia, New Zealand, Greenland, Iceland, Norway, Switzerland, Ukraine, Moldova, Albania, Montenegro and Georgia. EU28 sanctions have been extended until 31 July 2020 and are renewed every 6 months.[7]
References
- "CENTRAL ASIA :: RUSSIA". CIA.gov. Central Intelligence Agency. Retrieved 30 May 2019.
- "World Economic Outlook Database, April 2019". IMF.org. International Monetary Fund. Retrieved 29 September 2019.
- "World Bank Country and Lending Groups". datahelpdesk.worldbank.org. World Bank. Retrieved 29 September 2019.
- Предварительная оценка численности постоянного населения на 1 января 2020 года и в среднем за 2019 год [Preliminary estimated population as of 1 January 2020 and on the average for 2019] (XLS). Russian Federal State Statistics Service (in Russian). Retrieved 2 February 2020.
- "World Economic Outlook Database, October 2020". IMF.org. International Monetary Fund. Retrieved 19 October 2020.
- "World Economic Outlook Update, June 2020". IMF.org. International Monetary Fund. Retrieved 10 August 2020.
- "Russia: EU prolongs economic sanctions by six months". consilium.europa.eu. European Council. Retrieved 22 December 2019.
- "Central Intelligence Agency". Cia.gov. Retrieved 5 April 2015.
- "Poverty headcount ratio at national poverty lines (% of population) - Russian Federation". data.worldbank.org. World Bank. Retrieved 21 March 2020.
- "Europe Central Asia Economic Update, Spring 2020 : Fighting COVID-19". openknowledge.worldbank.org. World Bank. pp. 69, 70. Retrieved 9 April 2020.
- "Gini index (World Bank estimate) - Russian Federation". data.worldbank.org. World Bank. Retrieved 28 October 2020.
- "Human Development Index (HDI)". hdr.undp.org. HDRO (Human Development Report Office) United Nations Development Programme. Retrieved 11 December 2019.
- "Inequality-adjusted HDI (IHDI)". hdr.undp.org. UNDP. Retrieved 22 May 2020.
- "Labor force, total - Russian Federation". data.worldbank.org. World Bank. Retrieved 2 November 2019.
- "Employment to population ratio, 15+, total (%) (national estimate)". data.worldbank.org. World Bank. Retrieved 26 February 2020.
- "Bofit". Retrieved 11 December 2018.
- "Занятость и безработица в Российской Федерации в декабре 2017 года". www.gks.ru. Archived from the original on 2 February 2018. Retrieved 1 February 2018.
- https://russian.doingbusiness.org/ru/reports/global-reports/doing-business-2020
- "Russia – WTO Statistics Database". World Trade Organization. Archived from the original on 19 March 2018. Retrieved 18 March 2018.
- "The Ministry of Finance was advised to increase the national debt" (PDF). 1 November 2017. Retrieved 1 November 2017.
- "Sovereigns rating list". Standardandpoors.com. Standard & Poor's. Retrieved 19 March 2015.
- "Russia on Cusp of Exiting Junk as S&P Outlook Goes Positive". Bloomberg L.P. 17 March 2017.
- "Moody's changes outlook on Russia's Ba1 government bond rating to stable from negative". Moody's. 17 February 2017.
- "Russia's Outlook Raised to Stable by Fitch on Policy Action". Bloomberg. 14 October 2016.
- "Scope upgrades Russia's long-term credit rating to BBB, and revises the Outlook to Stable". 17 January 2020.
- "International Reserves of the Russian Federation (End of period)". Cbr.ru. Retrieved 9 November 2019.
- , World Bank
- Kevin M. Korabik, Russia's Natural Resources and their Economic Effects Archived 20 July 2019 at the Wayback Machine, Penn State College of Earth and Mineral Sciences, 1 December 1997
- "India Partner Country at INNOPROM-2016 Show: Russia: (11-14 July 2016, Yekaterinburg, Russia)" (PDF). EEPC India. July 2016. Archived from the original (PDF) on 11 June 2016. Retrieved 4 January 2017.
- "Pre-empting Russia's Year of Ecology". Ocean Unite.
- "Russian natural resources". European Parliamentary Research Service Blog.
- Russell, Martin (March 2015). The Russian economy: Will Russia ever catch up? (PDF). European Parliamentary Research Service. Publications Office. doi:10.2861/843676. ISBN 978-92-823-6649-3. Retrieved 4 January 2017.
- "World Development Indicators: Contribution of natural resources to gross domestic product". World Bank. Archived from the original on 22 October 2014. Retrieved 21 July 2014.
- "Russia - Analysis". EIA. 12 March 2014. Archived from the original on 24 March 2014. Retrieved 21 July 2014.
- "How Russia's energy superpower status can bring supersecurity and superstability. Interview with Leonid Grigoriev". Civil G8. 2006. Retrieved 5 February 2012.
- How Sustainable is Russia's Future as an Energy Superpower? Archived 12 July 2016 at the Wayback Machine, by the Carnegie Endowment for International Peace, 16 March 2006
- "Putin says Russia must boost arms exports: RIA news agency". Reuters. 7 July 2014. Retrieved 21 July 2014.
- "Arms Exports Thrive Amid Military Revamp". The Russian Business Digest. 7 July 2014. Archived from the original on 2 April 2015. Retrieved 21 July 2014.
- GRP by federal subjects of Russia, 1998–2007 (in Russian)
- Novokmet, Filip; Piketty, Thomas; Zucman, Gabriel (August 2017). "From Soviets to Oligarchs: Inequality and Property in Russia, 1905–2016" (PDF). NBER Working Paper No. 23712. doi:10.3386/w23712.
- "Inequality and the Putin Economy: Inside the Numbers". pbs.org. Frontline. Retrieved 14 January 2015.
- "Global Wealth Report 2014". Credit Suisse. Research Institute. Archived from the original on 14 February 2015. Retrieved 14 January 2015.
- Davies 1998, p. 1, 3.
- Appel, Hilary; Orenstein, Mitchell A. (2018). From Triumph to Crisis: Neoliberal Economic Reform in Postcommunist Countries. Cambridge University Press. p. 3. ISBN 978-1108435055.
- "Nuffield Poultry Study Group — Visit to Russia 6th–14th October 2006" (PDF). The BEMB Research and Education Trust. 2007. Archived from the original (PDF) on 7 August 2007. Retrieved 27 December 2007.
- "How Harvard lost Russia". Institutional Investor. 27 February 2006. Archived from the original on 5 July 2014. Retrieved 24 July 2014.
- "GDP growth (annual %)". World Bank. Retrieved 26 July 2014.
- "Members". APEC Study Center; City University of Hong Kong. Archived from the original on 10 August 2007. Retrieved 27 December 2007.
- Scheidel, Walter (2017). The Great Leveler: Violence and the History of Inequality from the Stone Age to the Twenty-First Century. Princeton University Press. p. 222. ISBN 978-0691165028.
- Privatisation 'raised death rate'. BBC, 15 January 2009. Retrieved 24 November 2018.
- Rosefielde, Steven (2001). "Premature Deaths: Russia's Radical Economic Transition in Soviet Perspective". Europe-Asia Studies. 53 (8): 1159–1176. doi:10.1080/09668130120093174. S2CID 145733112.
- Ghodsee, Kristen (2017). Red Hangover: Legacies of Twentieth-Century Communism. Duke University Press. pp. 63–64. ISBN 978-0822369493.
- Nicholson, Alex. "Metal is the latest natural resource bonanza for Russia". International Herald Tribune. Archived from the original on 16 August 2007.
- Page, Jeremy (16 May 2005). "Analysis: punished for his political ambitions". The Times. UK. Retrieved 27 December 2007.
- "Russia: Clawing Its Way Back to Life (int'l edition)". BusinessWeek. Retrieved 27 December 2007.
- 23 September 1999 (23 September 1999). "Business: The Economy Russia: The IMF's biggest failure". BBC. Retrieved 10 May 2015.
- "Facts About IMF Lending to Russia". International Monetary Fund. 13 September 1999. Retrieved 10 May 2015.
- An Assessment of Putin's Economic Policy Archived 22 March 2016 at the Wayback Machine, by Anders Aslund, Peterson Institute for International Economics, July 2008
- "Investing in Russia" (PDF). KPMG. April 2013. Retrieved 21 July 2014.
- РОЗНИЧНЫЙ ПОДХОД. Российские банки борются за частников (in Russian). Vtbmagazine.ru. Archived from the original on 19 June 2006. Retrieved 12 November 2011.
- "Ежегодно объем потребительского кредитования в России удваивается". Bank.samaratoday.ru. Archived from the original on 21 October 2011. Retrieved 12 November 2011.
- "Основные Социально-Экономические Индикаторы Уровня Жизни Населения". Gks.ru. Archived from the original on 15 July 2006. Retrieved 12 November 2011.
- "CIA – The World Factbook – Russia". Cia.gov. Retrieved 12 November 2011.
- "In Russia, a modern institution is quietly gaining ground". Emerging Markets. 26 November 2012. Archived from the original on 8 August 2014. Retrieved 27 July 2014.
- Russia attracts investors despite its image BBC News Retrieved on March 2008
- Jarko Fidrmuc; Philipp Johann Süß (September 2009). "The Outbreak of the Russian Banking Crisis" (PDF). University of Munich. Retrieved 26 July 2014.
- "Financial crisis: action taken by central banks and governments". The Guardian. 21 October 2008. Retrieved 26 July 2014.
- "Insight: No more easy pickings in Russia's banking market". Reuters. 22 May 2013. Retrieved 26 July 2014.
- "Russia becomes WTO member after 18 years of talks". BBC. 16 December 2011. Retrieved 26 January 2021.
- "Country and Lending Groups". World Bank. Archived from the original on 2 July 2014. Retrieved 1 July 2013.
- Kramer, Andrew E. (22 September 2011). "Economic Reforms Likely to Continue Under Putin". The New York Times. Retrieved 27 July 2014.
- "On Bank of Russia key rate". Bank of Russia. 16 June 2014. Retrieved 26 July 2014.
- "Russia". Forbes. December 2013. Retrieved 19 November 2014.
- "EUROPA - EU Newsroom - EU sanctions against Russia over Ukraine crisis". europa.eu. Retrieved 22 June 2015.
- "Prospects for Russia's Sanctions-Bruised Economy Are Dim". www.bloomberg.com. Retrieved 17 November 2018.
- ВВП России в первом полугодии вырос на 1% — Минэкономразвития. Vedomosti (in Russian). 27 July 2014. Retrieved 7 August 2014.
- Anna Andrianova (2 April 2015). "Russian Economy Unexpectedly Expanded 0.4% in Fourth Quarter". Bloomberg.com. Retrieved 30 April 2015.
- Sabrina Tavernise (18 August 2015). "Inflation Robs Russians of Buying Power". The New York Times. Retrieved 19 August 2015.
...the economy contracted by a steep 4.6 percent in the second quarter, compared with last year, and officially entered its first recession since 2009
- Vladimir Karnazov (9 September 2015). "Collapse Unlikely, but Russian Economy Due for Long Slump". AIN online. Retrieved 10 September 2015.
- Alexander Winning; Elena Fabrichnaya; Oksana Kobzeva (4 June 2015). "Russia to keep building up forex reserves as crisis fears linger". Reuters. Archived from the original on 25 August 2015. Retrieved 10 September 2015.
- "Over 2 Million More Russians Fall Below Poverty Line". Moscow Times. 10 December 2015. Retrieved 21 January 2017.
- "Unequal Russia: is anger stirring in the global capital of inequality?". The Guardian. 25 April 2017.
- ""Новая реальность": о чем Герман Греф рассказал акционерам Сбербанка". РБК. Retrieved 31 May 2016.
- Smilowitz, Elliot (29 December 2016). "US sanctions Russia over hacking, expels 35 officials".
- "GDP, PPP (current international $) | Data". data.worldbank.org. Retrieved 25 April 2018.
- ДИНАМИКА РЕАЛЬНЫХ ДОХОДОВ НАСЕЛЕНИЯ (in Russian). Rosstat. Retrieved 21 July 2014.
- Guriev, Sergei; Tsyvinski, Aleh (2010). "Challenges Facing the Russian Economy after the Crisis". In Anders Åslund; Sergei Guriev; Andrew C. Kuchins (eds.). Russia After the Global Economic Crisis. Peterson Institute for International Economics; Centre for Strategic and International Studies; New Economic School. pp. 12–13. ISBN 9780881324976.
- Putin: Russia's Choice, (Routledge 2007), by Richard Sakwa, Chapter 9
- "Global Wealth Report 2013 - Pg. 53". Credit Suisse. Archived from the original on 14 February 2015. Retrieved 13 April 2015.
- "Russia's Wealth Inequality One Of Highest In The World". Huffington Post. 9 October 2013. Archived from the original on 9 October 2013. Retrieved 21 July 2014.
- "Illicit Financial Flows from Developing Countries: 2002-2011" (PDF). Global Financial Integrity. 2013. Retrieved 5 December 2014.
- Vorasarun, Chaniga (30 April 2008). "Cities Of The Billionaires". Forbes. Retrieved 21 August 2014.
Geromel, Ricardo (14 March 2013). "Forbes Top 10 Billionaire Cities - Moscow Beats New York Again". Forbes. Retrieved 21 August 2014. - Mark Adomanis (1 May 2014). "According To The IMF, Russia's Economy Is Already In A Recession". Forbes. Archived from the original on 1 May 2014. Retrieved 8 December 2014.
Tim Bowler (19 January 2015). "Falling oil prices: Who are the winners and losers?". BBC News. Retrieved 30 April 2015. - О состоянии внешней торговли в январе-феврале 2015 года [On the state of foreign trade in January–February 2015]. gks.ru (in Russian). Archived from the original on 27 April 2015. Retrieved 30 April 2015.
- Matlack, Carol. "Russia's Great Downward Shift". Bloomberg L.P. Retrieved 28 January 2016.
- "World Bank Keeps 2015 Growth Projections for Russia, and Slightly Revises 2016-2017 Outlook". World Bank.
- "World Economic Outlook" (PDF). International Monetary Fund. 19 January 2016.
- "О производстве и использовании валового внутреннего продукта (ВВП) за 2017 год". www.gks.ru. Archived from the original on 12 June 2018. Retrieved 1 February 2018.
- "Russian Economy Crawled to Growth With Recession in Rearview". Bloomberg. 31 March 2017.
- These Are the World's Most Innovative Economies Bloomberg Business.
- Most Innovative: Countries Bloomberg Business.
- 30 Most Innovative Countries Bloomberg Business.
- "To Improve Economy, Russia Must 'Reduce Geopolitical Tensions". Forbes. Retrieved 2 June 2016.
- "The average salary in Russia is now lower than in China and Poland". rbth.
- "Lessons from the Russia's 2001 Flat Tax Reform". Voxeu.org. Retrieved 4 May 2013.
- "Number of Russians Living in Poverty Rises". The Wall Street Journal. 21 March 2016.
- "Бизнес заявил о катастрофе в российской экономике | 22.05.18 | finanz.ru". finanz.ru (in Russian). Retrieved 23 May 2018.
- Times, The Moscow (14 March 2019). "Russia's Natural Resources Make Up 60% of GDP". The Moscow Times. Retrieved 17 March 2019.
- "Report for Selected Countries and Subjects". www.imf.org. Retrieved 11 September 2018.
- "Report for Selected Countries and Subjects". www.imf.org. Retrieved 25 December 2019.
- "The Central Bank of the Russian Federation". Bank of Russia. Archived from the original on 8 August 2014. Retrieved 27 July 2014.
- "Legal Status and Functions of the Bank of Russia". Bank of Russia. Archived from the original on 8 August 2014. Retrieved 27 July 2014.
- "Central Bank Chief Is Charting a New Course for Russia". Institutional Investor. 6 January 2014. Retrieved 27 July 2014.
- Rose, Scott (4 May 2012). "Russian April Inflation Falls to Post-Soviet Record Low". Bloomberg BusinessWeek. Archived from the original on 16 October 2015. Retrieved 12 February 2014.
- "XE Currency Charts". XE. 17 January 2014.
- Russia Ready to Float Ruble Next Year Regardless of Rate Archived 20 March 2017 at the Wayback Machine, The Wall Street Journal, 17 January 2014, accessed 6 December 2014.
- Tanas, Olga (14 January 2015). "Russia to Dip Into Wealth Fund as Ruble Crisis Pressures Economy". Bloomberg L.P. Archived from the original on 13 February 2015.
- Andrianova, Anna (22 April 2015). "Bank of Russia's Yudaeva Says Ruble's Oil-Led Rally Is Over". Bloomberg L.P. Archived from the original on 14 July 2015.
- Triami Media. "Inflation Russia – current Russian inflation". Inflation.eu. Retrieved 8 December 2014.
- "Russia's Budget Deficit to Reach $21Bln in 2016 – Finance Ministry". The Moscow Times. Archived from the original on 14 December 2015. Retrieved 30 May 2016.
- "Overview". World Bank. Retrieved 22 April 2018.
- Shyhkin, Maxim. "Stabilization Fund to Be Converted into National Prosperity". Archived from the original on 30 September 2007. Retrieved 2 August 2007.
- "Putin marks steady trend towards improvement of GDP indicators in Russia". Archived from the original on 12 August 2016. Retrieved 26 May 2016.
- "Russia pays off USSR's entire debt, sets to become crediting country". Pravda.ru. Archived from the original on 6 December 2010. Retrieved 27 December 2007.
- Miles, Tom (30 December 2013). "Russia was most protectionist nation in 2013: study". Reuters. Thomson Reuters. Archived from the original on 31 December 2014. Retrieved 31 December 2014.
- "Russia Leads the World in Protectionist Trade Measures, Study Says". The Moscow Times. The Moscow Times. Archived from the original on 31 December 2014. Retrieved 31 December 2014.
- "Countries implementing the most protectionist measures". Global Trade Alert.
- "ararat.osipian". sites.google.com.
- "Corruption Perceptions Index 2014". Transparency International. Retrieved 4 December 2015.
- Suhara, Manabu. "Corruption in Russia: A Historical Perspective" (PDF). Archived from the original (PDF) on 4 March 2016. Retrieved 4 December 2015.
- "Cops for hire". Economist. 2010. Retrieved 4 December 2015.
- Klara Sabirianova Peter; Tetyana Zelenska (2010). "Corruption in Russian Health Care: The Determinants and Incidence of Bribery" (PDF). Retrieved 4 December 2015.
- Elena Denisova-Schmidt; Elvira Leontyeva; Yaroslav Prytula (2014). "Corruption at Universities is a Common Disease for Russia and Ukraine". Harvard University. Retrieved 4 December 2015.
- "Corruption Perceptions Index 2018 Executive Summary p. 3" (PDF). Transparency International. Retrieved 9 September 2019.
- "Доля теневой экономики в РФ снизилась почти до 15%, таблицы "затраты-выпуск"... - Пресс-центр - Интерфакс". Interfax.ru. Archived from the original on 16 June 2012. Retrieved 14 July 2014.
- Source: Milov, Nemtsov, Ryzhkov, Shorina (2011). "Putin. Corruption. Independent expert report", p. 6.
- "Коррупция в России как система "распилки" ВВП - новость из рубрики Общество, актуальная информация, обсуждение новости, дискуссии на Newsland". Newsland.ru. Retrieved 14 July 2014.
- "Средний размер взятки в России в 2010 году вырос с 27 до 47 тысяч руб | РИА Новости". Ria.ru. Retrieved 14 July 2014.
- Milov et al., Op. cit., 2011, p. 6.
- "Почти половина россиян не видят смысла в уплате налогов | 26.05.20". finanz.ru (in German). Retrieved 26 May 2020.
- "GECF Russia". Retrieved 5 July 2019.
- "Countries Compared by Energy > Oil > Production > Per capita. International Statistics at NationMaster.com". Nationmaster.com. Archived from the original on 22 April 2012. Retrieved 8 December 2014.
- "Ranking Of The World's Diamond Mines By Estimated 2013 Production", Kitco, 20 August 2013.
- "Russia plants flag on Arctic floor". MOSCOW, Russia (Reuters). CNN. 2 August 2007. Retrieved 2 August 2007.
- "Global Forest Resources Assessment : Main Report" (PDF). Rome, Italy: FAO Forestry Working Paper 163. 2010. Retrieved 8 December 2014.
- "FAO - News Article: Innovations and investments urged to modernize Russian forest sector". Fao.org. Retrieved 8 December 2014.
- "Russian Federation Forest Sector Outlook Study to 2030" (PDF). Food and Agriculture Organization of the United Nations. 2012. Retrieved 21 March 2015.
- "Russia has emerged as an agricultural powerhouse". The Economist. 1 December 2018. Retrieved 15 August 2019.
- "Russian agriculture sector flourishes amid sanctions". Financial Times. Retrieved 4 May 2017.
- Serova, Eugenia, ed. (2020), "Special issue (theme issue): Challenges for Russia's agriculture", Russian Journal of Economics, 6 (1), retrieved 31 March 2020.
- "AO Концерн "Калашников" / English version / About company". kalashnikov.com. Retrieved 19 October 2017.
- Makienko, Konstantin (24 July 2008). "Successful Year for Aerospace Manufacturers". Russia & CIS Observer. Retrieved 6 January 2010.
- Manturov, Denis (2009). "Prospects for the Domestic Aircraft Industry". Military Parade (4): 8–9.
- Ionin, Andrey. "Russia's Space Program in 2006: Some Progress but No Clear Direction". Moscow Defense Brief. Centre for Analysis of Strategies and Technologies (2(#8)). Archived from the original on 27 August 2007.
- "Electronics regrowth in Russia". Eetimes.ru. Archived from the original on 7 February 2011. Retrieved 8 December 2014.
- "Electronics in Russia". English.pravda.ru. Archived from the original on 22 December 2004. Retrieved 8 December 2014.
- Andrew E. Kramer (1 January 2013). "Malls Blossom in Russia, With a Middle Class". The New York Times. Retrieved 2 January 2013.
I feel like I’m in Disneyland
- "Basic retail data Russia - Russia Retail and FMCG market news". Russiaretail.com. Archived from the original on 4 November 2011.
- "Basic retail data Russia - Russia Retail and FMCG market news". Russiaretail.com. Archived from the original on 5 October 2015. Retrieved 5 October 2015.
- Lenta.ru. "Internet usage statistic". It.tut.by. Archived from the original on 25 June 2009. Retrieved 12 November 2011.
- "ICT in Russia". Ictrussia.com. Retrieved 12 November 2011.
- "retrieved 2 August 2007". Electronics.ihs.com. 6 December 2006. Archived from the original on 24 February 2007. Retrieved 12 November 2011.
- "ICT Russia data, 2004-2011". Ictrussia.com. 2012. Retrieved 5 October 2015.
- РЖД попросила правительство заняться спасением железных дорог [Russian Railways has asked the government to save the railways] (in Russian). Lenta.ru. 17 November 2009. Archived from the original on 19 November 2009. Retrieved 10 September 2015.
- "Table 2.28. Transportation of passengers and passenger turnover of public railway transport". FSSS. 2008. Retrieved 10 September 2015.
- "Table 2.25. Transportation of cargo and freight turnover of public railway transport". FSSS. 2008. Retrieved 10 September 2015.
- "Table 2.24. Public railway rolling stock and its use". FSSS. 2008. Retrieved 10 September 2015.
- 2.13. Протяженность эксплуатационных путей железнодорожного транспорта общего пользования [Table 2.13. Length of operational public transport train tracks] (in Russian). FSSS. 2009. Retrieved 10 September 2015.
- "Freight by electric railroad 2008" (in Russian). Gks.ru. Retrieved 8 December 2014.
- "Russian Construction Data - construction output, homes completed, building materials production". Constructionrussia.com. Retrieved 8 December 2014.
- "Russian Insurance Market in 2013" (PDF). Rgs.ru. Retrieved 8 December 2014.
- Huffington Post: Countries With The MOST College Graduates retrieved 27 September 2013
- "The 8th Annual Survey of the Russian Software Export Industry" (PDF). Russoft. 22 November 2011. Archived from the original (PDF) on 14 May 2012. Retrieved 5 May 2012.
- "Russian IT market worth $2,4 billion". Silicon Taiga. 26 December 2006. Archived from the original on 30 September 2007. Retrieved 12 November 2011.
- "Medvedev's Cabinet compels state-owned corporations to buy Russian technology". Russoft. Archived from the original on 19 December 2013. Retrieved 23 June 2013.
- "The internet business in Russia: Europe's great exception - The Economist". The Economist. 19 May 2012. Retrieved 14 March 2015.
- "Most Popular Search Engines in the World – Top Ten List - Tech Robo". Tech Robo. Archived from the original on 6 May 2015. Retrieved 14 March 2015.
- "Самые популярные поисковые системы в России". Topmira.com. Retrieved 8 December 2014.
- "Tourism Highlights 2014" (PDF). UNWTO (World Tourism Organization). 2014. Archived from the original (PDF) on 12 January 2015. Retrieved 20 January 2015.
- "President Obama's Signature Paves Way for Permanent Normal Trade Relations with Russia and Moldova". ustr.gov. Archived from the original on 2 February 2017. Retrieved 27 January 2017.
- "Russian Federation | SITC Rev2 Groups | Exports to World | 2015 | WITS | Data". wits.worldbank.org. Retrieved 3 October 2017.
- "OEC - Russia (RUS) Exports, Imports, and Trade Partners". atlas.media.mit.edu. Archived from the original on 10 June 2018. Retrieved 19 March 2018.
- "Russian Federation - Trade At a glance - Most Recent Value - WITS - Data". wits.worldbank.org.
- "M&A Statistics by Countries - Institute for Mergers, Acquisitions and Alliances (IMAA)". Institute for Mergers, Acquisitions and Alliances (IMAA). Retrieved 27 February 2018.
 This article incorporates public domain material from the Library of Congress Country Studies website http://lcweb2.loc.gov/frd/cs/. – Soviet Union
Further reading
- Filip Novokmet, Thomas Piketty, and Gabriel Zucman (July 2017). From Soviets to Oligarchs: Inequality and Property in Russia 1905-2016
External links
| Wikimedia Commons has media related to Economy of Russia. |
