Forest cover by state and territory in the United States
Forest cover by U.S. state and territory is estimated from tree-attributes using the basic statistics reported by the Forest Inventory and Analysis (FIA) Program of the U.S. Department of Agriculture Forest Service (FIA).[1] Tree volumes and weights are not directly measured in the field, but computed from other variables that can be measured.[2][3]
This is only the total amount of timberland. Actual forest cover for each state may be significantly higher.[4][5]
List by state, district, or territory
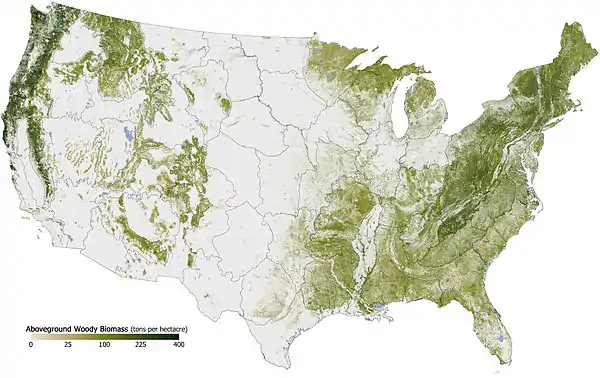
Map of above ground woody biomass across the contiguous United States c. 2000[6]
| Rank | State, district or territory |
Percent forest (2016)[1] [note 1] |
|---|---|---|
| 1 | 89.46% | |
| 2 | 84.32% | |
| 3 | 80.84% | |
| 4 | 80.37% | |
| 5 | 79.01% | |
| 6 | 77.811% | |
| 7 | 70.57% | |
| 8 | 68.19% | |
| 9 | 67.28% | |
| 10 | 65.07% | |
| 11 | 62.93% | |
| 12 | 62.88% | |
| 13 | 60.57% | |
| 14 | 59.73% | |
| 15 | 58.60% | |
| 16 | 57.16% | |
| 17 | 56.31% | |
| 18 | 55.62% | |
| 19 | 55.62% | |
| 20 | 55.24% | |
| 21 | 54.38% | |
| 22 | 53.20% | |
| 23 | 52.83% | |
| 24 | 52.82% | |
| 25 | 52.74% | |
| 26 | 50.68% | |
| 27 | 49.35% | |
| 28 | 48.98% | |
| 29 | 48.51% | |
| 30 | 42.53% | |
| 31 | 41.72% | |
| 32 | 40.55% | |
| 33 | 39.36% | |
| 34 | 37.33% | |
| 35 | 35.16% | |
| 36 | 35.16% | |
| 37 | 34.48% | |
| 38 | 34.42% | |
| 39 | 34.08% | |
| 40 | 33.90%[7] | |
| 41 | 32.71% | |
| 42 | 31.99% | |
| 43 | 30.92% | |
| 44 | 28.80% | |
| 45 | 27.45% | |
| 46 | 27.26% | |
| 47 | 25.64% | |
| 48 | 21.06% | |
| 49 | 18.42% | |
| 50 | 15.89% | |
| 51 | 13.64% | |
| 52 | 8.43% | |
| 53 | 4.78% | |
| 54 | 3.93% | |
| 55 | 3.20% | |
| 56 | 1.72% | |
| — | [note 2] | No data |
List by region
| Rank | Region | Percent forest (2016)[1] |
|---|---|---|
| 1 | U.S. territories [note 3] | 56.74% |
| 2 | Southern region [note 4] | 50.13% |
| 3 | Pacific Northwest region [note 5] | 37.52% |
| 4 | Northern region [note 6] | 30.04% |
| 5 | Interior West region [note 7] | 28.14% |
| — | Total | 36.21% |
See also
References
- https://www.fs.fed.us/sites/default/files/fs_media/fs_document/publication-15817-usda-forest-service-fia-annual-report-508.pdf
USDA - Forest Inventory And Analysis Fiscal Year 2016 Business Report. Page 71-72 (Page 79-80 of PDF). Table B-11. Land and forest area and FIA annualized implementation status by State and region, FY 2016. (Percentages for states derived by dividing third column by second column.) Data for territories: Page 70 (Page 78 of PDF): Table B-10. Status of FIA special project areas excluded from annualized inventory." Retrieved January 8, 2019. - "FIA Volume Calculations" (PDF). fs.fed.us. Retrieved 21 April 2018.
- Bechtold, William A.; Patterson, Paul L.; [Editors] 2005. The enhanced forest inventory and analysis program - national sampling design and estimation procedures. Gen. Tech. Rep. SRS-80. Asheville, NC: U.S. Department of Agriculture, Forest Service, Southern Research Station. 85 p.
- Archived January 7, 2009, at the Wayback Machine
- fia@fs.fed.us. "Forest Inventory and Analysis National Program - FIA Library". www.fia.fs.fed.us. Retrieved 21 April 2018.
- fia@fs.fed.us. "Forest Inventory and Analysis National Program - FIA Library". www.fia.fs.fed.us. Retrieved 21 April 2018.
- https://www.fs.fed.us/nrs/pubs/jrnl/2018/nrs_2018_nowak_005.pdf Declining urban and community tree cover in the United States. David J. Nowak, Eric J. Greenfield. Urban Forestry & Urban Greening. Retrieved January 8, 2019.
- https://phys.org/news/2018-07-percent-native-trees-rat-free-palmyra.html
Study Shows 5,000 percent increase in native trees on rat-free Palmyra Atoll. July 17, 2018. Retrieved January 8, 2019.
Notes
- The forest percent is the percent of land that is forested (excluding bodies of water). Data for Puerto Rico, the Virgin Islands and Guam is from 2013. Data for the Northern Mariana Islands is from 2015. Data for American Samoa is from 2012. Data for the District of Columbia is from 2018.
- There is a forest on Palmyra Atoll,[8] but there is no information about what percentage of land the forest covers.
- The U.S. territories are American Samoa, Guam, Northern Mariana Islands, Puerto Rico and U.S. Virgin Islands. The U.S. Minor Outlying Islands are not counted.
- The FIA defines the Southern region of the U.S. as Alabama, Arkansas, Florida, Georgia, Kentucky, Louisiana, Mississippi, North Carolina, Oklahoma, South Carolina, Tennessee, Texas, and Virginia.
- The FIA defines the Pacific Northwest region as Alaska, California, Hawaii, Oregon, and Washington.
- The FIA defines the Northern region of the U.S. as Connecticut, Delaware, Illinois, Indiana, Iowa, Kansas, Maine, Maryland, Massachusetts, Michigan, Minnesota, Missouri, Nebraska, New Hampshire, New Jersey, New York, North Dakota, Ohio, Pennsylvania, Rhode Island, South Dakota, Vermont, West Virginia and Wisconsin. The District of Columbia is not counted.
- The FIA defines the Interior West region of the U.S. as Arizona, Colorado, Idaho, Montana, Nevada, New Mexico, Utah, and Wyoming.
Further reading
This article is issued from Wikipedia. The text is licensed under Creative Commons - Attribution - Sharealike. Additional terms may apply for the media files.