List of U.S. states and territories by life expectancy
This article presents a list of United States states and territories sorted by their life expectancy at birth, sex, race, and in the past. The data in the 2018 column is taken from the Robert Wood Johnson Foundation for the states and the District of Columbia;[1] from the World Bank for Guam, Puerto Rico and the U.S. Virgin Islands; and from the CIA World Factbook for American Samoa and the Northern Mariana Islands.[2] Data in the 2010 columns comes from the US Health Map. Overall, life expectancy at birth in Hawaii, California, and New York (state) are among the longest in the nation, while life expectancy at birth in Mississippi, American Samoa, and West Virginia are among the shortest in the nation.
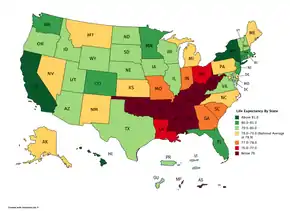
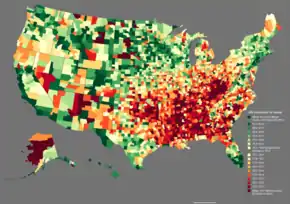
The life expectancy in some states has fallen in recent years; for example, Maine's life expectancy in 2010 was 79.1 years, and in 2018 it was 78.7 years. The Washington Post noted in November 2018 that overall life expectancy in the United States was declining although in 2018 life expectancy had a slight increase of 0.1 and bringing it to having not changed since 2010.[3] An Interactive county life expectancy map can be found at
Life Expectancy in 2018
| Rank | State/Territory | Life Expectancy 2018[1] | Life Expectancy 2010[4] | Change 2010-2018 | Male[5] | Female[5] | White | Hispanic | Black | Asian [1] | American Indian | Comparable Country[6] |
|---|---|---|---|---|---|---|---|---|---|---|---|---|
| 1. | 82.3 | 81.4 | 79.3 | 85.3 | 81.3 | 87.9 | 80.9 | 83.7 | 81.9 | |||
| 2. | 81.6 | 80.6 | 79.1 | 84.1 | 80.7 | 83.6 | 76.0 | 87.6 | 75.7 | |||
| 3. | 81.3 | 80.3 | 78.8 | 83.6 | 81.0 | 82.4 | 78.0 | 87.4 | 83.7 | |||
| 4. | 80.9 | 80.8 | 78.7 | 83.0 | 81.0 | 83.4 | 79.3 | 86.8 | 69.9 | |||
| 5. | 80.9 | 80.7 | 78.3 | 83.3 | 80.6 | 82.9 | 78.0 | 87.2 | 83.6 | |||
| 6. | 80.5 | 80.5 | 77.9 | 83.0 | 80.2 | 82.1 | 78.8 | 86.9 | 84.1 | |||
| 7 | 80.5 | 80.1 | 78.3 | 83.0 | 80.6 | 81.0 | 77.2 | 87.9 | 74.2 | |||
| 8. | 80.4 | 80.0 | 77.9 | 82.9 | 80.2 | 82.7 | 74.8 | 87.2 | 84.1 | |||
| 9. | 80.4 | 80.1 | 78.3 | 82.6 | 80.1 | 81.7 | 78.0 | 84.3 | 74.0 | |||
| 10. | 80.0 | 79.0 | 77.3 | 82.7 | 79.9 | 82.1 | 76.1 | 86.1 | 81.6 | |||
| 11. | 79.9 | 79.5 | 77.2 | 82.4 | 79.7 | 83.1 | 77.2 | 86.4 | 84.0 | |||
| 12. | 79.9 | 79.3 | 77.2 | 82.7 | 80.0 | 81.0 | 76.8 | 87.0 | 71.8 | |||
| 13. | 79.9 | 79.7 | 77.5 | 82.39 | 80.1 | 85.1 | 82.1 | 88.3 | 69.7 | |||
| 14. | 79.9 | 79.8 | 78.1 | 81.8 | 79.6 | 81.9 | 80.2 | 84.3 | 74.3 | |||
| - | 79.9 | 77.9 | 76.6[2] | 83.4[2] | - | - | - | - | - | |||
| 15. | 79.8 | 79.5 | 77.6 | 82.1 | 79.5 | 84.0 | 77.5 | 86.4 | 76.9 | |||
| - | 79.8 | 78.4 | 76.4[2] | 83.4[2] | - | - | - | - | - | |||
| 16. | 79.7 | 80.1 | 77.3 | 82.0 | 79.6 | 83.1 | 81.1 | 87.2 | 85.0 | |||
| 17. | 79.6 | 79.7 | 77.3 | 81.9 | 79.6 | 82.1 | 73.9 | 86.3 | 71.1 | |||
| - | 79.6 | 78.0 | 76.3[2] | 83.0[2] | - | - | - | - | - | |||
| 18. | 79.5 | 80.3 | 77.0 | 82.0 | 79.3 | 83.5 | 80.8 | 87.6 | 84.4 | |||
| 19. | 79.5 | 79.1 | 77.0 | 81.8 | 79.7 | 84.7 | 74.5 | 86.0 | 82.3 | |||
| 20. | 79.4 | 79.6 | 77.1 | 81.8 | 79.4 | 83.3 | 73.4 | 85.8 | 71.7 | |||
| 21. | 79.4 | 79.6 | 77.0 | 81.9 | 79.3 | 81.8 | 74.8 | 86.6 | 80.1 | |||
| 22. | 79.3 | 79.4 | 77.2 | 81.6 | 79.1 | 83.1 | 81.3 | 84.9 | 74.6 | |||
| 23. | 79.3 | 79.0 | 76.6 | 81.8 | 79.1 | 82.9 | 73.9 | 85.3 | 83.0 | |||
| 24. | 79.1 | 79.0 | 76.3 | 81.8 | 80.0 | 81.9 | 75.3 | 87.3 | 83.7 | |||
| 25. | 79.1 | 78.4 | 76.6 | 81.7 | 78.5 | 81.3 | 74.2 | 85.1 | 81.8 | |||
| 26. | 79.1 | 79.3 | 76.5 | 81.6 | 80.0 | 82.7 | 81.2 | 85.2 | 67.8 | |||
| 27. | 79.0 | 78.1 | 76.9 | 81.1 | 79.0 | 81.8 | 80.2 | 85.2 | 72.9 | |||
| - | 78.8[7] | 78.7[7] | 76.3[7] | 81.4[7] | 78.6[7] | 81.8[7] | 74.9[7] | 86.3[7] | 77.4[7] | |||
| 28. | 78.8 | 78.5 | 76.6 | 81.2 | 79.3 | 82.1 | 81.9 | 86.1 | 69.5 | |||
| 29. | 78.8 | 78.0 | 76.6 | 81.2 | 80.0 | 80.9 | 79.0 | 87.1 | 70.5 | |||
| 30. | 78.7 | 79.1 | 76.0 | 81.3 | 78.6 | 82.1 | 80.9 | 85.9 | 83.8 | |||
| 31. | 78.6 | 76.9 | 75.5 | 81.5 | 87.5 | 87.8 | 72.6 | 89.5 | 90.5 | |||
| 32. | 78.5 | 78.6 | 76.2 | 80.9 | 78.2 | 81.5 | 73.8 | 84.2 | 79.1 | |||
| 33. | 78.5 | 77.8 | 75.9 | 81.3 | 76.8 | 80.7 | 76.3 | 84.1 | 74.9 | |||
| 34. | 78.4 | 78.3 | 75.7 | 81.1 | 78.5 | 81.3 | 75.2 | 85.7 | 83.1 | |||
| 35. | 78.3 | 78.5 | 75.9 | 81.1 | 78.3 | 82.2 | 73.2 | 86.9 | 82.2 | |||
| 36. | 78.1 | 78.2 | 74.9 | 81.3 | 78.7 | 78.6 | 74.8 | 81.8 | 73.9 | |||
| 37. | 78.0 | 77.8 | 75.3 | 80.7 | 78.5 | 81.8 | 75.0 | 84.3 | 76.8 | |||
| 38. | 78.0 | 78.0 | 75.7 | 80.5 | 78.0 | 80.9 | 73.5 | 86.0 | 79.8 | |||
| 39. | 77.8 | 77.3 | 75.3 | 80.2 | 78.0 | 81.3 | 75.5 | 85.2 | 80.8 | |||
| 40. | 77.3 | 77.4 | 74.6 | 80.1 | 77.5 | 81.8 | 73.6 | 84.6 | 81.0 | |||
| 41. | 77.0 | 77.5 | 74.5 | 79.6 | 76.8 | 81.8 | 73.2 | 85.1 | 81.2 | |||
| 42. | 77.0 | 76.8 | 74.2 | 79.8 | 78.0 | 81.4 | 73.6 | 83.1 | 80.9 | |||
| 43. | 76.9 | 77.7 | 74.3 | 79.5 | 77.1 | 81.1 | 73.0 | 85.9 | 80.6 | |||
| - | 76.1[8] | 76.4[9] | 73.6[8] | 79.3[8] | - | - | - | - | - | |||
| 44. | 76.1 | 75.8 | 73.2 | 79.0 | 77.1 | 80.9 | 73.1 | 81.1 | 80.5 | |||
| 45. | 76.0 | 76.2 | 73.4 | 78.7 | 76.1 | 80.7 | 72.7 | 82.6 | 80.4 | |||
| 46. | 76.0 | 75.7 | 73.4 | 78.6 | 76.1 | 80.9 | 72.9 | 81.0 | 73.6 | |||
| 47. | 75.9 | 76.0 | 73.4 | 78.6 | 76.0 | 79.2 | 72.8 | 80.6 | 79.0 | |||
| 48. | 75.4 | 75.4 | 72.4 | 78.4 | 76.0 | 79.1 | 72.9 | 80.2 | 78.7 | |||
| 49. | 75.4 | 75.9 | 72.7 | 78.1 | 75.5 | 79.6 | 72.9 | 80.2 | 78.9 | |||
| 50. | 74.9 | 74.8 | 72.0 | 77.8 | 76.0 | 79.3 | 72.6 | 80.8 | 79.2 | |||
| - | 74.8[8] | 71.6[9] | 73.0[8] | 77.0[8] | - | - | - | - | - | |||
| 51. | 74.8 | 75.5 | 72.1 | 77.7 | 74.8 | 79.7 | 72.2 | 80.0 | 79.0 |
Past Life Expectancy 1960-2018
| State/Territory | 2018[1] | 2010[4] | 2000[4] | 1990[4] | 1980[4] | 1970[4] | 1960[4] | Change
1960-2018 |
|---|---|---|---|---|---|---|---|---|
| 78.7 | 78.7 | 76.8 | 75.4 | 73.7 | 70.8 | 69.7 | ||
| 75.4 | 75.4 | 74.4 | 73.7 | 72.3 | 69.2 | 67.9 | ||
| 78.8 | 78.0 | 76.2 | 75.0 | 72.4 | 69.2 | 67.2 | ||
| 74.8 | 71.6 | 71.4 | 70.9 | 70.2 | 69.3 | 67.0 | ||
| 79.9 | 79.3 | 77.1 | 76.2 | 74.2 | 70.9 | 69.3 | ||
| 75.9 | 76.0 | 74.8 | 74.4 | 73.3 | 70.8 | 69.9 | ||
| 81.6 | 80.6 | 78.1 | 75.8 | 74.3 | 71.8 | 70.8 | ||
| 80.5 | 80.1 | 78.4 | 77.2 | 75.4 | 72.1 | 70.9 | ||
| 80.9 | 80.7 | 78.3 | 77.1 | 74.9 | 72.6 | 71.1 | ||
| 78.4 | 78.3 | 76.4 | 75.0 | 73.2 | 69.9 | 69.1 | ||
| 78.6 | 76.9 | 72.1 | 67.4 | 68.9 | 65.2 | 66.3 | ||
| 80.0 | 79.0 | 77.0 | 75.7 | 73.8 | 70.8 | 69.9 | ||
| 77.8 | 77.3 | 75.1 | 73.8 | 72.1 | 68.4 | 67.5 | ||
| 79.9 | 77.0 | 75.0 | 71.9 | 69.3 | 65.7 | 61.0 | ||
| 82.3 | 81.4 | 79.5 | 78.2 | 77.1 | 74.0 | 71.3 | ||
| 79.3 | 79.4 | 78.1 | 77.2 | 75.2 | 72.0 | 71.4 | ||
| 79.3 | 79.0 | 76.6 | 74.9 | 73.3 | 70.1 | 69.6 | ||
| 77.0 | 77.5 | 76.0 | 75.4 | 73.9 | 70.9 | 70.3 | ||
| 79.4 | 79.6 | 78.3 | 77.5 | 75.8 | 72.6 | 71.9 | ||
| 78.5 | 78.6 | 77.4 | 77.0 | 75.2 | 72.8 | 71.9 | ||
| 75.4 | 75.9 | 75.1 | 74.4 | 72.8 | 70.0 | 69.6 | ||
| 76.1 | 75.8 | 74.1 | 73.1 | 71.6 | 68.7 | 67.9 | ||
| 78.7 | 79.1 | 77.6 | 76.6 | 74.4 | 70.7 | 70.2 | ||
| 79.1 | 79.0 | 76.2 | 74.9 | 73.3 | 70.2 | 68.6 | ||
| 80.5 | 80.5 | 78.2 | 76.8 | 74.8 | 71.9 | 70.5 | ||
| 78.0 | 78.0 | 76.4 | 75.1 | 73.7 | 70.7 | 70.2 | ||
| 80.9 | 80.8 | 79.0 | 77.8 | 76.1 | 73.0 | 71.8 | ||
| 74.9 | 74.8 | 73.4 | 73.1 | 71.8 | 68.4 | 67.6 | ||
| 77.3 | 77.4 | 76.0 | 75.3 | 73.6 | 70.6 | 70.2 | ||
| 78.8 | 78.5 | 77.3 | 76.4 | 73.8 | 70.8 | 69.6 | ||
| 79.6 | 79.7 | 78.3 | 76.9 | 75.4 | 72.5 | 72.0 | ||
| 78.5 | 77.8 | 75.9 | 74.5 | 72.6 | 69.3 | 67.6 | ||
| 79.5 | 80.3 | 78.5 | 77.0 | 75.1 | 71.6 | 70.7 | ||
| 80.4 | 80.0 | 77.3 | 75.4 | 73.8 | 71.0 | 69.9 | ||
| 78.1 | 78.2 | 77.1 | 76.0 | 73.8 | 70.5 | 69.3 | ||
| 81.3 | 80.3 | 77.6 | 74.6 | 73.4 | 70.5 | 69.7 | ||
| 78.0 | 77.8 | 75.6 | 74.7 | 73.0 | 69.3 | 68.2 | ||
| 79.9 | 79.7 | 78.8 | 77.5 | 75.6 | 73.0 | 71.5 | ||
| 76.1 | 76.4 | 75.8 | 74.3 | 73.6 | 71.4 | 69.3 | ||
| 76.9 | 77.7 | 76.3 | 75.3 | 73.3 | 70.8 | 70.2 | ||
| 76.0 | 75.7 | 75.0 | 75.0 | 73.6 | 71.1 | 70.8 | ||
| 79.8 | 79.5 | 77.8 | 76.5 | 74.9 | 72.4 | 71.0 | ||
| 78.3 | 78.5 | 76.7 | 75.4 | 73.3 | 70.4 | 69.5 | ||
| 79.8 | 78.4 | 76.7 | 74.2 | 73.7 | 71.5 | 68.7 | ||
| 79.9 | 79.5 | 78.0 | 76.4 | 74.6 | 71.7 | 70.6 | ||
| 77.0 | 76.8 | 74.7 | 73.6 | 71.8 | 68.1 | 66.1 | ||
| 79.1 | 79.3 | 78.0 | 77.1 | 74.8 | 72.3 | 70.5 | ||
| 76.0 | 76.2 | 74.7 | 74.2 | 73.1 | 70.0 | 69.4 | ||
| 79.1 | 78.4 | 76.5 | 75.2 | 73.6 | 70.8 | 70.2 | ||
| 79.9 | 79.8 | 78.6 | 78.0 | 75.8 | 72.8 | 71.8 | ||
| 79.6 | 78.0 | 76.6 | 74.2 | 71.7 | 69.1 | 66.2 | ||
| 79.7 | 80.1 | 78.2 | 76.7 | 74.3 | 71.9 | 70.4 | ||
| 79.5 | 79.1 | 76.8 | 75.3 | 73.3 | 70.2 | 68.7 | ||
| 80.4 | 80.1 | 78.2 | 76.8 | 75.0 | 71.9 | 71.1 | ||
| 74.8 | 75.5 | 74.9 | 74.4 | 72.6 | 69.2 | 69.6 | ||
| 79.4 | 79.6 | 78.0 | 76.9 | 75.3 | 72.5 | 71.1 | ||
| 79.0 | 78.1 | 77.1 | 76.4 | 73.8 | 70.8 | 69.2 |
Life Expectancy in the top 50 largest U.S. cities in 2018
| City | State | Total [1] | Male[11] | Female[11] | White[1] | Hispanic[1] | Black[1] | Asian[1] | American
Indian[1] |
Comparable country [6] |
|---|---|---|---|---|---|---|---|---|---|---|
| 82.9 | 80.3 | 85.3 | 82.7 | 85.2 | 80.0 | 89.4 | 100+ | |||
| 82.3 | 80.0 | 84.4 | 81.0 | 84.4 | 75.9 | 87.6 | 83.3 | |||
| 79.4 | 76.8 | 81.8 | 80.8 | 85.5 | 73.1 | 88.2 | 100+ | |||
| 79.6 | 77.3 | 81.9 | 78.9 | 84.1 | 74.6 | 87.3 | 100+ | |||
| 80.4 | 78.2 | 82.7 | 80.6 | 81.8 | 76.5 | 87.0 | 75.1 | |||
| 76.1 | 72.7 | 79.2 | 77.0 | 79.7 | 73.5 | 88.4 | 99.2 | |||
| 78.9 | 76.4 | 81.6 | 78.6 | 79.7 | 75.5 | 88.0 | 100+ | |||
| 82.2 | 80.1 | 84.3 | 81.4 | 84.2 | 78.3 | 88.0 | 76.6 | |||
| 78.9 | 76.4 | 81.3 | 78.6 | 84.5 | 74.6 | 88.1 | 91.6 | |||
| 84.6 | 82.9 | 86.3 | 82.8 | 84.2 | 79.6 | 89.6 | 81.3 | |||
| 81.8 | 80.0 | 83.6 | 81.5 | 84.0 | 77.3 | 89.1 | 100+ | |||
| 76.2 | 73.6 | 78.7 | 76.0 | 84.3 | 74.4 | 88.7 | 100+ | |||
| 82.5 | 79.7 | 85.3 | 81.7 | 77.0 | 86.1 | 83.2 | 91.0 | |||
| 79.1 | 77.0 | 81.1 | 78.4 | 84.6 | 76.5 | 86.8 | 99.5 | |||
| 77.1 | 74.8 | 79.2 | 77.5 | 90.5 | 74.3 | 87.1 | 82.2 | |||
| 80.4 | 77.9 | 82.6 | 81.4 | 91.4 | 76.9 | 87.1 | 87.1 | |||
| 83.8 | 81.1 | 86.6 | 82.9 | 85.6 | 72.8 | 87.5 | 77.2 | |||
| 75.7 | 73.0 | 78.2 | 76.2 | 88.5 | 73.0 | 84.1 | 99.6 | |||
| 82.4 | 80.3 | 84.3 | 82.0 | 86.2 | 78.2 | 87.8 | 74.4 | |||
| 79.8 | 77.7 | 82.0 | 80.6 | 79.4 | 75.9 | 86.4 | 76.0 | |||
| 78.6 | 75.6 | 81.0 | 87.5 | 87.8 | 72.6 | 89.5 | 98.5 | |||
| 81.2 | 78.4 | 83.9 | 80.4 | 88.4 | 79.5 | 90.0 | 83.2 | |||
| 80.5 | 77.7 | 83.2 | 77.5 | 81.2 | 79.8 | 88.6 | 92.1 | |||
| 77.0 | 74.2 | 79.8 | 77.5 | 89.4 | 74.2 | 87.5 | 97.0 | |||
| 72.4 | 72.5 | 78.1 | 77.3 | 79.6 | 72.2 | 90.0 | 77.4 | |||
| 76.1 | 73.7 | 78.4 | 76.2 | 82.6 | 73.2 | 83.2 | 74.3 | |||
| 79.7 | 77.3 | 81.9 | 79.7 | 85.5 | 74.4 | 84.8 | 72.8 | |||
| 78.8 | 76.4 | 81.3 | 77.2 | 86.2 | 74.5 | 85.4 | 80.4 | |||
| 75.7 | 72.5 | 78.4 | 78.1 | 89.9 | 73.3 | 86.9 | 87.1 | |||
| 75.8 | 73.2 | 78.3 | 76.1 | 89.2 | 73.3 | 84.1 | 81.2 | |||
| 72.8 | 68.9 | 76.7 | 75.5 | 92.5 | 70.7 | 94.8 | 96.2 | |||
| 76.9 | 74.4 | 79.4 | 78.4 | 82.5 | 71.6 | 83.8 | 76.5 | |||
| 78.5 | 75.7 | 81.3 | 79.3 | 78.1 | 75.3 | 84.5 | 75.7 | |||
| 79.6 | 77.1 | 82.0 | 79.5 | 80.9 | 76.5 | 87.9 | 71.1 | |||
| 78.9 | 76.6 | 81.2 | 77.9 | 81.1 | 72.1 | 81.5 | 79.0 | |||
| 80.0 | 77.7 | 82.1 | 80.1 | 81.9 | 77.0 | 85.1 | 76.1 | |||
| 79.6 | 77.4 | 82.0 | 78.8 | 83.0 | 75.7 | 85.0 | 75.4 | |||
| 79.5 | 77.1 | 81.9 | 82.8 | 88.8 | 75.2 | 89.5 | 92.9 | |||
| 78.2 | 75.7 | 80.6 | 78.9 | 84.3 | 74.6 | 86.2 | 92.0 | |||
| 78.8 | 78.0 | 80.6 | 78.9 | 79.6 | 76.1 | 86.0 | 75.4 | |||
| 79.1 | 76.7 | 81.5 | 79.6 | 87.9 | 72.6 | 87.2 | 74.4 | |||
| 81.6 | 79.5 | 83.5 | 82.2 | 87.5 | 77.8 | 89.1 | 83.5 | |||
| 82.2 | 79.4 | 84.8 | 80.3 | 84.0 | 76.7 | 90.2 | 97.3 | |||
| 82.4 | 80.2 | 84.4 | 81.2 | 84.4 | 76.1 | 88.8 | 83.9 | |||
| 80.6 | 78.8 | 82.2 | 80.5 | 85.3 | 78.2 | 88.1 | 85.5 | |||
| 82.9 | 80.7 | 84.9 | 82.0 | 84.6 | 75.7 | 88.2 | 83.6 | |||
| 81.3 | 79.2 | 83.2 | 81.9 | 89.5 | 77.2 | 86.1 | 64.7 | |||
| 76.6 | 74.1 | 79.1 | 77.2 | 84.9 | 71.3 | 82.9 | 73.8 | |||
| 79.3 | 77.0 | 81.7 | 78.7 | 82.5 | 76.4 | 90.3 | 83.4 | |||
| 79.5 | 77.4 | 81.5 | 79.0 | 84.8 | 77.0 | 87.0 | 99.9 | |||
| 76.9 | 73.2 | 80.6 | 80.1 | 82.7 | 74.9 | 87.7 | 81.2 | |||
| 76.9 | 74.2 | 79.4 | 78.0 | 82.1 | 73.7 | 89.1 | 84.9 | |||
| 77.9 | 75.2 | 80.4 | 78.7 | 90.8 | 72.4 | 87.7 | 82.0 | |||
| 80.3 | 77.8 | 82.7 | 79.6 | 83.6 | 77.8 | 89.1 | 88.7 | |||
| 79.5 | 77.6 | 81.4 | 79.2 | 82.6 | 76.1 | 83.4 | 74.9 |
See also
- List of U.S. congressional districts by life expectancy
- List of U.S. counties with shortest life expectancy
- List of U.S. counties with longest life expectancy
- List of Mexican states by life expectancy
- List of Canadian provinces and territories by life expectancy
- List of European regions by life expectancy
- List of U.S. states and territories by poverty rate
- Thank God for Mississippi
Notes
References
- "Robert Wood Johnson Foundation".
- "World Bank".
- "U.S. life expectancy declines again, a dismal trend not seen since World War I - The Washington Post".
- "Journal of the American Medical Association" (PDF).
- "USAmortality.org".
- "2020 Human development index".
- "2019 mortality" (PDF).
- "CIA world factbook".
- "IHME Country Profiles".
- "Mortality 2019" (PDF).
- "United States health map".