Gumbel distribution
In probability theory and statistics, the Gumbel distribution (Generalized Extreme Value distribution Type-I) is used to model the distribution of the maximum (or the minimum) of a number of samples of various distributions.
|
Probability density function 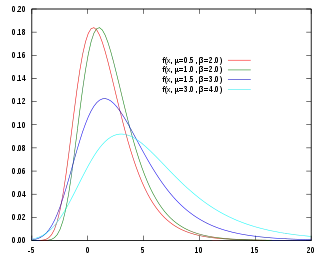 | |||
|
Cumulative distribution function 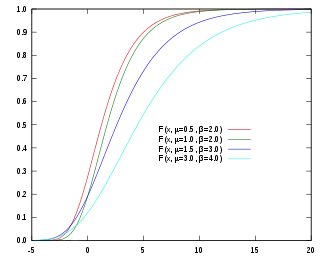 | |||
| Parameters |
location (real) scale (real) | ||
|---|---|---|---|
| Support | |||
|
where | |||
| CDF | |||
| Mean |
where is the Euler–Mascheroni constant | ||
| Median | |||
| Mode | |||
| Variance | |||
| Skewness | |||
| Ex. kurtosis | |||
| Entropy | |||
| MGF | |||
| CF | |||


This distribution might be used to represent the distribution of the maximum level of a river in a particular year if there was a list of maximum values for the past ten years. It is useful in predicting the chance that an extreme earthquake, flood or other natural disaster will occur. The potential applicability of the Gumbel distribution to represent the distribution of maxima relates to extreme value theory, which indicates that it is likely to be useful if the distribution of the underlying sample data is of the normal or exponential type. This article uses the Gumbel distribution to model the distribution of the maximum value. To model the minimum value, use the negative of the original values.
The Gumbel distribution is a particular case of the generalized extreme value distribution (also known as the Fisher-Tippett distribution). It is also known as the log-Weibull distribution and the double exponential distribution (a term that is alternatively sometimes used to refer to the Laplace distribution). It is related to the Gompertz distribution: when its density is first reflected about the origin and then restricted to the positive half line, a Gompertz function is obtained.
In the latent variable formulation of the multinomial logit model — common in discrete choice theory — the errors of the latent variables follow a Gumbel distribution. This is useful because the difference of two Gumbel-distributed random variables has a logistic distribution.
The Gumbel distribution is named after Emil Julius Gumbel (1891–1966), based on his original papers describing the distribution.[1][2]
Definitions
The cumulative distribution function of the Gumbel distribution is

Standard Gumbel distribution
The standard Gumbel distribution is the case where and with cumulative distribution function


and probability density function

In this case the mode is 0, the median is , the mean is (the Euler–Mascheroni constant), and the standard deviation is


The cumulants, for n>1, are given by

Properties
The mode is μ, while the median is and the mean is given by

- ,

where is the Euler-Mascheroni constant.
The standard deviation is hence [3]


At the mode, where , the value of becomes , irrespective of the value of


Related distributions
- If has a Gumbel distribution, then the conditional distribution of Y=−X given that Y is positive, or equivalently given that X is negative, has a Gompertz distribution. The cdf G of Y is related to F, the cdf of X, by the formula for y>0. Consequently, the densities are related by : the Gompertz density is proportional to a reflected Gumbel density, restricted to the positive half-line.[4]
- If X is an exponentially distributed variable with mean 1, then −log(X) has a standard Gumbel distribution.
- If and then (see Logistic distribution).
- If and then . Note that .


Theory related to the generalized multivariate log-gamma distribution provides a multivariate version of the Gumbel distribution.
Occurrence and applications
Gumbel has shown that the maximum value (or last order statistic) in a sample of a random variable following an exponential distribution minus natural logarithm of the sample size [6] approaches the Gumbel distribution closer with increasing sample size.[7]
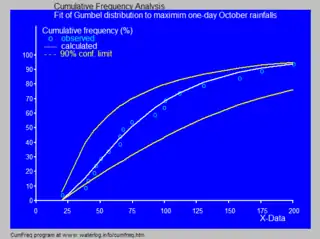
In hydrology, therefore, the Gumbel distribution is used to analyze such variables as monthly and annual maximum values of daily rainfall and river discharge volumes,[3] and also to describe droughts.[8]
Gumbel has also shown that the estimator r⁄(n+1) for the probability of an event — where r is the rank number of the observed value in the data series and n is the total number of observations — is an unbiased estimator of the cumulative probability around the mode of the distribution. Therefore, this estimator is often used as a plotting position.
In number theory, the Gumbel distribution approximates the number of terms in a random partition of an integer[9] as well as the trend-adjusted sizes of maximal prime gaps and maximal gaps between prime constellations.[10]
In machine learning, the Gumbel distribution is sometimes employed to generate samples from the categorical distribution.[11]
Computational methods
Probability paper
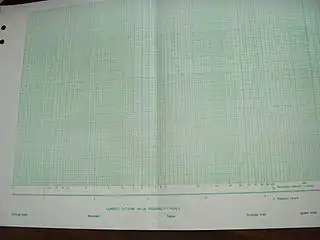
In pre-software times probability paper was used to picture the Gumbel distribution (see illustration). The paper is based on linearization of the cumulative distribution function :


In the paper the horizontal axis is constructed at a double log scale. The vertical axis is linear. By plotting on the horizontal axis of the paper and the -variable on the vertical axis, the distribution is represented by a straight line with a slope 1. When distribution fitting software like CumFreq became available, the task of plotting the distribution was made easier, as is demonstrated in the section below.


Generating Gumbel variates
Since the quantile function (inverse cumulative distribution function), , of a Gumbel distribution is given by


the variate has a Gumbel distribution with parameters and when the random variate is drawn from the uniform distribution on the interval .


See also
References
- Gumbel, E.J. (1935), "Les valeurs extrêmes des distributions statistiques" (PDF), Annales de l'Institut Henri Poincaré, 5 (2): 115–158
- Gumbel E.J. (1941). "The return period of flood flows". The Annals of Mathematical Statistics, 12, 163–190.
- Oosterbaan, R.J. (1994). "Chapter 6 Frequency and Regression Analysis" (PDF). In Ritzema, H.P. (ed.). Drainage Principles and Applications, Publication 16. Wageningen, The Netherlands: International Institute for Land Reclamation and Improvement (ILRI). pp. 175–224. ISBN 90-70754-33-9.
- Willemse, W.J.; Kaas, R. (2007). "Rational reconstruction of frailty-based mortality models by a generalisation of Gompertz' law of mortality" (PDF). Insurance: Mathematics and Economics. 40 (3): 468. doi:10.1016/j.insmatheco.2006.07.003.
- CumFreq, software for probability distribution fitting
- [https://math.stackexchange.com/questions/3527556/gumbel-distribution-and-exponential-distribution?noredirect=1#comment7669633_3527556 user49229, Gumbel distribution and exponential distribution ]
- Gumbel, E.J. (1954). Statistical theory of extreme values and some practical applications. Applied Mathematics Series. 33 (1st ed.). U.S. Department of Commerce, National Bureau of Standards. ASIN B0007DSHG4.
- Burke, Eleanor J.; Perry, Richard H.J.; Brown, Simon J. (2010). "An extreme value analysis of UK drought and projections of change in the future". Journal of Hydrology. 388 (1–2): 131–143. Bibcode:2010JHyd..388..131B. doi:10.1016/j.jhydrol.2010.04.035.
- Erdös, Paul; Lehner, Joseph (1941). "The distribution of the number of summands in the partitions of a positive integer". Duke Mathematical Journal. 8 (2): 335. doi:10.1215/S0012-7094-41-00826-8.
- Kourbatov, A. (2013). "Maximal gaps between prime k-tuples: a statistical approach". Journal of Integer Sequences. 16. arXiv:1301.2242. Bibcode:2013arXiv1301.2242K. Article 13.5.2.
- Adams, Ryan. "The Gumbel-Max Trick for Discrete Distributions".
External links
| Wikimedia Commons has media related to: |