Juab County, Utah
Juab County (/ˈdʒuːæb/ JOO-ab) is a county in western Utah, United States. As of the 2010 United States Census, the population was 10,246.[1] Its county seat and largest city is Nephi.[2]
Juab County | |
|---|---|
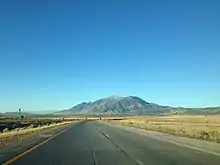
 Nephi Post Office (2010) | |
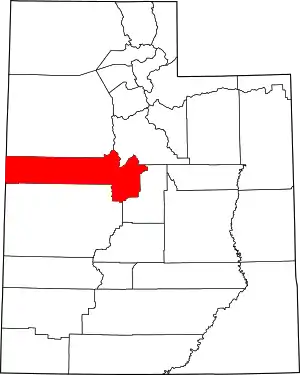 Location within the U.S. state of Utah | |
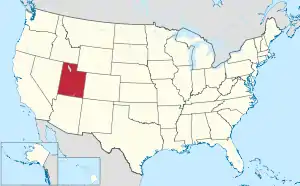 Utah's location within the U.S. | |
| Coordinates: 39.71°N 112.80°W | |
| Country | |
| State | |
| Founded | March 3, 1852 |
| Named for | Native American word for valley |
| Seat | Nephi |
| Largest city | Nephi |
| Area | |
| • Total | 3,406 sq mi (8,820 km2) |
| • Land | 3,392 sq mi (8,790 km2) |
| • Water | 14 sq mi (40 km2) 0.4% |
| Population (2010) | |
| • Total | 10,246 |
| • Estimate (2019) | 12,017 |
| • Density | 3.5/sq mi (1.4/km2) |
| Time zone | UTC−7 (Mountain) |
| • Summer (DST) | UTC−6 (MDT) |
| Congressional district | 2nd |
| Website | www |
Juab County is part of the Provo–Orem, Utah Metropolitan Statistical Area, which is also included in the Salt Lake City–Provo–Orem, Utah Combined Statistical Area.
History
The area of future Juab County was inhabited by nomadic indigenous peoples before the Mormon settlement of Utah beginning in 1847. Soon thereafter, Mormons and others traveling through the area had somewhat established a road to California, leading SSW from Great Salt Lake City. It passed Salt Creek,[3] flowing westward through a slough in the Wasatch Mountains. The area around this creek was often used as a stopping or camping spot by travelers, and by 1851 Mormon settlers had begun a settlement on the area. When the Utah Territory legislature created a county (by partitioning territory from Utah County) to oversee the growth and organization of the largely uninhabited and unarable area, this settlement (called Salt Creek) was the only real settlement worthy of the name, and it was designated as the county seat in a March 3, 1852 legislative act. The new county's description included considerable territory falling in present-day Nevada. The county name reportedly derived from a Native American word meaning thirsty valley, or possibly only valley.
The county's boundaries were altered in 1854, in 1855, and 1856. Also in 1856 the Territory legislature, acknowledging the upcoming establishment of Nevada Territory, removed from the boundary description of Juab county all territories west of 114 degrees longitude. Further boundary adjustments were made in 1861, in 1862, in 1866, in 1870, in 1888, and 1913. A small adjustment between Juab and Sanpete counties on March 8, 1919 created the current Juab County configuration.[4]
Early settlers in Salt Creek devoted themselves to agriculture and livestock. However, by 1869 mining of precious metals had begun in the Tintic region. Mining towns including Diamond, Silver City, and Eureka appeared. By 1889 it was considered one of the nation's most productive mining areas. Mining continued as the dominant economic driver through mid-twentieth century, then subsided.[5] Salt Creek grew apace, although in 1882 the town name (and US Post Office designation) was changed to "Nephi".[6]
Geography
Juab County lies on the west side of Utah. Its west border abuts the east border of the state of Nevada. Its planar areas consist of rugged arid semi-arable fine-grain soil, interrupted with hills and low mountains. Its eastern border is loosely defined by the ridgeline of an arm of the Wasatch Mountains.[7] The terrain generally slopes to the north, with its highest point on Mount Ibapah,[8] a crest of the East Central Great Basin Range in northwest Juab County. The listed elevation of Mt. Ibapah is 12,087' (3684m) ASL.[9] The county has a total area of 3,406 square miles (8,820 km2), of which 3,392 square miles (8,790 km2) is land and 14 square miles (36 km2) (0.4%) is water.[10]

Airports
- Nephi Municipal Airport (NPH)
Highways[7]
Adjacent counties
- Tooele County - north
- Utah County - northeast
- Sanpete County - southeast
- Millard County - south
- White Pine County, Nevada - west
Protected areas
- Deep Creek Wildlife Management Area
- Fish Springs National Wildlife Refuge
- Fishlake National Forest (part)
- Mona Front Wildlife Management Area
- Triangle Ranch Wildlife Management Area
- Uinta-Wasatch-Cache National Forest (part)
- Yuba State Park (part)
- Yuba Lake State Recreation Area
Lakes[7]
- Andys Pond
- Antelope Springs
- Baker Hot Springs
- Big Spring
- Bittner Knoll Reservoir
- Blue Springs
- Brough Reservoir
- Burraston Ponds
- Cane Springs
- CCC Reservoir
- Cherry Creek Reservoir
- Chicken Creek Reservoir
- Coyote Knoll Reservoir
- Crater Bench Reservoir
- Dead Horse Tank
- Desert Mountain Reservoir
- Dog Valley Reservoir
- East Dugway Reservoir
- East Topaz Reservoir
- East Topaz 2 Reservoir
- Fish Springs
- Avocet Pool
- Crater Spring
- Curlew Pool
- Deadman Spring
- Egret Pool
- Gadwall Pool
- Harrison Pool
- House Springs
- Ibis Pool
- Lost Spring
- Mallard Pool
- Middle Spring
- Mirror Spring
- North Springs
- Percy Spring
- Pintail Pool
- Shoveler Pool
- South Springs
- Thomas Springs
- Walter Spring
- Hogback Reservoir
- Hole in Rock Reservoir
- Hole-in-the-Wall Reservoir
- Irons Reservoir
- Laird Spring
- Lime Spring
- Little Red Cedar Spring
- Lower Topaz Reservoir
- Mile Pond
- Molten Spring
- Mona Reservoir
- Monument Reservoir
- Mud Lake Reservoir
- Mud Springs
- North Sugarville Reservoir
- Picture Rock Reservoir
- Picture Rock Wash Reservoir
- Rain Lake
- River Bed Reservoir
- River Bed Reservoir Number 2
- Roadside Reservoir (near Boyd Station)
- Roadside Reservoir (in the Tule Valley)
- South Desert Mountain Reservoir
- Studhorse Springs
- Swasey Point Reservoir
- Table Knoll Reservoir
- Trough Spring
- West Fork Reservoir
- Yuba Lake (or Sevier Bridge Reservoir)(partially)
| Historical population | |||
|---|---|---|---|
| Census | Pop. | %± | |
| 1860 | 672 | — | |
| 1870 | 2,034 | 202.7% | |
| 1880 | 3,474 | 70.8% | |
| 1890 | 5,582 | 60.7% | |
| 1900 | 10,082 | 80.6% | |
| 1910 | 10,702 | 6.1% | |
| 1920 | 9,871 | −7.8% | |
| 1930 | 8,605 | −12.8% | |
| 1940 | 7,392 | −14.1% | |
| 1950 | 5,981 | −19.1% | |
| 1960 | 4,597 | −23.1% | |
| 1970 | 4,574 | −0.5% | |
| 1980 | 5,530 | 20.9% | |
| 1990 | 5,817 | 5.2% | |
| 2000 | 8,238 | 41.6% | |
| 2010 | 10,246 | 24.4% | |
| 2019 (est.) | 12,017 | 17.3% | |
| US Decennial Census[11] 1790–1960[12] 1900–1990[13] 1990–2000[14] 2010–2018[1] 2019[15] | |||
Demographics
As of July 1, 2018,[16] the US Census Bureau estimates that there were 11,555 people and 3,557 housing units in the county. The population density was 3.12/sqmi (1.21/km2).[17] There were 3,066 households. The racial makeup of the county was 96.4% White, 0.4% Black or African American, 1.0% Native American, 0.4% Asian, 0.2% Pacific Islander, and 1.5% from two or more races. 4.7% of the population were Hispanic or Latino of any race.
In 2010,[18] there were 3,093 households, out of which 47.8% had children under the age of 18 living with them, 68.50% were married couples living together, 8.80% had a female householder with no husband present, and 19.40% were non-families. 17.30% of all households the householder lived alone. The average household size was 3.27 and the average family size was 3.74.
The county population contained 40.1% 19 and younger, 5.0% from 20 to 24, 24.80% from 25 to 44, 20.1% from 45 to 64, and 10.2% who were 65 years of age or older. The median age was 29.3 years. 51% of the population was male and 49% was female.
The median income for a household in the county was $56,976. The per capita income for the county was $18,503 and 11.4% of the population were below the poverty line.
Politics
Juab has traditionally voted Republican. In only one national election since 1948 has the county selected the Democratic Party candidate.
| Year | Republican | Democratic | Third parties |
|---|---|---|---|
| 2016 | 67.0% 2,827 | 10.5% 442 | 22.6% 952 |
| 2012 | 86.0% 3,448 | 11.3% 451 | 2.8% 111 |
| 2008 | 73.2% 2,683 | 20.2% 741 | 6.6% 242 |
| 2004 | 78.5% 2,681 | 17.7% 605 | 3.8% 131 |
| 2000 | 72.6% 2,023 | 22.2% 619 | 5.1% 143 |
| 1996 | 49.1% 1,290 | 35.3% 928 | 15.5% 408 |
| 1992 | 42.7% 1,237 | 28.4% 823 | 28.8% 835 |
| 1988 | 59.7% 1,505 | 38.6% 974 | 1.7% 44 |
| 1984 | 67.2% 1,902 | 32.4% 917 | 0.4% 10 |
| 1980 | 69.3% 1,872 | 26.7% 720 | 4.0% 109 |
| 1976 | 51.6% 1,290 | 43.6% 1,091 | 4.8% 120 |
| 1972 | 67.1% 1,629 | 28.5% 691 | 4.5% 109 |
| 1968 | 54.0% 1,201 | 40.8% 907 | 5.3% 118 |
| 1964 | 41.3% 926 | 58.8% 1,319 | |
| 1960 | 51.0% 1,203 | 49.1% 1,158 | |
| 1956 | 59.6% 1,512 | 40.4% 1,025 | |
| 1952 | 58.7% 1,711 | 41.3% 1,203 | |
| 1948 | 47.9% 1,396 | 51.6% 1,501 | 0.5% 15 |
| 1944 | 44.5% 1,192 | 55.3% 1,483 | 0.2% 5 |
| 1940 | 39.7% 1,412 | 60.1% 2,136 | 0.1% 5 |
| 1936 | 30.4% 1,027 | 68.7% 2,319 | 0.9% 31 |
| 1932 | 37.6% 1,220 | 60.7% 1,969 | 1.7% 56 |
| 1928 | 47.5% 1,557 | 52.3% 1,714 | 0.2% 8 |
| 1924 | 43.6% 1,325 | 40.8% 1,241 | 15.6% 475 |
| 1920 | 53.1% 1,692 | 41.1% 1,308 | 5.8% 185 |
| 1916 | 34.5% 1,248 | 61.3% 2,221 | 4.3% 154 |
| 1912 | 35.4% 1,171 | 29.8% 985 | 34.9% 1,154 |
| 1908 | 48.4% 1,615 | 42.6% 1,421 | 9.0% 301 |
| 1904 | 48.3% 1,493 | 39.0% 1,206 | 12.7% 391 |
| 1900 | 42.5% 1,532 | 55.0% 1,986 | 2.5% 90 |
| 1896 | 15.7% 439 | 84.3% 2,360 |
Education
The county is served by two school districts:
- Juab School District, serving the Juab Valley area on the eastern end of the county
- Tintic School District, serving the remaining western part of the county
Communities[7]
Cities
Towns
Unincorporated communities
Former communities
- Chicken Creek
- Diamond
- Jericho
- Joy
- Knightsville
- Silver City
See also
References
- "State & County QuickFacts". United States Census Bureau. Archived from the original on June 6, 2011. Retrieved December 29, 2013 – via Wayback Machine.
- "Find a County". National Association of Counties. Archived from the original on May 31, 2011. Retrieved June 7, 2011.
- Salt Creek Google Maps (accessed 28 March 2019)
- Newberry Library Individual County Chronologies/Juab County UT (accessed March 28, 2019)
- "About Us" - Juab County UT" (accessed 28 March 2019)
- County Post Offices: Salt Creek (1851-1882), Nephi (1882- ) (accessed 28 March 2019)
- Juab County UT Google Maps (accessed 28 March 2019)
- Mount Ibapah, Juab County UT Google Maps (accessed 28 March 2019)
- "Utah County High Points/Juab County. Peakbagger (accessed 28 March 2019)". Archived from the original on March 27, 2019. Retrieved March 28, 2019.
- "2010 Census Gazetteer Files". census.gov. US Census Bureau. August 22, 2012. Retrieved June 25, 2015.
- "US Decennial Census". census.gov. US Census Bureau. Retrieved June 25, 2015.
- "Historical Census Browser". lib.virginia.edu. University of Virginia Library. Retrieved June 25, 2015.
- Forstall, Richard L., ed. (June 25, 1995). "Population of Counties by Decennial Census: 1900 to 1990". census.gov. US Census Bureau. Retrieved March 27, 2015.
- "Census 2000 PHC-T-4. Ranking Tables for Counties: 1990 and 2000" (PDF). census.gov. US Census Bureau. April 2, 2001. Retrieved June 25, 2015.
- "QuickFacts. Utah counties". Retrieved May 17, 2020.
- "Bachelor's degree or higher, percent of persons age 25 years+, 2010–2014". census.gov. US Census Bureau. Retrieved April 21, 2016.
- "Juab County UT Demographics data". towncharts.com. Retrieved April 21, 2016.
- Bureau, US Census. "U.S. Census website". United States Census Bureau. Retrieved April 22, 2016 – via Wayback Machine.
- Leip, David. "Atlas of US Presidential Elections". uselectionatlas.org. Retrieved March 31, 2018.
External links
| Wikimedia Commons has media related to Juab County, Utah. |
- Juab County website
- Juab County Fair website
- Juab County Sheriff's Office website
- Juab Travel Council website
- Ghost Towns of Juab County (on ghosttowns.com)
Places adjacent to Juab County, Utah | |
|---|---|
Municipalities and communities of Juab County, Utah, United States | ||
|---|---|---|
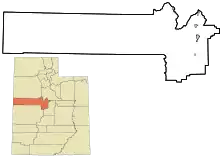
| Cities | Map of Utah highlighting Juab County | |
| Towns | ||
| Unincorporated communities | ||
| Ghost towns | ||
| Indian reservation | ||
| Footnotes | ‡This populated place also has portions in an adjacent county or counties | |
| ||
Salt Lake City (capital) | |||||||||||||
| Topics |
|  | |||||||||||
| Society |
| ||||||||||||
| Regions | |||||||||||||
| Largest cities |
| ||||||||||||
| Counties | |||||||||||||
| Attractions |
| ||||||||||||
| Flora and fauna | |||||||||||||
| Authority control |
|---|