Kentucky's 5th congressional district
Kentucky's 5th congressional district is a congressional district in the U.S. state of Kentucky. Located in the heart of Appalachia in Southeastern Kentucky, the rural district is the second most impoverished district in the nation[5] and, as of the 2010 U.S. Census, has the highest percentage of White Americans in the nation. Within the district are the economic leading cities of Pikeville, Prestonsburg, Middlesboro, Hazard, Jackson, Morehead, London, and Somerset. It is the most rural district in the United States, with 76.49% of its population in rural areas.[6]
| Kentucky's 5th congressional district | |||
|---|---|---|---|
.tif.png.webp) Kentucky's 5th congressional district - since January 3, 2013. | |||
| Representative |
| ||
| Distribution |
| ||
| Population (2019) | 689,793[2] | ||
| Median household income | $35,636[3] | ||
| Ethnicity |
| ||
| Cook PVI | R+31[4] | ||
The 5th congressional district is one of the few ancestrally Republican regions south of the Ohio River. Much of the region now in the district strongly supported the Union in the Civil War, and identified with the Republicans after hostilities ceased. Much of the eastern portion of the district was once part of the disbanded 7th congressional district, long a Democratic stronghold. The 7th was disbanded in 1992 after the 1990 census showed that the state's population no longer merited seven districts. Geographically, the district consists of flat land areas to the west, to Appalachia highland mountains to the east and southeast. To the north to northeast of the district are rolling hills that end at the Ohio River.
Despite the district's strong Republican lean, it features the county of Elliott, which, before being carried by Donald Trump in 2016, had never voted for a Republican president since its founding in 1869, making it the longest Democratic voting streak. The county had not voted for the district's current representative, Hal Rogers, who except for 1992 has always been elected by at least 65%, before 2018, when he received 54.6% of the county's vote.
The district is represented by Republican Harold D. "Hal" Rogers, the dean of the Kentucky delegation. Rogers serves in various leadership positions in the U.S. House of Representatives.
Characteristics
As of September 2013, there were 510,329 registered voters: 253,798 (49.73%) Democrats, 235,470 (46.14%) Republicans, and 21,061 (4.13%) "Others". All of the "Others" included 15,344 (3.01%) unclassified Others, 5,385 (1.06%) Independents, 241 (0.05%) Libertarians, 43 (0.0084%) Greens, 21 (0.0041%) Constitutionalists, 20 (0.0039%) Reforms, and 7 (0.0014%) Socialist Workers.[7][8]
Until January 1, 2006, Kentucky did not track party affiliation for registered voters who were neither Democratic nor Republican.[9] The Kentucky voter registration card does not explicitly list anything other than Democratic Party, Republican Party, or Other, with the "Other" option having a blank line and no instructions on how to register as something else.[10]
Recent presidential elections
| Election results from presidential races | ||
|---|---|---|
| Year | Office | Results |
| 2000 | President | Bush 57 - 42% |
| 2004 | President | Bush 61 - 39% |
| 2008 | President | McCain 67 - 31% |
| 2012 | President | Romney 75 - 23% |
| 2016 | President | Trump 80 - 18% |
| 2020 | President | Trump 80 - 19% |
List of members representing the district
| Member | Party | Years | Cong ress |
Electoral history | Location |
|---|---|---|---|---|---|
| District created March 4, 1803 | |||||
| John Fowler | Democratic-Republican | March 4, 1803 – March 3, 1807 |
8th 9th |
Redistricted from the 2nd district and re-elected in 1803. Re-elected in 1804. Retired. |
1803–1813 Clarke, Fayette, Jessamine, Montgomery, and Woodford counties |
 Benjamin Howard |
Democratic-Republican | March 4, 1807 – April 10, 1810 |
10th 11th |
Elected in 1806. Re-elected in 1808. Resigned to become governor of Louisiana Territory. | |
 William T. Barry |
Democratic-Republican | August 8, 1810 – March 3, 1811 |
11th | Elected to finish Howard's term. Retired. | |
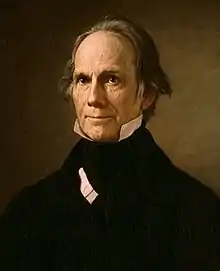 Henry Clay |
Democratic-Republican | March 4, 1811 – March 3, 1813 |
12th | Elected in 1810. Redistricted to the 2nd district. | |
 Samuel Hopkins |
Democratic-Republican | March 4, 1813 – March 3, 1815 |
13th | Elected in 1812. Retired. |
1813–1823 Breckinridge, Caldwell, Christian, Grayson, Henderson, Hopkins, Livingston, Muhlenberg, Ohio, and Union counties |
 Alney McLean |
Democratic-Republican | March 4, 1815 – March 3, 1817 |
14th | Elected in 1814. Retired. | |
| Anthony New | Democratic-Republican | March 4, 1817 – March 3, 1819 |
15th | Elected in 1816. Retired. | |
Alney McLean |
Democratic-Republican | March 4, 1819 – March 3, 1821 |
16th | Elected in 1818. Retired. | |
| Anthony New | Democratic-Republican | March 4, 1821 – March 3, 1823 |
17th | Elected in 1820. Retired. | |
 John T. Johnson |
Democratic-Republican | March 4, 1823 – March 3, 1825 |
18th | Redistricted from the 3rd district and re-elected in 1822. Retired. |
1823–1833 [data unknown/missing] |
 James Johnson |
Jacksonian | March 4, 1825 – August 13, 1826 |
19th | Elected in 1824. Died. | |
| Vacant | August 13, 1826 – December 7, 1826 |
||||
| Robert L. McHatton | Jacksonian | December 7, 1826 – March 3, 1829 |
19th 20th |
Elected to finish Johnson's term. Re-elected in 1827. Retired. | |
 Richard M. Johnson |
Jacksonian | March 4, 1829 – March 3, 1833 |
21st 22nd |
Elected in 1829. Re-elected in 1831. Redistricted to the 13th district. | |
| Vacant | March 4, 1833 – August 6, 1834 |
23rd | House declared new election after election was contested | 1833–1843 Garrard County added to the district. | |
 Robert P. Letcher |
Anti-Jacksonian | August 6, 1834 – March 3, 1835 |
Elected to finish the vacant term. Retired. | ||
| James Harlan | Anti-Jacksonian | March 4, 1835 – March 3, 1837 |
24th 25th |
Elected in 1835. Re-elected in 1837. Retired. | |
| Whig | March 4, 1837 – March 3, 1839 | ||||
 Simeon H. Anderson |
Whig | March 4, 1839 – August 11, 1840 |
26th | Elected in 1839. Died. | |
| Vacant | August 11, 1840 – December 7, 1840 |
||||
 John B. Thompson |
Whig | December 7, 1840 – March 3, 1843 |
26th 27th |
Elected to finish Anderson's term. Re-elected in 1841. Retired. | |
| James W. Stone | Democratic | March 4, 1843 – March 3, 1845 |
28th | Elected in 1843. Lost re-election. |
1843–1853 [data unknown/missing] |
| Bryan Young | Whig | March 4, 1845 – March 3, 1847 |
29th | Elected in 1845. Retired. | |
John B. Thompson |
Whig | March 4, 1847 – March 3, 1851 |
30th 31st |
Elected in 1847. Re-elected in 1849. Retired. | |
| James W. Stone | Democratic | March 4, 1851 – March 3, 1853 |
32nd | Elected in 1851. Lost re-election. | |
| Clement S. Hill | Whig | March 4, 1853 – March 3, 1855 |
33rd | Elected in 1853. Retired. |
1853–1863 [data unknown/missing] |
 Joshua Jewett |
Democratic | March 4, 1855 – March 3, 1859 |
34th 35th |
Elected in 1855. Re-elected in 1857. Lost re-election. | |
| Vacant | March 4, 1855 – December 3, 1860 |
36th | |||
 John Y. Brown |
Democratic | December 3, 1860 – March 3, 1861 |
Elected in 1859 but did not take seat until 2nd session because did not meet age requirement for office. Retired. | ||
 Charles A. Wickliffe |
Unionist | March 4, 1861 – March 3, 1863 |
37th | Elected in 1861. Retired. | |
 Robert Mallory |
Unionist | March 4, 1863 – March 3, 1865 |
38th | Redistricted from the 7th district and re-elected in 1863. Lost re-election. |
1863–1873 [data unknown/missing] |
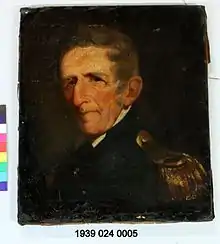
 Lovell Rousseau |
Unconditional Unionist | March 4, 1865 – July 21, 1866 |
39th | Elected in 1865. Resigned following his assault of Rep. Josiah Grinnell. | |
| Vacant | July 21, 1866 – December 3, 1866 |
||||
Lovell Rousseau |
Unconditional Unionist | December 3, 1866 – March 3, 1867 |
Elected to finish his own term. Lost re-election. | ||
 Asa Grover |
Democratic | March 4, 1867 – March 3, 1869 |
40th | Elected in 1867. Retired. | |
 Boyd Winchester |
Democratic | March 4, 1869 – March 3, 1873 |
41st 42nd |
Elected in 1868. Re-elected in 1870. Retired. | |
 Elisha Standiford |
Democratic | March 4, 1873 – March 3, 1875 |
43rd | Elected in 1872. Renominated but declined. |
1873–1883 [data unknown/missing] |
 Edward Y. Parsons |
Democratic | March 4, 1875 – July 8, 1876 |
44th | Elected in 1874. Died. | |
| Vacant | July 8, 1876 – August 12, 1876 |
||||
 Henry Watterson |
Democratic | August 12, 1876 – March 3, 1877 |
Elected to finish Parsons's term. Retired. | ||
 Albert S. Willis |
Democratic | March 4, 1877 – March 3, 1887 |
45th 46th 47th 48th 49th |
Elected in 1876. Re-elected in 1878. Re-elected in 1880. Re-elected in 1882. Re-elected in 1884. Lost renomination. | |
| 1883–1893 [data unknown/missing] | |||||
 Asher G. Caruth |
Democratic | March 4, 1887 – March 3, 1895 |
50th 51st 52nd 53rd |
Elected in 1886. Re-elected in 1888. Re-elected in 1890. Re-elected in 1892. Lost renomination. | |
| 1893–1903 [data unknown/missing] | |||||
 Walter Evans |
Republican | March 4, 1895 – March 3, 1899 |
54th 55th |
Elected in 1894. Re-elected in 1896. Lost re-election. | |
| Oscar Turner | Democratic | March 4, 1899 – March 3, 1901 |
56th | Elected in 1898. Retired. | |
 Harvey S. Irwin |
Republican | March 4, 1901 – March 3, 1903 |
57th | Elected in 1900. Lost re-election. | |
 J. Swagar Sherley |
Democratic | March 4, 1903 – March 3, 1919 |
58th 59th 60th 61st 62nd 63rd 64th 65th |
Elected in 1902. Re-elected in 1904. Re-elected in 1906. Re-elected in 1908. Re-elected in 1910. Re-elected in 1912. Re-elected in 1914. Re-elected in 1916. Lost re-election. |
1903–1933 [data unknown/missing] |
 Charles F. Ogden |
Republican | March 4, 1919 – March 3, 1923 |
66th 67th |
Elected in 1918. Re-elected in 1920. Retired. | |
 Maurice Thatcher |
Republican | March 4, 1923 – March 3, 1933 |
68th 69th 70th 71st 72nd |
Elected in 1922. Re-elected in 1924. Re-elected in 1926. Re-elected in 1928. Re-elected in 1930. Retired to run for U.S. senator. | |
| District not used | March 4, 1933 – January 3, 1935 |
73rd | |||
 Brent Spence |
Democratic | January 3, 1935 – January 3, 1963 |
74th 75th 76th 77th 78th 79th 80th 81st 82nd 83rd 84th 85th 86th 87th |
Redistricted from the at-large district and re-elected in 1934. Re-elected in 1936. Re-elected in 1938. Re-elected in 1940. Re-elected in 1942. Re-elected in 1944. Re-elected in 1946. Re-elected in 1948. Re-elected in 1950. Re-elected in 1952. Re-elected in 1954. Re-elected in 1956. Re-elected in 1958. Re-elected in 1960. Retired. |
1935–1943 [data unknown/missing] |
| 1943–1953 [data unknown/missing] | |||||
| 1953–1963 [data unknown/missing] | |||||
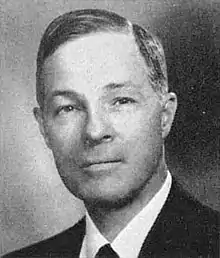 Eugene Siler |
Republican | January 3, 1963 – January 3, 1965 |
88th | Redistricted from the 8th district and re-elected in 1962. Retired. |
1963–1965 [data unknown/missing] |
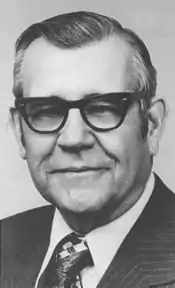 Tim Lee Carter |
Republican | January 3, 1965 – January 3, 1981 |
89th 90th 91st 92nd 93rd 94th 95th 96th |
Elected in 1964. Re-elected in 1966. Re-elected in 1968. Re-elected in 1970. Re-elected in 1972. Re-elected in 1974. Re-elected in 1976. Re-elected in 1978. Retired. |
1965–1973 [data unknown/missing] |
| 1973–1983 [data unknown/missing] | |||||
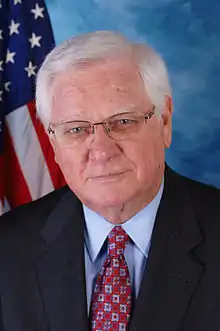 Hal Rogers |
Republican | January 3, 1981 – present |
97th 98th 99th 100th 101st 102nd 103rd 104th 105th 106th 107th 108th 109th 110th 111th 112th 113th 114th 115th 116th 117th |
Elected in 1980. Re-elected in 1982. Re-elected in 1984. Re-elected in 1986. Re-elected in 1988. Re-elected in 1990. Re-elected in 1992. Re-elected in 1994. Re-elected in 1996. Re-elected in 1998. Re-elected in 2000. Re-elected in 2002. Re-elected in 2004. Re-elected in 2006. Re-elected in 2008. Re-elected in 2010. Re-elected in 2012. Re-elected in 2014. Re-elected in 2016. Re-elected in 2018. Re-elected in 2020. | |
| 1983–1993 [data unknown/missing] | |||||
| 1993–2003 [data unknown/missing] | |||||
2003–2013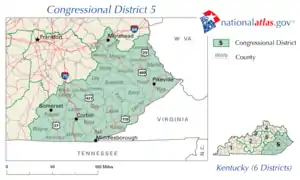 | |||||
2013–present.tif.png.webp) | |||||
Recent election results
2002
| Party | Candidate | Votes | % | |
|---|---|---|---|---|
| Republican | Hal Rogers* | 137,986 | 78.29 | |
| Democratic | Sidney Jane Bailey | 38,254 | 21.71 | |
| Total votes | 176,240 | 100.00 | ||
| Turnout | ||||
| Republican hold | ||||
2004
| Party | Candidate | Votes | % | |
|---|---|---|---|---|
| Republican | Hal Rogers* | 177,579 | 100.00 | |
| Total votes | 177,579 | 100.00 | ||
| Turnout | ||||
| Republican hold | ||||
2006
| Party | Candidate | Votes | % | |
|---|---|---|---|---|
| Republican | Hal Rogers* | 147,261 | 73.76 | |
| Democratic | Kenneth Stepp | 52,384 | 26.24 | |
| Total votes | 199,645 | 100.00 | ||
| Turnout | ||||
| Republican hold | ||||
2008
| Party | Candidate | Votes | % | |
|---|---|---|---|---|
| Republican | Hal Rogers* | 177,024 | 84.11 | |
| Independent | Jim Holbert | 33,444 | 15.89 | |
| Total votes | 210,468 | 100.00 | ||
| Turnout | ||||
| Republican hold | ||||
2010
| Party | Candidate | Votes | % | |
|---|---|---|---|---|
| Republican | Hal Rogers* | 151,019 | 77.43 | |
| Democratic | Jim Holbert | 44,034 | 22.58 | |
| Total votes | 195,053 | 100.00 | ||
| Turnout | ||||
| Republican hold | ||||
2012
| Party | Candidate | Votes | % | |
|---|---|---|---|---|
| Republican | Hal Rogers* | 195,408 | 77.90 | |
| Democratic | Kenneth S. Stepp | 55,447 | 22.10 | |
| Total votes | 250,855 | 100.00 | ||
| Turnout | ||||
| Republican hold | ||||
2014
| Party | Candidate | Votes | % | |
|---|---|---|---|---|
| Republican | Hal Rogers* | 171,350 | 78.30 | |
| Democratic | Kenneth S. Stepp | 47,617 | 21.70 | |
| Total votes | 218,967 | 100.00 | ||
| Turnout | ||||
| Republican hold | ||||
2016
| Party | Candidate | Votes | % | |
|---|---|---|---|---|
| Republican | Hal Rogers* | 221,242 | 100.00 | |
| Total votes | 221,242 | 100.00 | ||
| Turnout | ||||
| Republican hold | ||||
2018
| Party | Candidate | Votes | % | |
|---|---|---|---|---|
| Republican | Hal Rogers* | 172,093 | 78.9 | |
| Democratic | Kenneth Stepp | 45,890 | 21.0 | |
| Independent | Bill Ray (write-in) | 34 | 0.1 | |
| Total votes | 218,017 | 100.0 | ||
| Republican hold | ||||
2020
| Party | Candidate | Votes | % | |
|---|---|---|---|---|
| Republican | Hal Rogers* | 250,660 | 84.2 | |
| Democratic | Matthew Best | 46,993 | 15.8 | |
| Total votes | 297,653 | 100.0 | ||
| Republican hold | ||||
References
- Geography, US Census Bureau. "Congressional Districts Relationship Files (state-based)". www.census.gov. Archived from the original on 17 July 2017. Retrieved 9 April 2018.
- Bureau, Center for New Media & Promotion (CNMP), US Census. "My Congressional District". www.census.gov. Retrieved 9 April 2018.
- Center for New Media & Promotion (CNMP), US Census Bureau. "My Congressional District". www.census.gov.
- "Partisan Voting Index – Districts of the 115th Congress" (PDF). The Cook Political Report. April 7, 2017. Retrieved April 7, 2017.
- "Rich, poor, young, old: Congressional districts at a glance".
- "Congressional Districts – 113th Congress Demographics – Urban Rural Patterns". proximityone.com. Retrieved November 12, 2020.
- "Registration Statistics: By Congression District". Kentucky State Board of Elections. September 2013. Retrieved 2014-02-06.
- "Registration Statistics: Other Political Organizations and Groups". Kentucky State Board of Elections. September 2013. Retrieved 2014-02-06.
- "Kentucky Administrative Regulations 31KAR4:150". Kentucky Legislative Research Commission. November 2005. Retrieved 2014-02-06.
- "Register To Vote". Kentucky State Board of Elections. August 2003. Retrieved 2014-02-06.
- Martis, Kenneth C. (1989). The Historical Atlas of Political Parties in the United States Congress. New York: Macmillan Publishing Company.
- Martis, Kenneth C. (1982). The Historical Atlas of United States Congressional Districts. New York: Macmillan Publishing Company.
- Congressional Biographical Directory of the United States 1774–present