2020 United States presidential election in Kentucky
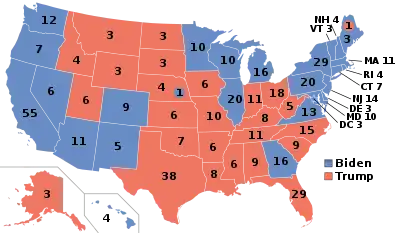
The 2020 United States presidential election in Kentucky was held on Tuesday, November 3, 2020, as part of the 2020 United States elections in which all 50 states plus the District of Columbia participated.[1] Kentucky voters chose electors supporting Donald Trump to represent them in the Electoral College via a popular vote, pitting the Republican Party's nominee, incumbent President Donald Trump, and running mate Vice President Mike Pence against Democratic Party nominee, former Vice President Joe Biden, and his running mate California Senator Kamala Harris. Kentucky has eight electoral votes in the Electoral College.[2]
| ||||||||||||||||||||||||||
| Turnout | 59.87% | |||||||||||||||||||||||||
|---|---|---|---|---|---|---|---|---|---|---|---|---|---|---|---|---|---|---|---|---|---|---|---|---|---|---|
| ||||||||||||||||||||||||||
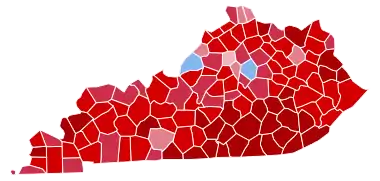 County results
| ||||||||||||||||||||||||||
| ||||||||||||||||||||||||||
.jpg.webp)
| Elections in Kentucky |
|---|
 |
|
|
Trump won Kentucky by a 25.9% margin in this election. Prior to the election, all 12 news organizations considered this a state Trump would win, or a safe red state. The Bluegrass State has not supported a Democratic nominee since 1996. Trump's overhaul of Obama-era coal emissions standards helped him win coal-industry households,[3] once again sweeping the historically-Democratic Eastern Kentucky counties. Trump also carried 83% of Caucasian evangelical/born-again Christians, per exit polls by the Associated Press.[4] In addition to Trump's victory in the Commonwealth, Biden became the first Democrat to win the presidency without winning Elliott County since the county was founded in 1869.[5] This also marks the second consecutive election in which no county in the Eastern Kentucky Coalfield voted Democratic, albeit the first time since 2008 that any of said counties experienced a Democratic swing.
Kentucky was one of sixteen states where President Trump received a smaller percentage of the vote than he did in the 2016 election.[lower-alpha 1]
Primary elections
The primary elections were originally scheduled for May 19, 2020. On March 16, they were moved to June 23 due to concerns over the COVID-19 pandemic.[6]
Republican primary
Incumbent President Donald Trump ran unopposed in the Republican primary. The state has 46 delegates to the 2020 Republican National Convention.[7]
Democratic primary
| Candidate | Votes | % | Delegates[9] |
|---|---|---|---|
| Joe Biden | 365,284 | 67.91% | 52 |
| Bernie Sanders (suspended) | 65,055 | 12.09% | |
| Uncommitted | 58,364 | 10.85% | 2 |
| Elizabeth Warren (withdrawn) | 15,300 | 2.84% | |
| Pete Buttigieg (withdrawn) | 9,127 | 1.70% | |
| Andrew Yang (withdrawn) | 7,267 | 1.35% | |
| Tulsi Gabbard (withdrawn) | 5,859 | 1.09% | |
| Amy Klobuchar (withdrawn) | 5,296 | 0.98% | |
| Tom Steyer (withdrawn) | 2,656 | 0.49% | |
| Michael Bennet (withdrawn) | 2,514 | 0.47% | |
| Deval Patrick (withdrawn) | 1,183 | 0.22% | |
| Total | 537,905 | 100% | 54 |
General election
Predictions
| Source | Ranking | As of |
|---|---|---|
| The Cook Political Report[10] | Safe R | September 10, 2020 |
| Inside Elections[11] | Safe R | September 4, 2020 |
| Sabato's Crystal Ball[12] | Safe R | July 14, 2020 |
| Politico[13] | Safe R | September 8, 2020 |
| RCP[14] | Safe R | August 3, 2020 |
| Niskanen[15] | Safe R | July 26, 2020 |
| CNN[16] | Safe R | August 3, 2020 |
| The Economist[17] | Safe R | September 2, 2020 |
| CBS News[18] | Likely R | August 16, 2020 |
| 270towin[19] | Safe R | August 2, 2020 |
| ABC News[20] | Safe R | July 31, 2020 |
| NPR[21] | Likely R | August 3, 2020 |
| NBC News[22] | Safe R | August 6, 2020 |
| 538[23] | Safe R | September 9, 2020 |
Graphical summary
Aggregate polls
| Source of poll aggregation |
Dates administered |
Dates updated |
Joe Biden Democratic |
Donald Trump Republican |
Other/ Undecided [lower-alpha 2] |
Margin |
|---|---|---|---|---|---|---|
| 270 to Win | September 20 – October 25, 2020 | October 27, 2020 | 40.0% | 57.0% | 3.0% | Trump +17.0 |
| FiveThirtyEight | until October 25, 2020 | October 27, 2020 | 39.1% | 56.7% | 4.2% | Trump +17.6 |
| Average | 39.6% | 56.9% | 3.5% | Trump +17.3 | ||
Polls
| Poll source | Date(s) administered |
Sample size[lower-alpha 3] |
Margin of error |
Donald Trump Republican |
Joe Biden Democratic |
Jo Jorgensen Libertarian |
Other | Undecided |
|---|---|---|---|---|---|---|---|---|
| SurveyMonkey/Axios | Oct 20 – Nov 2, 2020 | 2,009 (LV) | ± 3% | 59%[lower-alpha 4] | 40% | - | – | – |
| Swayable | Oct 23 – Nov 1, 2020 | 383 (LV) | ± 7.4% | 55% | 42% | 4% | – | – |
| Bluegrass Community & Technical College | Oct 12–28, 2020 | 250 (RV) | – | 52% | 39% | – | – | 9% |
| SurveyMonkey/Axios | Oct 1–28, 2020 | 3,621 (LV) | – | 56% | 42% | – | – | – |
| Mason-Dixon | Oct 12–15, 2020 | 625 (LV) | ± 4% | 56% | 39% | - | 1% | 4% |
| SurveyMonkey/Axios | Sep 1–30, 2020 | 1,479 (LV) | – | 59% | 39% | - | – | 1% |
| Data for Progress (D) | Sep 14–19, 2020 | 807 (LV) | ± 3.5% | 55%[lower-alpha 5] | 35% | 1% | 1%[lower-alpha 6] | 8% |
| 56%[lower-alpha 7] | 38% | - | – | 6% | ||||
| Quinnipiac University | Sep 10–14, 2020 | 1,164 (LV) | ± 2.9% | 58% | 38% | - | 1%[lower-alpha 8] | 4% |
| SurveyMonkey/Axios | Aug 1–31, 2020 | 1,231 (LV) | – | 60% | 38% | - | – | 2% |
| Quinnipiac University | Jul 30 – Aug 3, 2020 | 909 (RV) | ± 3.3% | 50% | 41% | - | 4%[lower-alpha 9] | 5% |
| Morning Consult | Jul 24 – Aug 2, 2020 | 793 (LV) | ± 3.0% | 59% | 35% | - | 2%[lower-alpha 10] | 4% |
| SurveyMonkey/Axios | Jul 1–31, 2020 | 1,709 (LV) | – | 62% | 37% | - | – | 1% |
| Bluegrass Data/Ditch Mitch Fund[upper-alpha 1] | Jul 25–29, 2020 | 3,020 (RV) | ± 2.0% | 52% | 45% | - | – | – |
| Spry Strategies/American Principles Project[upper-alpha 2] | Jul 11–16, 2020 | 600 (LV) | ± 3.7% | 60% | 34% | - | – | 6% |
| Garin-Hart-Yang/Amy McGrath[upper-alpha 3] | Jul 7–12, 2020 | 800 (LV) | ± 3.5% | 53% | 41% | - | – | – |
| SurveyMonkey/Axios | Jun 8–30, 2020 | 596 (LV) | – | 60% | 38% | - | – | 2% |
| Garin-Hart-Yang/Amy McGrath[upper-alpha 3] | Jun 2020 | – (V)[lower-alpha 11] | – | 54% | 39% | - | – | – |
| Civiqs/Data for Progress | Jun 13–15, 2020 | 898 (RV) | ± 3.8% | 57% | 37% | - | 5%[lower-alpha 12] | 1% |
| Garin-Hart-Yang/Amy McGrath[upper-alpha 3] | May 2020 | – (V)[lower-alpha 13] | – | 57% | 36% | - | – | – |
| RMG Research/U.S. Term Limits[upper-alpha 4] | May 21–24, 2020 | 500 (RV) | ± 4.5% | 53% | 36% | - | 6%[lower-alpha 14] | 5% |
| Public Policy Polling | May 14–15, 2020 | 1,104 (V) | – | 55% | 39% | - | 5%[lower-alpha 15] | 2% |
| Bluegrass Data/Ditch Mitch Fund[upper-alpha 5] | Apr 7–12, 2020[lower-alpha 16] | 4,000 (RV) | – | 55% | 34% | - | – | – |
| Fabrizio Ward/AARP | Jul 29–31, 2019 | 600 (LV) | ± 4.0% | 53% | 41% | - | – | 4% |
| Gravis Marketing | Jun 11–12, 2019 | 741 (LV) | ± 3.6% | 57% | 37% | - | – | 6% |
Former candidates | |||||||||||||||||||||||||||||||||||||||||||||||||
|---|---|---|---|---|---|---|---|---|---|---|---|---|---|---|---|---|---|---|---|---|---|---|---|---|---|---|---|---|---|---|---|---|---|---|---|---|---|---|---|---|---|---|---|---|---|---|---|---|---|
|
Donald Trump vs. Pete Buttigieg
Donald Trump vs. Bernie Sanders
Donald Trump vs. Elizabeth Warren
|
Statewide results
| Party | Candidate | Votes | % | ±% | |
|---|---|---|---|---|---|
| Republican | Donald Trump Mike Pence |
1,326,646 | 62.09% | -0.43% | |
| Democratic | Joe Biden Kamala Harris |
772,474 | 36.15% | +3.47% | |
| Libertarian | Jo Jorgensen Spike Cohen |
26,234 | 1.23% | -1.56% | |
| Independent | Kanye West Michelle Tidball |
6,483 | 0.30% | N/A | |
| Independent | Brock Pierce Karla Ballard |
3,599 | 0.17% | N/A | |
| Green | Howie Hawkins (write-in) Angela Walker (write-in) |
716 | 0.03% | N/A | |
| American Solidarity | Brian T. Carroll (write-in) Amar Patel (write-in) |
408 | 0.02% | N/A | |
| Socialism and Liberation | Gloria La Riva (write-in) Sunil Freeman (write-in) |
98 | <0.01% | N/A | |
| Independent | Mark Charles (write-in) Adriane Wallace (write-in) |
43 | <0.01% | N/A | |
| Independent | Jade Simmons (write-in) Claudeliah Roze (write-in) |
29 | <0.01% | N/A | |
| Independent | Tom Hoefling (write-in) Andy Prior (write-in) |
20 | <0.01% | N/A | |
| Independent | Shawn Howard (write-in) Alyssa Howard (write-in) |
9 | <0.01% | N/A | |
| Independent | President Boddie (write-in) Eric Stoneham (write-in) |
7 | <0.01% | N/A | |
| Independent | Kasey Wells (write-in) Rachel Wells (write-in) |
1 | <0.01% | N/A | |
| Independent | Timothy Stevens (write-in) Susan Fletcher (write-in) |
1 | <0.01% | N/A | |
| Independent | Mary Simmons (write-in) Sherri Dow (write-in) |
0 | 0.00% | N/A | |
| Total votes | 2,136,768 | 100% | |||
Results by county
| Trump/Pence Republican |
Biden/Harris Democratic |
Jorgensen/Cohen Libertarian |
West/Tidball Independent |
Pierce/Ballard Independent |
Write-ins | Total | |||||||
|---|---|---|---|---|---|---|---|---|---|---|---|---|---|
| County | Votes | % | Votes | % | Votes | % | Votes | % | Votes | % | Votes | % | Votes |
| Adair | 7,276 | 82.98% | 1,392 | 15.88% | 60 | 0.68% | 25 | 0.29% | 10 | 0.11% | 5 | 0.06% | 8,768 |
| Allen | 7,587 | 81.02% | 1,642 | 17.54% | 99 | 1.06% | 22 | 0.23% | 14 | 0.15% | 0 | 0.00% | 9,364 |
| Anderson | 9,661 | 72.89% | 3,348 | 25.26% | 184 | 1.39% | 34 | 0.26% | 19 | 0.14% | 8 | 0.06% | 13,254 |
| Ballard | 3,356 | 79.43% | 825 | 19.53% | 32 | 0.76% | 10 | 0.24% | 2 | 0.05% | 0 | 0.00% | 4,225 |
| Barren | 14,654 | 73.04% | 5,127 | 25.55% | 201 | 1.00% | 52 | 0.26% | 21 | 0.10% | 9 | 0.04% | 20,064 |
| Bath | 3,986 | 70.84% | 1,573 | 27.95% | 44 | 0.78% | 12 | 0.21% | 12 | 0.21% | 0 | 0.00% | 5,627 |
| Bell | 8,140 | 81.04% | 1,789 | 17.81% | 78 | 0.78% | 30 | 0.30% | 7 | 0.07% | 0 | 0.00% | 10,044 |
| Boone | 44,814 | 66.89% | 20,901 | 31.20% | 981 | 1.46% | 171 | 0.26% | 93 | 0.14% | 38 | 0.06% | 66,998 |
| Bourbon | 6,190 | 64.16% | 3,296 | 34.16% | 106 | 1.10% | 31 | 0.32% | 20 | 0.21% | 5 | 0.05% | 9,648 |
| Boyd | 14,295 | 65.72% | 7,083 | 32.56% | 287 | 1.32% | 55 | 0.25% | 21 | 0.10% | 10 | 0.05% | 21,751 |
| Boyle | 8,872 | 61.28% | 5,298 | 36.59% | 210 | 1.45% | 63 | 0.44% | 24 | 0.17% | 11 | 0.08% | 14,478 |
| Bracken | 3,398 | 80.03% | 800 | 18.84% | 27 | 0.64% | 11 | 0.26% | 8 | 0.19% | 2 | 0.05% | 4,246 |
| Breathitt | 4,265 | 75.34% | 1,301 | 22.98% | 52 | 0.92% | 31 | 0.55% | 12 | 0.21% | 0 | 0.00% | 5,661 |
| Breckinridge | 7,701 | 75.49% | 2,350 | 23.04% | 103 | 1.01% | 24 | 0.24% | 19 | 0.19% | 4 | 0.04% | 10,201 |
| Bullitt | 30,708 | 73.12% | 10,552 | 25.13% | 563 | 1.34% | 87 | 0.21% | 55 | 0.13% | 33 | 0.08% | 41,998 |
| Butler | 4,960 | 80.98% | 1,079 | 17.62% | 63 | 1.03% | 8 | 0.13% | 12 | 0.20% | 3 | 0.05% | 6,125 |
| Caldwell | 4,906 | 76.25% | 1,433 | 22.27% | 58 | 0.90% | 22 | 0.34% | 9 | 0.14% | 6 | 0.09% | 6,434 |
| Calloway | 11,352 | 65.03% | 5,797 | 33.21% | 227 | 1.30% | 44 | 0.25% | 27 | 0.15% | 10 | 0.06% | 17,457 |
| Campbell | 28,482 | 58.27% | 19,374 | 39.64% | 763 | 1.56% | 133 | 0.27% | 82 | 0.17% | 44 | 0.09% | 48,878 |
| Carlisle | 2,159 | 81.84% | 463 | 17.55% | 15 | 0.57% | 1 | 0.04% | 0 | 0.00% | 0 | 0.00% | 2,638 |
| Carroll | 2,954 | 71.42% | 1,116 | 26.98% | 44 | 1.06% | 13 | 0.31% | 8 | 0.19% | 1 | 0.02% | 4,136 |
| Carter | 8,775 | 75.74% | 2,642 | 22.80% | 107 | 0.92% | 45 | 0.39% | 16 | 0.14% | 1 | 0.01% | 11,586 |
| Casey | 6,179 | 86.17% | 918 | 12.80% | 53 | 0.74% | 12 | 0.17% | 9 | 0.13% | 0 | 0.00% | 7,171 |
| Christian | 15,080 | 63.19% | 8,296 | 34.77% | 348 | 1.46% | 95 | 0.40% | 44 | 0.18% | 0 | 0.00% | 23,863 |
| Clark | 11,811 | 65.11% | 6,004 | 33.10% | 226 | 1.25% | 53 | 0.29% | 34 | 0.19% | 11 | 0.06% | 18,139 |
| Clay | 6,677 | 87.96% | 831 | 10.95% | 40 | 0.01% | 23 | 0.01% | 9 | 0.01% | 1 | 0.01% | 7,591 |
| Clinton | 4,280 | 86.78% | 603 | 12.23% | 30 | 0.61% | 10 | 0.20% | 9 | 0.18% | 0 | 0.00% | 4,932 |
| Crittenden | 3,451 | 81.35% | 731 | 17.23% | 47 | 1.11% | 7 | 0.17% | 6 | 0.14% | 0 | 0.00% | 4,242 |
| Cumberland | 2,769 | 83.68% | 508 | 15.35% | 21 | 0.63% | 7 | 0.21% | 4 | 0.12% | 0 | 0.00% | 3,309 |
| Daviess | 31,025 | 62.95% | 17,286 | 35.07% | 670 | 1.36% | 168 | 0.34% | 96 | 0.19% | 42 | 0.09% | 49,287 |
| Edmonson | 4,828 | 78.73% | 1,227 | 20.01% | 60 | 0.98% | 10 | 0.16% | 6 | 0.10% | 1 | 0.02% | 6,132 |
| Elliott | 2,246 | 74.99% | 712 | 23.77% | 18 | 0.60% | 9 | 0.30% | 10 | 0.33% | 0 | 0.00% | 2,995 |
| Estill | 5,100 | 77.98% | 1,355 | 20.72% | 64 | 0.98% | 16 | 0.24% | 3 | 0.05% | 2 | 0.03% | 6,540 |
| Fayette | 58,860 | 38.50% | 90,600 | 59.25% | 2,383 | 1.56% | 562 | 0.37% | 309 | 0.20% | 188 | 0.12% | 152,902 |
| Fleming | 5,534 | 78.30% | 1,474 | 20.85% | 37 | 0.52% | 16 | 0.23% | 5 | 0.07% | 2 | 0.03% | 7,068 |
| Floyd | 12,250 | 74.91% | 3,884 | 23.75% | 111 | 0.68% | 69 | 0.42% | 37 | 0.23% | 2 | 0.01% | 16,353 |
| Franklin | 12,900 | 49.48% | 12,652 | 48.53% | 365 | 1.40% | 89 | 0.34% | 55 | 0.21% | 11 | 0.04% | 26,072 |
| Fulton | 1,606 | 66.20% | 794 | 32.73% | 18 | 0.74% | 2 | 0.08% | 5 | 0.21% | 1 | 0.04% | 2,426 |
| Gallatin | 2,955 | 76.77% | 822 | 21.36% | 58 | 1.51% | 3 | 0.08% | 11 | 0.29% | 0 | 0.00% | 3,849 |
| Garrard | 6,754 | 77.58% | 1,830 | 21.02% | 86 | 0.99% | 25 | 0.29% | 8 | 0.09% | 3 | 0.03% | 8,706 |
| Grant | 8,725 | 78.55% | 2,205 | 19.85% | 139 | 1.25% | 20 | 0.18% | 17 | 0.15% | 2 | 0.02% | 11,108 |
| Graves | 13,206 | 77.60% | 3,560 | 20.92% | 187 | 1.10% | 36 | 0.21% | 30 | 0.18% | 0 | 0.00% | 17,019 |
| Grayson | 9,453 | 78.87% | 2,400 | 20.03% | 85 | 0.71% | 33 | 0.28% | 12 | 0.10% | 2 | 0.02% | 11,985 |
| Green | 4,838 | 83.24% | 920 | 15.83% | 29 | 0.50% | 18 | 0.31% | 7 | 0.12% | 0 | 0.00% | 5,812 |
| Greenup | 13,064 | 71.88% | 4,873 | 26.81% | 178 | 0.98% | 28 | 0.15% | 33 | 0.18% | 0 | 0.00% | 18,176 |
| Hancock | 3,145 | 68.56% | 1,351 | 29.45% | 67 | 1.46% | 14 | 0.31% | 10 | 0.22% | 0 | 0.00% | 4,587 |
| Hardin | 29,832 | 60.96% | 18,101 | 36.99% | 753 | 1.54% | 151 | 0.31% | 104 | 0.21% | 0 | 0.00% | 48,941 |
| Harlan | 9,367 | 85.38% | 1,494 | 13.62% | 81 | 0.74% | 16 | 0.15% | 13 | 0.12% | 0 | 0.00% | 10,971 |
| Harrison | 6,334 | 71.50% | 2,400 | 27.09% | 85 | 0.96% | 14 | 0.16% | 20 | 0.23% | 6 | 0.07% | 8,859 |
| Hart | 6,345 | 75.82% | 1,908 | 22.80% | 76 | 0.91% | 22 | 0.26% | 18 | 0.22% | 0 | 0.00% | 8,369 |
| Henderson | 12,730 | 61.51% | 7,639 | 36.91% | 244 | 1.18% | 50 | 0.24% | 25 | 0.12% | 9 | 0.04% | 20,697 |
| Henry | 5,843 | 72.05% | 2,142 | 26.41% | 86 | 1.06% | 19 | 0.23% | 17 | 0.21% | 3 | 0.04% | 8,110 |
| Hickman | 1,714 | 77.94% | 458 | 20.83% | 21 | 0.95% | 2 | 0.09% | 4 | 0.18% | 0 | 0.00% | 2,199 |
| Hopkins | 15,757 | 73.25% | 5,439 | 25.28% | 226 | 1.05% | 63 | 0.29% | 24 | 0.11% | 3 | 0.01% | 21,512 |
| Jackson | 5,453 | 89.20% | 605 | 9.90% | 33 | 0.54% | 15 | 0.25% | 7 | 0.11% | 0 | 0.00% | 6,113 |
| Jefferson | 150,646 | 38.96% | 228,358 | 59.06% | 4,782 | 1.24% | 1,660 | 0.43% | 749 | 0.19% | 434 | 0.11% | 386,629 |
| Jessamine | 17,096 | 65.05% | 8,567 | 32.60% | 447 | 1.70% | 92 | 0.35% | 49 | 0.19% | 29 | 0.11% | 26,280 |
| Johnson | 8,450 | 82.91% | 1,608 | 15.78% | 77 | 0.76% | 31 | 0.30% | 26 | 0.26% | 0 | 0.00% | 10,192 |
| Kenton | 48,129 | 58.55% | 32,271 | 39.26% | 1,360 | 1.65% | 225 | 0.27% | 135 | 0.16% | 78 | 0.09% | 82,198 |
| Knott | 4,780 | 76.46% | 1,412 | 22.58% | 28 | 0.45% | 15 | 0.24% | 17 | 0.27% | 0 | 0.00% | 6,252 |
| Knox | 11,012 | 82.97% | 2,114 | 15.93% | 109 | 0.82% | 32 | 0.24% | 6 | 0.05% | 0 | 0.00% | 13,273 |
| Larue | 5,685 | 77.87% | 1,504 | 20.60% | 86 | 1.18% | 19 | 0.26% | 7 | 0.10% | 0 | 0.00% | 7,301 |
| Laurel | 23,237 | 82.66% | 4,475 | 15.92% | 282 | 1.00% | 55 | 0.20% | 52 | 0.18% | 10 | 0.04% | 28,111 |
| Lawrence | 5,633 | 80.99% | 1,238 | 17.80% | 50 | 0.72% | 20 | 0.29% | 14 | 0.20% | 0 | 0.00% | 6,955 |
| Lee | 2,273 | 81.15% | 481 | 17.17% | 28 | 1.00% | 7 | 0.25% | 12 | 0.43% | 0 | 0.00% | 2,801 |
| Leslie | 4,321 | 89.78% | 446 | 9.27% | 23 | 0.48% | 12 | 0.25% | 9 | 0.19% | 2 | 0.04% | 4,813 |
| Letcher | 7,226 | 79.10% | 1,799 | 19.69% | 69 | 0.76% | 28 | 0.31% | 13 | 0.14% | 0 | 0.00% | 9,135 |
| Lewis | 4,986 | 84.75% | 823 | 13.99% | 61 | 1.04% | 6 | 0.10% | 7 | 0.12% | 0 | 0.00% | 5,883 |
| Lincoln | 8,489 | 77.78% | 2,254 | 20.65% | 129 | 1.18% | 23 | 0.21% | 18 | 0.16% | 1 | 0.01% | 10,914 |
| Livingston | 4,010 | 80.14% | 939 | 18.76% | 44 | 0.88% | 6 | 0.12% | 4 | 0.08% | 1 | 0.02% | 5,004 |
| Logan | 9,067 | 73.42% | 3,094 | 25.05% | 145 | 1.17% | 22 | 0.18% | 18 | 0.15% | 4 | 0.03% | 12,350 |
| Lyon | 3,100 | 73.32% | 1,092 | 25.83% | 25 | 0.59% | 7 | 0.17% | 4 | 0.09% | 0 | 0.00% | 4,228 |
| Madison | 27,356 | 62.23% | 15,581 | 35.45% | 730 | 1.66% | 140 | 0.32% | 104 | 0.24% | 45 | 0.10% | 43,956 |
| Magoffin | 4,174 | 76.63% | 1,214 | 22.29% | 40 | 0.73% | 10 | 0.18% | 9 | 0.17% | 0 | 0.00% | 5,447 |
| Marion | 6,113 | 68.47% | 2,722 | 30.49% | 55 | 0.62% | 24 | 0.27% | 14 | 0.16% | 0 | 0.00% | 8,928 |
| Marshall | 13,297 | 75.54% | 4,071 | 23.13% | 165 | 0.94% | 44 | 0.25% | 24 | 0.14% | 2 | 0.01% | 17,603 |
| Martin | 3,496 | 88.96% | 403 | 10.25% | 17 | 0.43% | 8 | 0.20% | 6 | 0.15% | 0 | 0.00% | 3,930 |
| Mason | 5,477 | 68.82% | 2,362 | 29.68% | 85 | 1.07% | 19 | 0.24% | 15 | 0.19% | 0 | 0.00% | 7,958 |
| McCracken | 21,820 | 65.04% | 11,195 | 33.37% | 376 | 1.12% | 92 | 0.27% | 43 | 0.13% | 23 | 0.07% | 33,549 |
| McCreary | 5,664 | 87.98% | 725 | 11.26% | 34 | 0.53% | 8 | 0.12% | 4 | 0.06% | 3 | 0.05% | 6,438 |
| McLean | 3,633 | 75.97% | 1,074 | 22.46% | 56 | 1.17% | 11 | 0.23% | 8 | 0.17% | 0 | 0.00% | 4,782 |
| Meade | 10,185 | 72.17% | 3,632 | 25.74% | 235 | 1.67% | 33 | 0.23% | 26 | 0.18% | 2 | 0.01% | 14,113 |
| Menifee | 2,311 | 74.50% | 750 | 24.18% | 24 | 0.77% | 12 | 0.39% | 5 | 0.16% | 0 | 0.00% | 3,102 |
| Mercer | 8,506 | 72.48% | 3,033 | 25.85% | 140 | 1.19% | 40 | 0.34% | 16 | 0.14% | 0 | 0.00% | 11,735 |
| Metcalfe | 3,959 | 78.99% | 975 | 19.45% | 56 | 1.12% | 12 | 0.24% | 10 | 0.20% | 0 | 0.00% | 5,012 |
| Monroe | 4,628 | 86.83% | 657 | 12.33% | 30 | 0.56% | 10 | 0.19% | 5 | 0.09% | 0 | 0.00% | 5,330 |
| Montgomery | 8,993 | 70.03% | 3,630 | 28.27% | 154 | 1.20% | 41 | 0.32% | 19 | 0.15% | 5 | 0.04% | 12,842 |
| Morgan | 4,301 | 77.58% | 1,175 | 21.19% | 27 | 0.49% | 21 | 0.38% | 18 | 0.32% | 2 | 0.04% | 5,544 |
| Muhlenberg | 10,497 | 73.76% | 3,545 | 24.91% | 134 | 0.94% | 34 | 0.24% | 17 | 0.12% | 4 | 0.03% | 14,231 |
| Nelson | 15,703 | 67.52% | 7,188 | 30.91% | 268 | 1.15% | 45 | 0.19% | 41 | 0.18% | 11 | 0.05% | 23,256 |
| Nicholas | 2,408 | 70.91% | 955 | 28.12% | 27 | 0.80% | 3 | 0.09% | 3 | 0.09% | 0 | 0.00% | 3,396 |
| Ohio | 8,582 | 77.11% | 2,404 | 21.60% | 99 | 0.89% | 29 | 0.26% | 13 | 0.12% | 2 | 0.02% | 11,129 |
| Oldham | 22,654 | 59.65% | 14,505 | 38.20% | 601 | 1.58% | 113 | 0.30% | 67 | 0.18% | 36 | 0.09% | 37,976 |
| Owen | 4,292 | 78.64% | 1,098 | 20.12% | 46 | 0.84% | 10 | 0.18% | 10 | 0.18% | 2 | 0.04% | 5,458 |
| Owsley | 1,671 | 88.13% | 216 | 11.39% | 6 | 0.32% | 3 | 0.16% | 0 | 0.00% | 0 | 0.00% | 1,896 |
| Pendleton | 5,515 | 79.64% | 1,322 | 19.09% | 56 | 0.81% | 18 | 0.26% | 14 | 0.20% | 0 | 0.00% | 6,925 |
| Perry | 8,129 | 76.50% | 2,356 | 22.17% | 100 | 0.94% | 29 | 0.27% | 12 | 0.11% | 0 | 0.00% | 10,626 |
| Pike | 20,284 | 79.87% | 4,866 | 19.16% | 154 | 0.61% | 47 | 0.19% | 26 | 0.10% | 18 | 0.07% | 25,395 |
| Powell | 4,041 | 73.41% | 1,367 | 24.83% | 67 | 1.22% | 16 | 0.29% | 14 | 0.25% | 0 | 0.00% | 5,505 |
| Pulaski | 25,442 | 80.62% | 5,666 | 17.95% | 323 | 1.02% | 78 | 0.25% | 31 | 0.10% | 17 | 0.05% | 31,557 |
| Robertson | 884 | 77.14% | 253 | 22.08% | 6 | 0.52% | 2 | 0.17% | 1 | 0.09% | 0 | 0.00% | 1,146 |
| Rockcastle | 6,577 | 84.49% | 1,134 | 14.57% | 56 | 0.72% | 13 | 0.17% | 3 | 0.04% | 1 | 0.01% | 7,784 |
| Rowan | 5,994 | 59.55% | 3,880 | 38.55% | 137 | 1.36% | 31 | 0.31% | 16 | 0.16% | 7 | 0.07% | 10,065 |
| Russell | 7,519 | 83.96% | 1,331 | 14.86% | 84 | 0.94% | 11 | 0.12% | 9 | 0.10% | 1 | 0.01% | 8,955 |
| Scott | 17,767 | 61.33% | 10,567 | 36.48% | 480 | 1.66% | 90 | 0.31% | 52 | 0.18% | 13 | 0.04% | 28,969 |
| Shelby | 15,055 | 63.93% | 8,077 | 34.30% | 302 | 1.28% | 73 | 0.31% | 38 | 0.16% | 5 | 0.02% | 23,550 |
| Simpson | 5,888 | 67.43% | 2,681 | 30.70% | 128 | 1.47% | 17 | 0.19% | 18 | 0.21% | 0 | 0.00% | 8,732 |
| Spencer | 8,737 | 76.42% | 2,530 | 22.13% | 124 | 1.08% | 21 | 0.18% | 17 | 0.15% | 4 | 0.03% | 11,433 |
| Taylor | 9,376 | 74.91% | 2,963 | 23.67% | 119 | 0.95% | 35 | 0.28% | 19 | 0.15% | 5 | 0.04% | 12,517 |
| Todd | 4,062 | 75.74% | 1,205 | 22.47% | 60 | 1.12% | 19 | 0.35% | 12 | 0.22% | 5 | 0.09% | 5,363 |
| Trigg | 5,487 | 74.39% | 1,791 | 24.28% | 75 | 1.02% | 8 | 0.11% | 14 | 0.19% | 1 | 0.01% | 7,376 |
| Trimble | 3,227 | 74.70% | 1,012 | 23.43% | 60 | 1.39% | 10 | 0.23% | 10 | 0.23% | 1 | 0.02% | 4,320 |
| Union | 4,965 | 75.49% | 1,529 | 23.25% | 67 | 1.02% | 9 | 0.14% | 6 | 0.09% | 1 | 0.02% | 6,577 |
| Warren | 31,791 | 57.38% | 22,479 | 40.58% | 823 | 1.49% | 184 | 0.33% | 77 | 0.14% | 47 | 0.08% | 55,401 |
| Washington | 4,482 | 72.00% | 1,644 | 26.41% | 72 | 1.16% | 11 | 0.18% | 14 | 0.22% | 2 | 0.03% | 6,225 |
| Wayne | 7,430 | 80.41% | 1,700 | 18.40% | 69 | 0.75% | 29 | 0.31% | 12 | 0.13% | 0 | 0.00% | 9,240 |
| Webster | 4,506 | 75.19% | 1,412 | 23.56% | 54 | 0.90% | 16 | 0.27% | 3 | 0.05% | 2 | 0.03% | 5,993 |
| Whitley | 12,567 | 81.84% | 2,552 | 16.62% | 177 | 1.15% | 34 | 0.22% | 17 | 0.11% | 9 | 0.06% | 15,356 |
| Wolfe | 2,097 | 70.39% | 839 | 28.16% | 21 | 0.70% | 9 | 0.30% | 13 | 0.44% | 0 | 0.00% | 2,979 |
| Woodford | 8,362 | 54.97% | 6,530 | 42.93% | 237 | 1.56% | 50 | 0.33% | 32 | 0.21% | 0 | 0.00% | 15,211 |
By congressional district
Trump won 5 of 6 congressional districts.[25]
| District | Trump | Biden | Representative |
|---|---|---|---|
| 1st | 73.1% | 25.5% | James Comer |
| 2nd | 67.6% | 30.6% | Brett Guthrie |
| 3rd | 38.1% | 60% | John Yarmuth |
| 4th | 64.8% | 33.4% | Thomas Massie |
| 5th | 80.2% | 18.6% | Hal Rogers |
| 6th | 53.6% | 44.5% | Andy Barr |
See also
Notes
- The other fifteen states were Alabama, Connecticut, Delaware, Georgia, Maine, Maryland, Massachusetts, Mississippi, Nebraska, New Hampshire, New Jersey, Rhode Island, Tennessee, Texas and Virginia.
- Calculated by taking the difference of 100% and all other candidates combined.
- Key:
A – all adults
RV – registered voters
LV – likely voters
V – unclear - Overlapping sample with the previous SurveyMonkey/Axios poll, but more information available regarding sample size
- Standard VI response
- Hawkins (G) with 1%
- If only Trump and Biden were candidates
- "Someone else" with 1%
- "Someone else" with 3%; would not vote with 1%
- "Someone else" with 2%
- Not yet released
- "someone else" with 5%
- Not yet released
- "Some other candidate" with 6%
- "Someone else" with 5%
- Additional data sourced from FiveThirtyEight
- Partisan clients
- This poll's sponsor supported the electoral defeat of Mitch McConnell prior to the sampling period
- This poll's sponsor is the American Principles Project, a 501(c)(4) organization that supports the Republican Party.
- Poll sponsored by Amy McGrath's campaign
- U.S. Term Limits is a PAC supporting candidates who support term limits in Congress.
- This poll's sponsor supported the electoral defeat of Mitch McConnell prior to the sampling period
References
- Kelly, Ben (August 13, 2018). "US elections key dates: When are the 2018 midterms and the 2020 presidential campaign?". The Independent. Retrieved January 3, 2019.
- "Distribution of Electoral Votes". National Archives and Records Administration. Retrieved January 3, 2019.
- Dennis, Brady; Eilperin, Juliet. "Trump administration rolls back Obama-era rule aimed at limiting toxic wastewater from coal plants". Washington Post. ISSN 0190-8286. Retrieved November 9, 2020.
- "Kentucky Voter Surveys: How Different Groups Voted". The New York Times. November 3, 2020. ISSN 0362-4331. Retrieved November 9, 2020.
- "County winners, 1836-2016". Google Docs. Retrieved November 27, 2020.
- "Kentucky secretary of state says primary postponed". CNN. March 16, 2020.
- "Kentucky Republican Delegation 2020". The Green Papers. Retrieved June 23, 2020.
- "Official 2020 PRIMARY ELECTION Results" (PDF). Commonwealth of Kentucky Secretary of State. Retrieved October 13, 2020.
- "Delegate Tracker". interactives.ap.org. Associated Press. Retrieved June 23, 2020.
- "2020 POTUS Race ratings" (PDF). The Cook Political Report. Retrieved May 21, 2019.
- "POTUS Ratings | Inside Elections". insideelections.com. Retrieved May 21, 2019.
- "Larry J. Sabato's Crystal Ball » 2020 President". crystalball.centerforpolitics.org. Retrieved May 21, 2019.
- "2020 Election Forecast". Politico. November 19, 2019.
- "Battle for White House". RCP. April 19, 2019.
- 2020 Bitecofer Model Electoral College Predictions, Niskanen Center, March 24, 2020, retrieved: April 19, 2020
- David Chalian; Terence Burlij. "Road to 270: CNN's debut Electoral College map for 2020". CNN. Retrieved June 16, 2020.
- "Forecasting the US elections". The Economist. Retrieved July 7, 2020.
- "2020 Election Battleground Tracker". CBS News. July 12, 2020. Retrieved July 13, 2020.
- "2020 Presidential Election Interactive Map". 270 to Win.
- "ABC News Race Ratings". CBS News. July 24, 2020. Retrieved July 24, 2020.
- "2020 Electoral Map Ratings: Trump Slides, Biden Advantage Expands Over 270 Votes". NPR.org. Retrieved August 3, 2020.
- "Biden dominates the electoral map, but here's how the race could tighten". NBC News. Retrieved August 6, 2020.
- "2020 Election Forecast". FiveThirtyEight. Retrieved August 14, 2020.
- "November 3, 2020 Official 2020 General Election Results" (PDF). p. 6. Retrieved November 20, 2020.
- Nir, David (November 19, 2020). "Daily Kos Elections' presidential results by congressional district for 2020, 2016, and 2012". Daily Kos. Retrieved December 10, 2020.
Further reading
- Summary: State Laws on Presidential Electors (PDF), Washington DC: National Association of Secretaries of State, August 2020,
Kentucky
External links
- Government Documents Round Table of the American Library Association, "Kentucky", Voting & Elections Toolkits
- "Kentucky: Election Tools, Deadlines, Dates, Rules, and Links", Vote.org, Oakland, CA
- "League of Women Voters of Kentucky". (State affiliate of the U.S. League of Women Voters)
- Kentucky at Ballotpedia