Fayette County, Kentucky
Fayette County is located in the central part of the U.S. state of Kentucky. As of the 2010 census, the population was 295,803,[1] making it the second-most populous county in the commonwealth. Its territory, population and government are coextensive with the city of Lexington, which also serves as the county seat.[2]
Fayette County | |
|---|---|
| Lexington-Fayette Urban County | |
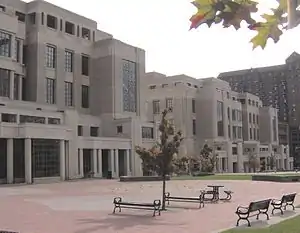 Robert F. Stephens Courthouse Complex in Lexington | |
 Seal | |
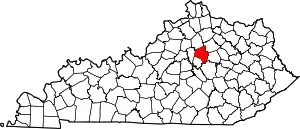 Location within the U.S. state of Kentucky | |
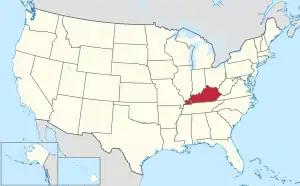 Kentucky's location within the U.S. | |
| Coordinates: 38°02′N 84°28′W | |
| Country | |
| State | |
| Founded | 1780 |
| Named for | Gilbert du Motier, Marquis de Lafayette |
| Seat | Lexington |
| Largest city | Lexington |
| Area | |
| • Total | 286 sq mi (740 km2) |
| • Land | 284 sq mi (740 km2) |
| • Water | 1.9 sq mi (5 km2) 0.7%% |
| Population | |
| • Estimate (2019) | 323,152 |
| • Density | 1,087/sq mi (420/km2) |
| Time zone | UTC−5 (Eastern) |
| • Summer (DST) | UTC−4 (EDT) |
| Congressional district | 6th |
| Website | www |
Fayette County is part of the Lexington–Fayette, KY Metropolitan Statistical Area.
History

Fayette County—originally Fayette County, Virginia—was established by the Virginia General Assembly in June 1780, when it abolished and subdivided Kentucky County into three counties: Fayette, Jefferson and Lincoln. Together, these counties and those set off from them later in that decade separated from Virginia in 1792 to become the Commonwealth of Kentucky.
Originally, Fayette County included land which makes up 37 present-day counties and parts of 7 others. It was reduced to its present boundaries in 1799. The county is named for the Marquis de LaFayette, who came to America to support the rebelling English colonies in the American Revolutionary War.[3][4]
On January 1, 1974, Fayette County merged its government with that of its county seat of Lexington, creating a consolidated city-county governed by the Lexington-Fayette Urban County Government.
Geography
According to the U.S. Census Bureau, the county has a total area of 286 square miles (740 km2), of which 284 square miles (740 km2) is land and 1.9 square miles (4.9 km2) (0.7%) is water.[5]
Major highways
- Interstate 75
- Interstate 64
- U.S. Route 25
- U.S. Route 27
- U.S. Route 60
- U.S. Route 68
- U.S. Route 421
- Kentucky Route 4, a.k.a. New Circle Road
Adjacent counties
- Scott County (north)
- Bourbon County (northeast)
- Clark County (east)
- Madison County (south)
- Jessamine County (south)
- Woodford County (west)
Demographics
| Historical population | |||
|---|---|---|---|
| Census | Pop. | %± | |
| 1790 | 18,410 | — | |
| 1800 | 14,028 | −23.8% | |
| 1810 | 21,370 | 52.3% | |
| 1820 | 23,250 | 8.8% | |
| 1830 | 25,098 | 7.9% | |
| 1840 | 22,194 | −11.6% | |
| 1850 | 22,735 | 2.4% | |
| 1860 | 22,599 | −0.6% | |
| 1870 | 26,656 | 18.0% | |
| 1880 | 29,023 | 8.9% | |
| 1890 | 35,698 | 23.0% | |
| 1900 | 42,071 | 17.9% | |
| 1910 | 47,715 | 13.4% | |
| 1920 | 54,664 | 14.6% | |
| 1930 | 68,543 | 25.4% | |
| 1940 | 78,899 | 15.1% | |
| 1950 | 100,746 | 27.7% | |
| 1960 | 131,906 | 30.9% | |
| 1970 | 174,323 | 32.2% | |
| 1980 | 204,165 | 17.1% | |
| 1990 | 225,366 | 10.4% | |
| 2000 | 260,512 | 15.6% | |
| 2010 | 295,803 | 13.5% | |
| 2019 (est.) | 323,152 | [6] | 9.2% |
| U.S. Decennial Census[7] 1790-1960[8] 1900-1990[9] 1990-2000[10] 2010-2019[1] | |||
As of the census[11] of 2010, there were 295,803 people, 123,043 households, and 69,661 families residing in the county. The population density was 1,034 people per square mile (399/km2). There were 135,160 housing units at an average density of 473 per square mile (182/km2). The racial makeup of the county was 75.7% White, 14.5% Black or African American, 0.3% Native American, 3.2% Asian, 0.1% Pacific Islander, 3.7% from other races, and 2.5% from two or more races. 6.9% of the population were Hispanic or Latino of any race.
There were 123,043 households, out of which 25.7% had children under the age of 18 living with them, 40.1% were married couples living together, 12.3% had a female householder with no husband present, and 43.4% were non-families. 32.7% of all households were made up of individuals, and 8.0% had someone living alone who was 65 years of age or older. The average household size was 2.3 and the average family size was 2.94.
In the county, the population was spread out, with 21.2% under the age of 18, 5.9% from 18 to 21, and 62.4% from 21 to 65. 10.5% were 65 years of age or older. The median age was 33.7 years. 50.8% of the population was female.
The median income for a household in the county was $47,469, and the median income for a family was $66,690. Males had a median income of $44,343 versus $35,716 for females. The per capita income for the county was $28,345. About 11.1% of families and 17.4% of the population were below the poverty line, including 21.6% of those under age 18 and 8.6% of those age 65 or over.
Education
Public high schools
Schools in the county are operated by Fayette County Public Schools.
Private middle and elementary schools
Private high schools
Colleges and universities
- Bluegrass Community and Technical College
- Indiana Wesleyan University (Lexington campus)
- ITT Technical Institute
- Lexington Theological Seminary
- Midway College (Lexington campus)[12]
- National College of Business & Technology
- Spencerian College
- Sullivan University
- Transylvania University
- University of Kentucky
Politics
Unlike almost all of the rest of Kentucky, Fayette County has trended towards the Democratic Party in recent years. Between 1952 and 2004, it voted for the Republican nominee all but twice, for Lyndon B. Johnson in 1964 and Bill Clinton in 1996. However, since 1996, it has seen close results for the two parties. In 2008, Barack Obama became the first Democrat to win the county since Bill Clinton in 1996, and the first to Democrat to win a majority of its votes since LBJ. In 2016, Hillary Clinton won the county by the biggest margin since LBJ, although it was one of only two counties in the entire Commonwealth to vote for her, the other being Jefferson County, home to the city of Louisville. In 2020, Joe Biden turned in the strongest showing for a Democrat in the county in over a century, bettering even Franklin D. Roosevelt, who never garnered more than 56 percent. In that year, Fayette County was the most Democratic county in the Commonwealth, giving Biden a slightly larger margin than Jefferson County.
| Year | Republican | Democratic | Third parties |
|---|---|---|---|
| 2020 | 38.5% 58,860 | 59.2% 90,600 | 2.3% 3,452 |
| 2016 | 41.7% 56,894 | 51.2% 69,778 | 7.1% 9,643 |
| 2012 | 48.3% 60,795 | 49.3% 62,080 | 2.4% 2,991 |
| 2008 | 46.9% 59,884 | 51.7% 66,042 | 1.4% 1,722 |
| 2004 | 52.9% 66,406 | 46.2% 57,994 | 0.9% 1,176 |
| 2000 | 51.7% 54,495 | 44.8% 47,277 | 3.5% 3,705 |
| 1996 | 46.3% 42,930 | 47.1% 43,632 | 6.6% 6,102 |
| 1992 | 43.9% 41,908 | 40.1% 38,306 | 16.0% 15,320 |
| 1988 | 59.0% 48,065 | 39.9% 32,554 | 1.1% 906 |
| 1984 | 63.6% 51,993 | 35.4% 28,961 | 1.0% 792 |
| 1980 | 49.2% 35,349 | 42.5% 30,511 | 8.3% 5,957 |
| 1976 | 54.1% 35,170 | 43.1% 28,012 | 2.8% 1,807 |
| 1972 | 66.5% 42,362 | 31.1% 19,828 | 2.3% 1,476 |
| 1968 | 49.5% 24,948 | 33.6% 16,902 | 16.9% 8,523 |
| 1964 | 42.4% 18,739 | 57.3% 25,317 | 0.3% 136 |
| 1960 | 60.4% 25,169 | 39.6% 16,478 | 0.0% 0 |
| 1956 | 61.4% 21,904 | 38.0% 13,547 | 0.7% 232 |
| 1952 | 54.7% 17,376 | 44.9% 14,275 | 0.4% 138 |
| 1948 | 41.9% 10,959 | 50.5% 13,202 | 7.6% 1,988 |
| 1944 | 44.1% 10,857 | 55.2% 13,567 | 0.7% 174 |
| 1940 | 44.0% 12,514 | 55.7% 15,834 | 0.3% 84 |
| 1936 | 44.1% 11,544 | 55.1% 14,428 | 0.8% 203 |
| 1932 | 42.5% 11,847 | 56.6% 15,765 | 0.9% 257 |
| 1928 | 65.1% 16,988 | 34.7% 9,065 | 0.2% 39 |
| 1924 | 52.2% 11,755 | 46.3% 10,433 | 1.5% 331 |
| 1920 | 45.7% 11,032 | 53.6% 12,926 | 0.8% 181 |
| 1916 | 46.0% 5,472 | 53.3% 6,348 | 0.8% 89 |
| 1912 | 37.8% 4,060 | 49.0% 5,268 | 13.2% 1,414 |
| 1908 | 46.7% 4,748 | 51.6% 5,247 | 1.5% 158 |
| 1904 | 42.8% 3,947 | 55.6% 5,119 | 1.5% 141 |
| 1900 | 54.7% 5,302 | 44.3% 4,293 | 0.8% 83 |
| 1896 | 55.5% 5,143 | 42.5% 3,938 | 1.9% 179 |
| 1892 | 37.1% 2,431 | 57.4% 3,753 | 5.3% 352 |
| 1888 | 48.1% 3,301 | 50.0% 3,435 | 1.7% 123 |
| 1884 | 53.1% 3,000 | 45.9% 2,593 | 0.8% 47 |
| 1880 | 53.2% 2,830 | 46.0% 2,449 | 0.7% 41 |
Communities
Cities
Unincorporated communities
- Andover
- Athens
- Clays Ferry
- Colby (partly in Clark County)
- Little Texas
- South Elkhorn
- Spears (partly in Jessamine County)
- Todds Station
Historically black hamlets
- Bracktown
- Cadentown
- Jimtown
- Smithtown
- Little Georgetown
- Pralltown
References
- "State & County QuickFacts". United States Census Bureau. Archived from the original on June 6, 2011. Retrieved August 14, 2014.
- "Find a County". National Association of Counties. Archived from the original on May 3, 2015. Retrieved 2011-06-07.
- The Register of the Kentucky State Historical Society, Volume 1. Kentucky State Historical Society. 1903. pp. 35.
- Gannett, Henry (1905). The Origin of Certain Place Names in the United States. Govt. Print. Off. pp. 124.
- "2010 Census Gazetteer Files". United States Census Bureau. August 22, 2012. Archived from the original on August 12, 2014. Retrieved August 14, 2014.
- "Population and Housing Unit Estimates". Retrieved March 26, 2020.
- "U.S. Decennial Census". United States Census Bureau. Retrieved August 14, 2014.
- "Historical Census Browser". University of Virginia Library. Retrieved August 14, 2014.
- "Population of Counties by Decennial Census: 1900 to 1990". United States Census Bureau. Retrieved August 14, 2014.
- "Census 2000 PHC-T-4. Ranking Tables for Counties: 1990 and 2000" (PDF). United States Census Bureau. Retrieved August 14, 2014.
- "U.S. Census website". United States Census Bureau. Retrieved 2018-08-17.
- "Midway College - Lexington Campus". Archived from the original on September 28, 2011. Retrieved May 13, 2011.
- Leip, David. "Dave Leip's Atlas of U.S. Presidential Elections". uselectionatlas.org. Retrieved 2018-07-01.
External links
| Wikimedia Commons has media related to Fayette County, Kentucky. |
- Kentucky State Data Center
- Lexington Area Metropolitan Planning Organization
- Lexington-Fayette Urban County Government
- Fayette County Prosecutor's Office
- Fayette County Sheriff's Office
| Central city | 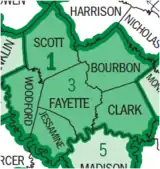 | |
|---|---|---|
| Municipalities with population over 10,000 | ||
| Municipalities with population 5,000-10,000 | ||
| Municipalities with population under 5,000 | ||
| Counties | ||

| Authority control |
|---|