L'Assomption (provincial electoral district)
L'Assomption is a provincial electoral district in the Lanaudière region of Quebec, Canada, that elects members to the National Assembly of Quebec. It includes the city of L'Assomption, and parts of the cities of Repentigny and Terrebonne, as well as a few other municipalities.
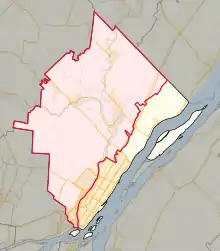 Location in L'Assomption | |||
| Provincial electoral district | |||
| Legislature | National Assembly of Quebec | ||
| MNA |
Coalition Avenir Québec | ||
| District created | 1829 | ||
| Last contested | 2018 | ||
| Demographics | |||
| Population (2011) | 67,320 | ||
| Electors (2012)[1] | 51,041 | ||
| Area (km²)[2] | 226.9 | ||
| Pop. density (per km²) | 296.7 | ||
| Census division(s) | L'Assomption (part), Les Moulins (part) | ||
| Census subdivision(s) | L'Assomption, Repentigny (part), Terrebonne (part), Charlemagne, L'Épiphanie (city), L'Épiphanie (parish) | ||
It was created for the 1867 election (and an electoral district of that name existed earlier in the Legislative Assembly of the Province of Canada and the Legislative Assembly of Lower Canada).
In the change from the 2001 to the 2011 electoral map, it lost Saint-Sulpice and part of the city of Repentigny to the newly created Repentigny electoral district, but it gained Charlemagne and a different part of the city of Repentigny from Masson; it also gained the city of L'Épiphanie and the parish of L'Épiphanie as well as the part of the city of L'Assomption that it did not already have from Rousseau; it also gained part of the city of Terrebonne from Terrebonne electoral district.
In the change from the 2011 to 2017 electoral map, it will lose all of its territory in Terrebone to the riding of Masson.
Members of the Legislative Assembly / National Assembly
Election results
| 2018 Quebec general election | ||||||||
|---|---|---|---|---|---|---|---|---|
| Party | Candidate | Votes | % | ±% | ||||
| Coalition Avenir Québec | François Legault | 18,237 | 57.03 | +7.65 | ||||
| Québec solidaire | Marie-Claude Brière | 5,425 | 16.96 | +11.16 | ||||
| Parti Québécois | Sylvie Langlois Brouillette | 4,625 | 14.46 | -15.98 | ||||
| Liberal | Virginie Bouchard | 2,558 | 8.00 | -5.34 | ||||
| Green | Eve Bellavance | 596 | 1.86 | – | ||||
| Citoyens au pouvoir | Sylvie Tougas | 363 | 1.14 | – | ||||
| Conservative | Charles-Etienne Everitt-Raynault | 175 | 0.55 | +0.1 | ||||
| Total valid votes | 31,979 | 98.23 | – | |||||
| Total rejected ballots | 575 | 1.77 | – | |||||
| Turnout | 32,554 | 71.95 | -1.42 | |||||
| Electors on the lists | 45,248 | – | – | |||||
| 2014 Quebec general election | ||||||||
|---|---|---|---|---|---|---|---|---|
| Party | Candidate | Votes | % | ±% | ||||
| Coalition Avenir Québec | François Legault | 18,719 | 49.38 | +7.17 | ||||
| Parti Québécois | Pierre Paquette | 11,541 | 30.44 | -9.12 | ||||
| Liberal | Jean-Marc Bergevin | 5,057 | 13.34 | +1.80 | ||||
| Québec solidaire | Sylvain Fournier | 2,198 | 5.80 | +2.20 | ||||
| Option nationale | Gabriel Gauthier | 226 | 0.60 | -1.04 | ||||
| Conservative | Charles-Étienne Raynault | 169 | 0.45 | – | ||||
| Total valid votes | 37,910 | 98.37 | – | |||||
| Total rejected ballots | 666 | 1.73 | – | |||||
| Turnout | 38,576 | 73.38 | -7.05 | |||||
| Electors on the lists | 52,567 | – | – | |||||
| Coalition Avenir Québec hold | Swing | +8.14 | ||||||
| 2012 Quebec general election | ||||||||
|---|---|---|---|---|---|---|---|---|
| Party | Candidate | Votes | % | ±% | ||||
| Coalition Avenir Québec | François Legault | 17,166 | 42.21 | +23.69 | ||||
| Parti Québécois | Lizabel Nitoi | 16,088 | 39.56 | -7.78 | ||||
| Liberal | Lise Hébert | 4,694 | 11.54 | -16.21 | ||||
| Québec solidaire | Sylvain Fournier | 1,465 | 3.60 | +0.54 | ||||
| Option nationale | Evelyne Marcil | 667 | 1.64 | – | ||||
| Green | Christine Lebel | 588 | 1.45 | -1.28 | ||||
| Total valid votes | 40,668 | 98.74 | – | |||||
| Total rejected ballots | 519 | 1.26 | – | |||||
| Turnout | 41,187 | 80.43 | +17.22 | |||||
| Electors on the lists | 51,210 | – | – | |||||
| Coalition Avenir Québec gain from Parti Québécois | Swing | +15.74 | ||||||
^ Change is from redistributed results. CAQ change is from ADQ.
| 2008 Quebec general election | ||||||||
|---|---|---|---|---|---|---|---|---|
| Party | Candidate | Votes | % | ±% | ||||
| Parti Québécois | Scott McKay | 15,438 | 42.77 | +8.84 | ||||
| Liberal | Christian Gauthier | 11,348 | 31.44 | +11.89 | ||||
| Action démocratique | Éric Laporte | 6,938 | 19.22 | -19.98 | ||||
| Québec solidaire | Olivier Huart | 1,090 | 3.02 | -0.07 | ||||
| Green | Chantal Latour | 940 | 2.60 | -1.62 | ||||
| Parti indépendantiste | Fanny Bérubé | 341 | 0.94 | – | ||||
| Total valid votes | 36,095 | 98.19 | – | |||||
| Total rejected ballots | 666 | 1.81 | – | |||||
| Turnout | 36,761 | 63.21 | -12.95 | |||||
| Electors on the lists | 58,156 | – | – | |||||
| 2007 Quebec general election | ||||||||
|---|---|---|---|---|---|---|---|---|
| Party | Candidate | Votes | % | ±% | ||||
| Action démocratique | Éric Laporte | 16,510 | 39.20 | +21.16 | ||||
| Parti Québécois | Jean-Claude St-André | 14,287 | 33.93 | -9.47 | ||||
| Liberal | Benoit Verstraete | 8,235 | 19.55 | -16.55 | ||||
| Green | Michel Ménard | 1,777 | 4.22 | +2.68 | ||||
| Québec solidaire | Olivier Huart | 1,303 | 3.09 | +2.18* | ||||
| Total valid votes | 42,112 | 99.02 | – | |||||
| Total rejected ballots | 415 | 0.98 | – | |||||
| Turnout | 42,527 | 76.16 | +1.00 | |||||
| Electors on the lists | 55,838 | – | – | |||||
* Result compared to UFP
| 2003 Quebec general election | ||||||||
|---|---|---|---|---|---|---|---|---|
| Party | Candidate | Votes | % | ±% | ||||
| Parti Québécois | Jean-Claude St-André | 16,965 | 43.40 | -8.10 | ||||
| Liberal | Sylvie Thouin | 14,111 | 36.10 | +10.86 | ||||
| Action démocratique | Daniel Labrecque | 7,053 | 18.04 | -3.81 | ||||
| Green | Bob Aubin | 602 | 1.54 | – | ||||
| UFP | Gilbert Morin | 356 | 0.91 | – | ||||
| Total valid votes | 39,087 | 98.61 | – | |||||
| Total rejected ballots | 551 | 1.39 | – | |||||
| Turnout | 39,638 | 75.16 | -6.63 | |||||
| Electors on the lists | 52,736 | – | – | |||||
| 1998 Quebec general election | ||||||||
|---|---|---|---|---|---|---|---|---|
| Party | Candidate | Votes | % | ±% | ||||
| Parti Québécois | Jean-Claude St-André | 21,071 | 51.50 | -3.83 | ||||
| Liberal | G. Michel Tremblay | 10,326 | 25.24 | -2.36 | ||||
| Action démocratique | Marie Grégoire | 8,941 | 21.85 | +5.61 | ||||
| Bloc Pot | Denis Therrien | 365 | 0.89 | – | ||||
| Socialist Democracy | Richard-Olivier Mayer | 214 | 0.52 | -0.31 | ||||
| Total valid votes | 40,917 | 99.04 | – | |||||
| Total rejected ballots | 397 | 0.96 | – | |||||
| Turnout | 41,314 | 81.79 | +32.82 | |||||
| Electors on the lists | 50,513 | – | – | |||||
| Quebec provincial by-election, June 10, 1996 | ||||||||
|---|---|---|---|---|---|---|---|---|
| Party | Candidate | Votes | % | ±% | ||||
| Parti Québécois | Jean-Claude St-André | 12,931 | 55.33 | -0.71 | ||||
| Liberal | Fernand Prud’homme | 6,451 | 27.60 | -0.20 | ||||
| Action démocratique | Robert Landreville | 3,795 | 16.24 | +1.02 | ||||
| Socialist Democracy | Jocelyne Dupuis | 195 | 0.83 | – | ||||
| Total valid votes | 23,372 | 98.15 | – | |||||
| Total rejected ballots | 440 | 1.85 | – | |||||
| Turnout | 23,812 | 48.97 | -36.63 | |||||
| Electors on the lists | 48,626 | – | – | |||||
| 1995 Quebec referendum | |||
|---|---|---|---|
| Side | Votes | % | |
| Oui | 29,095 | 63.65 | |
| Non | 16,614 | 36.35 | |
| 1994 Quebec general election | ||||||||
|---|---|---|---|---|---|---|---|---|
| Party | Candidate | Votes | % | ±% | ||||
| Parti Québécois | Jacques Parizeau | 21,809 | 56.04 | +0.52 | ||||
| Liberal | Luc Archambault | 10,817 | 27.80 | -12.39 | ||||
| Action démocratique | Éric Boisselle | 5,925 | 15.22 | – | ||||
| Natural Law | Lisette Proulx | 366 | 0.94 | – | ||||
| Total valid votes | 38,917 | 98.12 | – | |||||
| Total rejected ballots | 744 | 1.88 | – | |||||
| Turnout | 39,661 | 85.60 | +5.33 | |||||
| Electors on the lists | 46,334 | – | – | |||||
| 1992 Charlottetown Accord referendum | |||
|---|---|---|---|
| Side | Votes | % | |
| Non | 28,287 | 70.78 | |
| Oui | 11,677 | 29.22 | |
| 1989 Quebec general election | ||||||||
|---|---|---|---|---|---|---|---|---|
| Party | Candidate | Votes | % | ±% | ||||
| Parti Québécois | Jacques Parizeau | 18,590 | 55.52 | +14.16 | ||||
| Liberal | Jean-Guy Gervais | 13,456 | 40.19 | -1.74 | ||||
| Green | Bryan Speight | 1,439 | 4.30 | – | ||||
| Total valid votes | 33,485 | 97.76 | – | |||||
| Total rejected ballots | 766 | 2.24 | – | |||||
| Turnout | 34,251 | 80.27 | +3.21 | |||||
| Electors on the lists | 42,670 | – | – | |||||
| 1985 Quebec general election | ||||||||
|---|---|---|---|---|---|---|---|---|
| Party | Candidate | Votes | % | ±% | ||||
| Liberal | Jean-Guy Gervais | 15,627 | 41.93 | -4.78 | ||||
| Parti Québécois | Bernard Bastien | 15,411 | 41.36 | +21.42 | ||||
| Progressive Conservative | André Asselin | 5,429 | 14.57 | -17.22 | ||||
| Parti indépendantiste | Yves Senécal | 422 | 1.13 | – | ||||
| Union Nationale | Pierre-Bernard Labelle | 273 | 0.73 | – | ||||
| United Social Credit | Hervé Bélisle | 103 | 0.28 | -0.61 | ||||
| Total valid votes | 37,265 | 98.44 | – | |||||
| Total rejected ballots | 590 | 1.56 | – | |||||
| Turnout | 37,855 | 77.06 | +21.98 | |||||
| Electors on the lists | 49,127 | – | – | |||||
| Quebec provincial by-election, June 3, 1985 | ||||||||
|---|---|---|---|---|---|---|---|---|
| Party | Candidate | Votes | % | ±% | ||||
| Liberal | Jean-Guy Gervais | 12,019 | 46.71 | +13.59 | ||||
| Progressive Conservative | André Asselin | 8,180 | 31.79 | – | ||||
| Parti Québécois | Denis Taillon | 5,131 | 19.94 | -41.67 | ||||
| United Social Credit | Jean-Paul Poulin | 229 | 0.89 | – | ||||
| Republic of Canada | Jacques Lambert | 174 | 0.68 | – | ||||
| Total valid votes | 25,733 | 97.03 | – | |||||
| Total rejected ballots | 789 | 2.97 | – | |||||
| Turnout | 26,522 | 55.08 | -31.96 | |||||
| Electors on the lists | 48,148 | – | – | |||||
| 1981 Quebec general election | ||||||||
|---|---|---|---|---|---|---|---|---|
| Party | Candidate | Votes | % | ±% | ||||
| Parti Québécois | Jacques Parizeau | 22,605 | 61.61 | +7.12 | ||||
| Liberal | André Ouellette | 12,150 | 33.12 | +8.38 | ||||
| Union Nationale | Paul Marsan | 1,934 | 5.27 | -11.53 | ||||
| Total valid votes | 36,689 | 98.82 | – | |||||
| Total rejected ballots | 439 | 1.18 | – | |||||
| Turnout | 37,128 | 87.04 | -2.20 | |||||
| Electors on the lists | 42,657 | – | – | |||||
| 1980 Quebec referendum | |||
|---|---|---|---|
| Side | Votes | % | |
| Oui | 30,125 | 51.14 | |
| Non | 28,786 | 48.86 | |
References
- http://www.electionsquebec.qc.ca/english/provincial/electoral-map/general-information-on-the-provincial-electoral-divisions-2011.php?bsq=363§ion=population
- http://www.electionsquebec.qc.ca/english/provincial/electoral-map/general-information-on-the-provincial-electoral-divisions-2011.php?bsq=363§ion=superficie
External links
- Information
- Election results
- Election results (National Assembly)
- Election results (QuébecPolitique)
- Maps
- 2011 map (PDF)
- 2001 map (Flash)
- 2001–2011 changes (Flash)
- 1992–2001 changes (Flash)
- Electoral map of Lanaudière region
- Quebec electoral map, 2011
Neighbouring electoral districts | ||||||||||
|---|---|---|---|---|---|---|---|---|---|---|
| ||||||||||