List of Colombian departments by GDP
This is a list of Colombian departments by gross domestic product in 2016.
2016 GDP by Departments
| Departament | GDP % | Population 2017 |
GDP (nominal) in mil. COP |
GDP (PPP) in mil. USD |
GDP per capita (nominal) in COP |
GDP per capita (PPP) in USD |
|---|---|---|---|---|---|---|
| Antioquia | 13.9% | 6,627,200 | 119,946,000 | 95,773 | 18,354,800 | 14,656 |
| Atlántico | 4.2% | 2,517,900 | 36,211,000 | 28,913 | 14,545,400 | 11,614 |
| Bogotá | 25.7% | 8,080,700 | 221,756,000 | 177,065 | 27,789,000 | 22,189 |
| Bolívar | 4.2% | 2,146,700 | 36,003,000 | 28,747 | 16,966,900 | 13,548 |
| Boyacá | 2.9% | 1,280,000 | 25,002,000 | 19,963 | 19,561,700 | 15,619 |
| Caldas | 1.5% | 991,900 | 12,992,000 | 10,374 | 13,124,100 | 10,479 |
| Caquetá | 0.5% | 490,100 | 4,154,000 | 3,317 | 8,585,380 | 6,855 |
| Cauca | 1.8% | 1,404,200 | 15,253,000 | 12,179 | 10,958,900 | 8,750 |
| Cesar | 1.8% | 1,053,500 | 15,225,000 | 12,157 | 14,622,500 | 11,676 |
| Córdoba | 1.8% | 1,762,500 | 15,201,000 | 12,138 | 8,755,480 | 6,991 |
| Cundinamarca | 5.3% | 2,762,800 | 45,713,000 | 36,500 | 16,797,800 | 13,412 |
| Chocó | 0.4% | 495,900 | 3,692,000 | 2,945 | 7,310,660 | 5,837 |
| Huila | 1.8% | 1,182,900 | 15,441,000 | 12,329 | 13,210,200 | 10,548 |
| La Guajira | 1.0% | 1,012,900 | 8,201,000 | 6,548 | 8,322,070 | 6,645 |
| Magdalena | 1.3% | 1,285,400 | 11,150,000 | 8,903 | 8,762,680 | 6,997 |
| Meta | 3.3% | 998,200 | 28,693,000 | 22,910 | 29,287,200 | 23,385 |
| Nariño | 1.6% | 1,787,500 | 13,902,000 | 11,100 | 7,872,450 | 6,286 |
| Norte de Santander | 1.7% | 1,379,500 | 14,663,000 | 11,708 | 10,720,900 | 8,560 |
| Quindío | 0.8% | 571,700 | 6,788,000 | 5,420 | 11,940,100 | 9,534 |
| Risaralda | 1.5% | 962,500 | 13,055,000 | 10,424 | 13,638,000 | 10,889 |
| Santander | 7.7% | 2,080,900 | 66,559,000 | 53,145 | 32,138,300 | 25,661 |
| Sucre | 0.8% | 868,400 | 7,065,000 | 5,641 | 8,215,950 | 6,560 |
| Tolima | 2.2% | 1,416,100 | 18,812,000 | 15,021 | 13,320,900 | 10,636 |
| Valle del Cauca | 9.7% | 4,708,300 | 83,738,000 | 66,862 | 17,966,700 | 14,346 |
| Amazonas | 0.1% | 77,900 | 608,000 | 485 | 7,887,090 | 6,298 |
| Arauca | 0.5% | 268,000 | 4,545,000 | 3,629 | 17,138,700 | 13,685 |
| Casanare | 1.4% | 369,000 | 12,059,000 | 9,629 | 33,245,900 | 26,546 |
| Guainía | 0.0% | 42,800 | 284,000 | 228 | 6,742,160 | 5,383 |
| Guaviare | 0.1% | 114,200 | 767,000 | 612 | 6,810,450 | 5,438 |
| Putumayo | 0.4% | 354,100 | 3,161,000 | 2,524 | 9,043,390 | 7,221 |
| Archipelago of San Andrés, Providencia and Santa Catalina | 0.2% | 77,800 | 1,343,000 | 1,072 | 17,418,700 | 13,908 |
| Vaupés | 0.0% | 44,500 | 237,000 | 189 | 5,376,710 | 4,293 |
| Vichada | 0.1% | 75,500 | 456,000 | 341 | 6,187,080 | 4,940 |
| Total National | 100.0% | 49,291,500 | 862,675,000 | 688,817 | 18,102,578 | 14,138 |

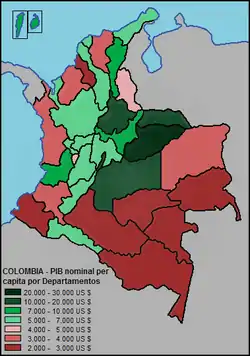
The GDP per capita by Colombian departments, in USD. (2011)
See also
References
- Source: Banco de la República[1]
- http://www.banrep.gov.co/es/info-temas-a/4024 PIB total y por habitante
- http://www.banrep.gov.co/es/poblacion
- https://stats.oecd.org/
This article is issued from Wikipedia. The text is licensed under Creative Commons - Attribution - Sharealike. Additional terms may apply for the media files.