List of Thai provinces by GPP
Regions, population, and gross provincial product (GPP) are according to Office of the National Economic and Social Development Council (NESDC).[1]
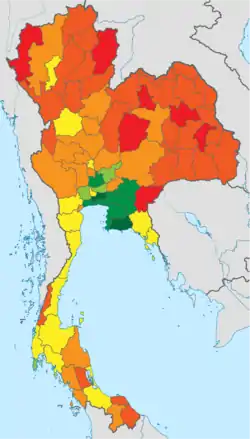
Thai provinces by GDP per capita in 2013.
National average is 6,293 US$ (15,672 I$).
National average is 6,293 US$ (15,672 I$).
< 2,000 US$ (4,981 I$)
2,000 - < 3,000 US$ (4,981 - < 7,471 I$)
3,000 - < 4,000 US$ (7,471 - < 9,961 I$)
4,000 - < 6,293 US$ (9,961 - < 15,672 I$)
6,293 - < 10,000 US$ (15,672 - < 24,903 I$)
10,000 - < 15,000 US$ (24,903 - < 37,354 I$)
> 15,000 US$ (> 37,354 I$)
Data for 2017 estimates (US$ at 2017 average market exchange rate,[2] international $ (I$) using 2017 PPP conversion factor from World Bank [3])
| ID | Province | Population
(millions) |
GPP (billions ฿) |
% of national GDP |
GPP (billions US$ nominal) |
GPP (billions I$ PPP) |
GPP per capita (฿) |
GPP per capita (US$ nominal) |
GPP per capita (I$ PPP) |
|---|---|---|---|---|---|---|---|---|---|
| 0000 | 67.654 | 15,451.96 | 100.00 | 455.27 | 1,240.03 | 228,398 | 6,729 | 18,329 | |
| 0700 | Bangkok Metropolitan Region | 15.931 | 7,167.11 | 46.38 | 211.17 | 575.16 | 449,881 | 13,255 | 36,103 |
| 0701 | Bangkok | 8.751 | 5,022.02 | 32.5 | 147.97 | 403.02 | 573,907 | 16,909 | 46,056 |
| 0702 | Samut Prakan | 2.089 | 717.05 | 4.64 | 21.13 | 57.54 | 343,215 | 10,112 | 27,543 |
| 0703 | Pathum Thani | 1.495 | 380.69 | 2.46 | 11.22 | 30.55 | 254,627 | 7,502 | 20,434 |
| 0704 | Samut Sakhon | 0.968 | 398.10 | 2.58 | 11.73 | 31.95 | 411,326 | 12,119 | 33,009 |
| 0705 | Nakhon Pathom | 1.079 | 332.63 | 2.15 | 9.80 | 26.69 | 308,167 | 9,080 | 24,730 |
| 0706 | Nonthaburi | 1.549 | 316.63 | 2.05 | 9.33 | 25.41 | 204,404 | 6,023 | 16,403 |
| 0600 | Central | 3.138 | 838.31 | 5.43 | 24.70 | 67.27 | 267,162 | 7,872 | 21,440 |
| 0601 | Saraburi | 0.715 | 236.64 | 1.53 | 6.97 | 18.99 | 330,750 | 9,745 | 26,543 |
| 0602 | Sing Buri | 0.205 | 26.50 | 0.17 | 0.78 | 2.13 | 129,095 | 3,804 | 10,360 |
| 0603 | Chainat | 0.314 | 31.85 | 0.21 | 0.94 | 2.56 | 101,282 | 2,984 | 8,128 |
| 0604 | Ang Thong | 0.259 | 27.79 | 0.18 | 0.82 | 2.23 | 107,129 | 3,156 | 8,597 |
| 0605 | Lopburi | 0.777 | 111.92 | 0.72 | 3.30 | 8.98 | 144,041 | 4,244 | 11,559 |
| 0606 | Phra Nakhon Si Ayutthaya | 0.866 | 403.60 | 2.61 | 11.89 | 32.39 | 465,972 | 13,729 | 37,394 |
| 0400 | Eastern | 5.707 | 2,857.30 | 18.49 | 84.19 | 229.30 | 500,676 | 14,752 | 40,179 |
| 0401 | Chonburi | 1.679 | 976.46 | 6.32 | 28.77 | 78.36 | 581,475 | 17,132 | 46,664 |
| 0402 | Chachoengsao | 0.798 | 341.12 | 2.21 | 10.05 | 27.37 | 427,409 | 12,593 | 34,300 |
| 0403 | Rayong | 0.899 | 984.98 | 6.37 | 29.02 | 79.05 | 1,095,667 | 32,282 | 87,928 |
| 0404 | Trat | 0.274 | 46.96 | 0.30 | 1.38 | 3.77 | 171,189 | 5,044 | 13,738 |
| 0405 | Chanthaburi | 0.544 | 138.44 | 0.90 | 4.08 | 11.11 | 254,582 | 7,501 | 20,430 |
| 0406 | Nakhon Nayok | 0.278 | 26.84 | 0.17 | 0.79 | 2.15 | 96,589 | 2,846 | 7,751 |
| 0407 | Prachinburi | 0.611 | 297.25 | 1.92 | 8.76 | 23.85 | 486,601 | 14,337 | 39,050 |
| 0408 | Sa Kaeo | 0.624 | 45.25 | 0.29 | 1.33 | 3.63 | 72,555 | 2,138 | 5,823 |
| 0100 | Northeastern | 18.619 | 1,496.07 | 9.68 | 44.08 | 120.06 | 80,352 | 2,367 | 6,448 |
| 0101 | Khon Kaen | 1.736 | 204.12 | 1.32 | 6.01 | 16.38 | 117,560 | 3,464 | 9,434 |
| 0102 | Udon Thani | 1.255 | 111.26 | 0.72 | 3.28 | 8.93 | 88,673 | 2,613 | 7,116 |
| 0103 | Loei | 0.538 | 52.67 | 0.34 | 1.55 | 4.23 | 97,903 | 2,885 | 7,857 |
| 0104 | Nong Khai | 0.445 | 40.05 | 0.26 | 1.18 | 3.21 | 89,913 | 2,649 | 7,216 |
| 0105 | Mukdahan | 0.345 | 25.80 | 0.17 | 0.76 | 2.07 | 74,729 | 2,202 | 5,997 |
| 0106 | Nakhon Phanom | 0.564 | 42.89 | 0.28 | 1.26 | 3.44 | 76,000 | 2,239 | 6,099 |
| 0107 | Sakon Nakhon | 0.808 | 55.63 | 0.36 | 1.64 | 4.46 | 68,887 | 2,030 | 5,528 |
| 0108 | Kalasin | 0.914 | 55.84 | 0.36 | 1.65 | 4.48 | 61,084 | 1,800 | 4,902 |
| 0109 | Nakhon Ratchasima | 2.492 | 274.90 | 1.78 | 8.10 | 22.06 | 110,301 | 3,250 | 8,852 |
| 0110 | Chaiyaphum | 0.954 | 60.09 | 0.39 | 1.77 | 4.82 | 63,010 | 1,857 | 5,057 |
| 0111 | Yasothon | 0.481 | 26.04 | 0.17 | 0.77 | 2.09 | 54,183 | 1,596 | 4,348 |
| 0112 | Ubon Ratchathani | 1.708 | 120.49 | 0.78 | 3.55 | 9.67 | 70,551 | 2,079 | 5,662 |
| 0113 | Roi Et | 1.069 | 73.48 | 0.48 | 2.17 | 5.90 | 68,751 | 2,026 | 5,517 |
| 0114 | Buriram | 1.247 | 84.33 | 0.55 | 2.48 | 6.77 | 67,621 | 1,992 | 5,427 |
| 0115 | Surin | 1.107 | 72.88 | 0.47 | 2.15 | 5.85 | 65,810 | 1,939 | 5,281 |
| 0116 | Maha Sarakham | 0.826 | 56.00 | 0.36 | 1.65 | 4.49 | 67,784 | 1,997 | 5,440 |
| 0117 | Sisaket | 1.033 | 69.57 | 0.45 | 2.05 | 5.58 | 67,362 | 1,985 | 5,406 |
| 0118 | Nong Bua Lamphu | 0.472 | 25.19 | 0.16 | 0.74 | 2.02 | 53,416 | 1,574 | 4,287 |
| 0119 | Amnat Charoen | 0.276 | 17.65 | 0.11 | 0.52 | 1.42 | 63,860 | 1,882 | 5,125 |
| 0120 | Bueng Kan | 0.348 | 27.17 | 0.18 | 0.80 | 2.18 | 78,022 | 2,299 | 6,261 |
| 0200 | Northern | 11.400 | 1,182.87 | 7.66 | 34.85 | 94.93 | 103,760 | 3,057 | 8,327 |
| 0201 | Chiang Mai | 1.704 | 231.73 | 1.50 | 6.83 | 18.60 | 135,991 | 4,007 | 10,913 |
| 0202 | Lampang | 0.735 | 68.20 | 0.44 | 2.01 | 5.47 | 92,749 | 2,733 | 7,443 |
| 0203 | Uttaradit | 0.433 | 38.11 | 0.25 | 1.12 | 3.06 | 87,982 | 2,592 | 7,061 |
| 0204 | Mae Hong Son | 0.199 | 13.00 | 0.08 | 0.38 | 1.04 | 65,448 | 1,928 | 5,252 |
| 0205 | Chiang Rai | 1.144 | 104.44 | 0.68 | 3.08 | 8.38 | 91,308 | 2,690 | 7,327 |
| 0206 | Phrae | 0.423 | 28.38 | 0.18 | 0.84 | 2.28 | 67,057 | 1,976 | 5,381 |
| 0207 | Lamphun | 0.406 | 77.85 | 0.50 | 2.29 | 6.25 | 191,568 | 5,644 | 15,373 |
| 0208 | Nan | 0.440 | 31.31 | 0.20 | 0.92 | 2.51 | 71,121 | 2,095 | 5,707 |
| 0209 | Phayao | 0.410 | 36.02 | 0.23 | 1.06 | 2.89 | 87,858 | 2,589 | 7,051 |
| 0210 | Nakhon Sawan | 0.975 | 107.18 | 0.69 | 3.16 | 8.60 | 109,977 | 3,240 | 8,826 |
| 0211 | Phitsanulok | 0.893 | 93.05 | 0.60 | 2.74 | 7.47 | 104,175 | 3,069 | 8,360 |
| 0212 | Kamphaeng Phet | 0.773 | 110.25 | 0.71 | 3.25 | 8.85 | 142,660 | 4,203 | 11,449 |
| 0213 | Uthai Thani | 0.292 | 28.59 | 0.19 | 0.84 | 2.29 | 97,948 | 2,886 | 7,860 |
| 0214 | Sukhothai | 0.616 | 45.15 | 0.29 | 1.33 | 3.62 | 73,251 | 2,158 | 5,878 |
| 0215 | Tak | 0.504 | 47.80 | 0.31 | 1.41 | 3.84 | 94,902 | 2,796 | 7,616 |
| 0216 | Phichit | 0.539 | 45.04 | 0.29 | 1.33 | 3.61 | 83,504 | 2,460 | 6,701 |
| 0217 | Phetchabun | 0.914 | 76.80 | 0.50 | 2.26 | 6.16 | 84,058 | 2,477 | 6,746 |
| 0300 | Southern | 9.261 | 1,371.18 | 8.87 | 40.40 | 110.04 | 148,067 | 4,363 | 11,882 |
| 0301 | Phuket | 0.538 | 209.01 | 1.35 | 6.16 | 16.77 | 388,559 | 11,448 | 31,182 |
| 0302 | Surat Thani | 1.053 | 211.05 | 1.37 | 6.22 | 16.94 | 200,471 | 5,907 | 16,088 |
| 0303 | Ranong | 0.256 | 26.77 | 0.17 | 0.79 | 2.15 | 104,517 | 3,079 | 8,388 |
| 0304 | Phang Nga | 0.270 | 71.76 | 0.46 | 2.11 | 5.76 | 265,768 | 7,831 | 21,328 |
| 0305 | Krabi | 0.375 | 89.70 | 0.58 | 2.64 | 7.20 | 239,309 | 7,051 | 19,205 |
| 0306 | Chumphon | 0.491 | 79.40 | 0.51 | 2.34 | 6.37 | 161,626 | 4,762 | 12,971 |
| 0307 | Nakhon Si Thammarat | 1.537 | 153.57 | 0.99 | 4.52 | 12.32 | 99,899 | 2,943 | 8,017 |
| 0308 | Songkhla | 1.548 | 241.84 | 1.57 | 7.13 | 19.41 | 156,245 | 4,604 | 12,539 |
| 0309 | Satun | 0.282 | 36.56 | 0.24 | 1.08 | 2.93 | 129,565 | 3,817 | 10,398 |
| 0310 | Yala | 0.448 | 43.37 | 0.28 | 1.28 | 3.48 | 96,867 | 2,854 | 7,774 |
| 0311 | Trang | 0.629 | 73.20 | 0.47 | 2.16 | 5.87 | 116,394 | 3,429 | 9,341 |
| 0312 | Narathiwat | 0.692 | 42.74 | 0.28 | 1.26 | 3.43 | 61,765 | 1,820 | 4,957 |
| 0313 | Phattalung | 0.512 | 36.48 | 0.24 | 1.07 | 2.93 | 71,298 | 2,101 | 5,722 |
| 0314 | Pattani | 0.630 | 55.74 | 0.36 | 1.64 | 4.47 | 88,442 | 2,606 | 7,098 |
| 0500 | Western | 3.598 | 539.11 | 3.49 | 15.88 | 43.26 | 149,827 | 4,414 | 12,024 |
| 0501 | Ratchaburi | 0.804 | 172.59 | 1.12 | 5.09 | 13.85 | 214,742 | 6,327 | 17,233 |
| 0502 | Kanchanaburi | 0.800 | 97.29 | 0.63 | 2.87 | 7.81 | 121,570 | 3,582 | 9,756 |
| 0503 | Prachuap Khiri Khan | 0.464 | 92.11 | 0.60 | 2.71 | 7.39 | 198,434 | 5,847 | 15,924 |
| 0504 | Phetchaburi | 0.477 | 68.49 | 0.44 | 2.02 | 5.50 | 143,460 | 4,227 | 11,513 |
| 0505 | Suphan Buri | 0.862 | 86.74 | 0.56 | 2.56 | 6.96 | 100,595 | 2,964 | 8,073 |
| 0506 | Samut Songkhram | 0.190 | 21.88 | 0.14 | 0.64 | 1.76 | 114,990 | 3,388 | 9,228 |
References
- "Gross Regional and Provincial Product, 2017 Edition". Office of the National Economic and Social Development Council (NESDC). July 2019. ISSN 1686-0799. Retrieved 22 January 2020. Cite journal requires
|journal=(help) - "Official exchange rate (LCU per US$, period average)". data.worldbank.org. Retrieved 2020-01-22.
- "World Bank Open Data: PPP conversion factor, GDP (LCU per international $)". data.worldbank.org. Retrieved 2020-01-22.
This article is issued from Wikipedia. The text is licensed under Creative Commons - Attribution - Sharealike. Additional terms may apply for the media files.