List of country subdivisions by GDP over 200 billion USD

This is a list of first-level country subdivisions which have a nominal gross state product in excess of $200 billion. There are almost 100 subdivisions that have more than $200 billion GDP. Those subdivisions which are the largest in their respective countries are shown in bold.

Nominal List

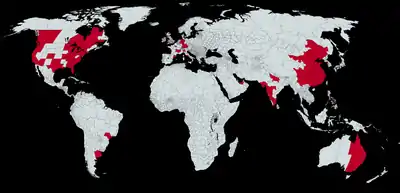
Country subdivisions by GDP over 200 billion USD
Rank Subdivision Country Continent Nominal
GDP

(billions
USD)
Year Population
(millions)
Nominal
GDP per
Capita

(thousands
USD)
Largest
city
1  California  United States North America 3,183 2019[1] 39.5 80 Los Angeles
2  Texas  United States North America 1,819 2018[1] 28.3 64 Houston
3  New York  United States North America 1,751 2019[1] 19.5 90 New York City
4 Guangdong  China Asia 1,560 2019[2] 113.5 13 Guangzhou
5 Jiangsu  China Asia 1,444 2019[2] 80.4 18 Nanjing
6  Florida  United States North America 1,059 2018[1] 20.6 50 Jacksonville
7 Shandong  China Asia 1,030 2019[2] 100.5 12 Qingdao
8  Tokyo  Japan Asia 1,000 2018[3] 13.9 72 Tokyo
9  Illinois  United States North America 909 2019[4] 12.7 72 Chicago
10 Zhejiang  China Asia 904 2019[2] 57.4 15 Hangzhou
11  Île-de-France  France Europe 866 2018[5] 12.2 70 Paris
12  Pennsylvania  United States North America 803 2018[6] 12.8 63 Philadelphia
13  North Rhine-Westphalia  Germany Europe 795 2016[7] 17.9 42 Cologne
14 Seoul Capital Area  South Korea Asia 770 2017[8] 25.5 30 Seoul
15 Henan  China Asia 726 2018[9] 95.5 8 Zhengzhou
16  Bavaria  Germany Europe 677 2016[7] 12.8 50 Munich
17  Ontario  Canada North America 662 2018[10] 14.1 45 Toronto
18  Greater London  United Kingdom Europe 650 2018[11] 8.9 73 London
19  Ohio  United States North America 649 2017[6] 11.6 56 Columbus
20 Sichuan  China Asia 615 2018[9] 82.8 7 Chengdu
21 Hubei  China Asia 595 2018[9] 58.2 10 Wuhan
22  New Jersey  United States North America 589 2016[6] 8.9 68 Newark
23  São Paulo  Brazil South America 583 2018[12] 45.5 17 São Paulo
24 Kyushu region  Japan Asia 572 2012 13.0 45 Fukuoka
25  Baden-Württemberg  Germany Europe 568 2016[7] 10.9 49 Stuttgart
26 Shanghai  China Asia 553 2019[2] 21.5 24 Shanghai
27 Hunan  China Asia 550 2018[9] 68.4 8 Changsha
28 Hebei  China Asia 544 2018[9] 73.3 7 Shijiazhuang
29 Fujian  China Asia 541 2018[9] 38.9 13 Fuzhou
30  Georgia  United States North America 533 2016[6] 10.3 49 Atlanta
31  North Carolina  United States North America 527 2016[6] 10.1 50 Charlotte
32  Massachusetts  United States North America 516 2016[6] 6.8 76 Boston
33 Beijing  China Asia 513 2019[2] 21.5 24 Beijing
34  Michigan  United States North America 505 2017[6] 10.0 50 Detroit
35  Virginia  United States North America 501 2016[6] 8.4 56 Virginia Beach
36  Washington  United States North America 477 2016[6] 7.3 62 Seattle
37  New South Wales  Australia Australia 462 2017[13] 8.0 61 Sydney
38 Anhui  China Asia 453 2018[9] 62.3 7 Hefei
39  Lombardy  Italy Europe 439 2014[14] 10.0 47 Milan
40 Maharashtra  India Asia 420 2019[15] 112.4 4 Mumbai
41  Maryland  United States North America 414 2018[6] 6.0 69 Baltimore
42 Liaoning  China Asia 383 2018[9] 43.7 9 Shenyang
43 Shaanxi  China Asia 369 2018[9] 38.3 10 Xi'an
44  Hong Kong  China Asia 373 2019[16] 7.5 49 Hong Kong
45  Victoria  Australia Australia 353 2017[13] 6.2 60 Melbourne
46  Indiana  United States North America 347 2016[6] 6.6 50 Indianapolis
47 Chongqing  China Asia 342 2019[9] 30.5 11 Chongqing
48  Minnesota  United States North America 341 2016[6] 5.5 60 Minneapolis
49  Tennessee  United States North America 334 2016[6] 6.7 47 Nashville
50 Chugoku Region  Japan Asia 333 2012[17] 7.6 46 Hiroshima
51 Jiangxi  China Asia 332 2018[9] 46.1 7 Nanchang
52  Colorado  United States North America 330 2016[6] 5.5 58 Denver
53  Hesse  Germany Europe 325 2015[7] 6.2 48 Frankfurt
54  Lower Saxony  Germany Europe 319 2015[7] 7.8 37 Hanover
55  Wisconsin  United States North America 314 2016[6] 5.8 50 Milwaukee
56  Quebec  Canada North America 313 2016[18] 8.2 37 Montreal
57  Arizona  United States North America 309 2016[6] 6.9 43 Phoenix
58 Guangxi  China Asia 308 2018[9] 48.6 6 Nanning
59  Missouri  United States North America 305 2017[6] 6.1 50 Kansas City
60  Queensland  Australia Australia 300 2017[13] 5.0 66 Brisbane
61  Connecticut  United States North America 286 2019[6] 3.6 79 Bridgeport
62  Moscow  Russia Europe 270 2017[19] 12.6 21 Moscow
63 Yunnan  China Asia 270 2018[9] 47.9 6 Kunming
64  Mexico City  Mexico North America 266 2018[20] 9.0 30 Mexico City
65 Istanbul  Turkey Europe 265 2017[21] 15.1 18 Istanbul
66  Auvergne-Rhône-Alpes  France Europe 263 2014[22] 7.7 35 Lyon
67 Inner Mongolia  China Asia 261 2018[9] 25.2 10 Baotou
68 Shanxi  China Asia 254 2018[9] 36.9 7 Taiyuan
69  Madrid  Spain Europe 250 2017[5] 6.5 38 Madrid
70  Catalonia  Spain Europe 250 2017[5] 7.5 34 Barcelona
71  Alberta  Canada North America 250 2016[18] 3.6 64 Calgary
72 Heilongjiang  China Asia 247 2017[9] 37.9 7 Harbin
73 Tamil Nadu  India Asia 245 2019[23] 72.2 3 Chennai
74 Gujarat  India Asia 242 2018[24] 63.9 4 Ahmedabad
75  Louisiana  United States North America 238 2016[6] 4.7 56 New Orleans
76  Oregon  United States North America 230 2016[6] 4.1 56 Portland
77 Jilin  China Asia 228 2018[9] 27.3 8 Changchun
78 Karnataka  India Asia 226 2019 66.2 3 Bangalore
79 Guizhou  China Asia 224 2018[9] 35.7 6 Guiyang
80 Uttar Pradesh  India Asia 222 2018[25] 228 1 Lucknow
81  Hokkaido  Japan Asia 218 2012[17][26] 5.5 42 Sapporo
82  Abu Dhabi  United Arab Emirates Asia 215 2014[27] 2.7 80 Abu Dhabi
83  Western Australia  Australia Australia 214 2017[13] 2.7 79 Perth
84  South Carolina  United States North America 213 2016[6] 5.0 40 Charleston
85  British Columbia  Canada North America 210 2016[18] 4.4 50 Vancouver
86  Alabama  United States North America 208 2016[6] 4.9 43 Birmingham
87 Tianjin  China Asia 204 2019[2] 15.6 16 Tianjin
88  Kentucky  United States North America 202 2016[6] 4.4 42 Louisville
89  Jakarta  Indonesia Asia 201 2019[28] 10.5 19 Jakarta
90  Lazio  Italy Europe 200 2015[29] 5.9 34 Rome

PPP List

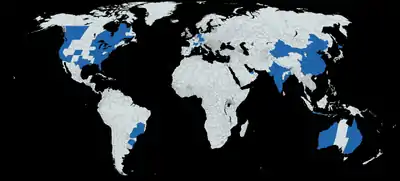
Country subdivisions by GDP PPP over 200 billion USD
Rank Subdivision Country Continent PPP
GDP

(billions
USD)
Year Population
(millions)
PPP
GDP per
Capita

(thousands
USD)
Largest
city
1  California  United States North America 3,137.5 2019[1] 39.5 80.0 Los Angeles
2 Guangdong  China Asia 2,549.3 2019[2] 113.5 22.2 Guangzhou
3 Jiangsu  China Asia 2,358.9 2019[2] 80.4 29.3 Nanjing
4  Texas  United States North America 1,886.9 2019[1] 28.3 64.0 Houston
5  New York  United States North America 1,731.9 2019[1] 19.5 90.0 New York City
6 Shandong  China Asia 1,682.6 2019[2] 100.5 16.7 Qingdao
7 Zhejiang  China Asia 1,476.3 2019[2] 57.4 25.5 Hangzhou
8 Maharashtra  India Asia 1,374.4 2019[30] 124.6 11.3 Mumbai
9 Henan  China Asia 1,284.7 2019[9] 95.5 13.4 Zhengzhou
10 Sichuan  China Asia 1,103.7 2019[9] 82.8 13.2 Chengdu
11  Florida  United States North America 1,093.4 2019[1] 20.6 50.0 Jacksonville
12 Hubei  China Asia 1,085.3 2019[9] 58.2 18.3 Wuhan
13  Tokyo  Japan Asia 1,074.3 2018[3] 13.9 77.3 Tokyo
14  Île-de-France  France Europe 1,057.2 2018[5] 12.2 85.5 Paris
15 Seoul Capital Area  South Korea Asia 1,043.1 2017[8] 25.5 40.6 Seoul
16  São Paulo  Brazil South America 1,020.5 2018[31] 44.7 22.8 São Paulo
17  North Rhine-Westphalia  Germany Europe 963.3 2016[7] 17.9 50.9 Cologne
18  Illinois  United States North America 909.0 2019[4] 12.7 72.0 Chicago
19 Shanghai  China Asia 904.5 2019[2] 21.5 39.3 Shanghai
20 Hunan  China Asia 899.6 2018[9] 68.4 13.1 Changsha
21 Hebei  China Asia 889.8 2018[9] 73.3 11.4 Shijiazhuang
22 Fujian  China Asia 884.9 2018[9] 38.9 21.3 Fuzhou
23 Tamil Nadu  India Asia 881.1 2019[30] 79.8 11.0 Chennai
24 Uttar Pradesh  India Asia 856.7 2019[30] 225.8 3.8 Lucknow
25 Beijing  China Asia 839.1 2019[2] 21.5 39.3 Beijing
26  Bavaria  Germany Europe 820.3 2016[7] 12.8 60.6 Munich
27  Pennsylvania  United States North America 803.0 2018[6] 12.8 63.0 Philadelphia
28  Greater London  United Kingdom Europe 748.5 2018[11] 8.9 84.1 London
29 Anhui  China Asia 741.0 2018[9] 62.3 11.4 Hefei
30 Karnataka  India Asia 733.1 2019[30] 67.6 10.8 Bangalore
31 Gujarat  India Asia 718.7 2019[30] 68.0 10.5 Ahmedabad
32  Ontario  Canada North America 735.8 2018[10] 14.1 50.0 Toronto
33  Baden-Württemberg  Germany Europe 688.3 2016[7] 10.9 59.4 Stuttgart
34 Istanbul  Turkey Europe 682.7 2017[21] 15.1 45.7 Istanbul
35  Moscow  Russia Europe 680.1 2017[19] 12.6 52.9 Moscow
36  Ohio  United States North America 649.0 2017[6] 11.6 56.0 Columbus
37 Liaoning  China Asia 626.5 2018[9] 43.7 14.7 Shenyang
38 Kyushu region  Japan Asia 614.5 2012 13.0 48.3 Fukuoka
39 Shaanxi  China Asia 603.6 2018[9] 38.3 16.4 Xi'an
40 West Bengal  India Asia 598.8 2019[30] 100.1 5.9 Kolkata
41  Jakarta  Indonesia Asia 597.9 2019[32] 10.5 56.5 Jakarta
42  New Jersey  United States North America 589.0 2016[6] 8.9 68.0 Newark
43  Lombardy  Italy Europe 584.6 2014[14] 10.0 62.6 Milan
44 Chongqing  China Asia 559.4 2019[9] 30.5 18.0 Chongqing
45  Mexico City  Mexico North America 550.5 2018[20] 9.0 89.2 Mexico City
46 Jiangxi  China Asia 543.0 2018[9] 46.1 11.4 Nanchang
47  Georgia  United States North America 533.0 2016[6] 10.3 49.0 Atlanta
48  North Carolina  United States North America 527.0 2016[6] 10.1 50.0 Charlotte
49  Massachusetts  United States North America 516.0 2016[6] 6.8 76.0 Boston
50  Michigan  United States North America 505.0 2017[6] 10.0 50.0 Detroit
51 Guangxi  China Asia 503.8 2018[9] 48.6 9.8 Nanning
52  Virginia  United States North America 501.0 2016[6] 8.4 56.0 Virginia Beach
53  East Java  Indonesia Asia 494.9 2019[32] 39.7 12.5 Surabaya
54 Rajasthan  India Asia 487.1 2019[30] 77.8 6.3 Jaipur
55  Washington  United States North America 477.0 2016[6] 7.3 62.0 Seattle
56  Hong Kong  China Asia 468.0 2019[16] 7.5 62.6 Hong Kong
57 Andhra Pradesh  India Asia 464.7 2019[30] 52.7 8.8 Visakhapatnam
58 Telangana  India Asia 462.1 2019[30] 38.7 11.9 Hyderabad
59  New South Wales  Australia Australia 448.6 2017[13] 8.0 59.2 Sydney
60  West Java  Indonesia Asia 447.1 2019[32] 49.3 9.1 Bandung
61 Yunnan  China Asia 441.6 2018[9] 47.9 9.8 Kunming
62 Madhya Pradesh  India Asia 433.1 2019[30] 82.1 5.3 Indore
63 Inner Mongolia  China Asia 426.9 2018[9] 25.2 16.4 Baotou
64 Shanxi  China Asia 415.5 2018[9] 36.9 11.4 Taiyuan
65  Maryland  United States North America 414.0 2018[6] 6.0 69.0 Baltimore
66 Delhi  India Asia 408.8 2019[30] 19.1 21.4 New Delhi
67 Haryana  India Asia 396.8 2019[30] 28.6 13.9 Faridabad
68  Hesse  Germany Europe 393.8 2015[7] 6.2 58.2 Frankfurt
69  Lower Saxony  Germany Europe 386.5 2015[7] 7.8 44.8 Hanover
70 Kerala  India Asia 372.2 2019[30] 34.9 10.6 Thiruvananthapuram
71 Guizhou  China Asia 366.4 2018[9] 35.7 9.8 Guiyang
72 Chugoku Region  Japan Asia 357.7 2012[17] 7.6 49.4 Hiroshima
73  Madrid  Spain Europe 356.4 2017[5] 6.5 54.2 Madrid
74  Catalonia  Spain Europe 356.4 2017[5] 7.5 48.5 Barcelona
75  Abu Dhabi  United Arab Emirates Asia 348.7 2014[27] 2.7 129.7 Abu Dhabi
76  Quebec  Canada North America 347.9 2016[18] 8.2 41.1 Montreal
77  Indiana  United States North America 347.0 2016[6] 6.6 50.0 Indianapolis
78  Victoria  Australia Australia 342.8 2017[13] 6.2 58.3 Melbourne
79  Minnesota  United States North America 341.0 2016[6] 5.5 60.0 Minneapolis
80  Tennessee  United States North America 334.0 2016[6] 6.7 47.0 Nashville
81 Tianjin  China Asia 333.7 2019[2] 15.6 26.2 Tianjin
82  Colorado  United States North America 330.0 2016[6] 5.5 58.0 Denver
83 Heilongjiang  China Asia 322.3 2019[2] 37.6 8.6 Harbin
84 Xinjiang  China Asia 321.9 2019[2] 25.1 12.8 Ürümqi
85  Auvergne-Rhône-Alpes  France Europe 321.1 2014[22] 7.7 42.7 Lyon
86  Rio de Janeiro  Brazil South America 320.6 2018[31] 16.6 19.3 Rio de Janeiro
87  Wisconsin  United States North America 314.0 2016[6] 5.8 50.0 Milwaukee
88  Arizona  United States North America 309.0 2016[6] 6.9 43.0 Phoenix
89  Missouri  United States North America 305.0 2017[6] 6.1 50.0 Kansas City
90 Bihar  India Asia 292.2 2019[30] 120.1 2.4 Patna
91  Queensland  Australia Australia 291.3 2017[13] 5.0 64.3 Brisbane
92  Central Java  Indonesia Asia 286.6 2019[32] 34.7 8.3 Semarang
93  Connecticut  United States North America 286.0 2019[6] 3.6 79.0 Bridgeport
94  Alberta  Canada North America 277.9 2016[18] 3.6 71.1 Calgary
95 Jilin  China Asia 277.6 2019[2] 27.0 10.3 Changchun
96 Punjab  India Asia 274.6 2019[30] 30.4 9.0 Ludhiana
97  Minas Gerais  Brazil South America 272.7 2018[31] 21.0 13.0 Belo Horizonte
98  Lazio  Italy Europe 266.3 2015[29] 5.9 45.3 Rome
99 Odisha  India Asia 253.5 2019[30] 46.1 5.5 Bhubaneswar
100  Louisiana  United States North America 238.0 2016[6] 4.7 56.0 New Orleans
101  Hokkaido  Japan Asia 234.2 2012[17][26] 5.5 45.1 Sapporo
102  British Columbia  Canada North America 233.4 2016[18] 4.4 55.6 Vancouver
103  Oregon  United States North America 230.0 2016[6] 4.1 56.0 Portland
104  South Carolina  United States North America 213.0 2016[6] 5.0 40.0 Charleston
105  Alabama  United States North America 208.0 2016[6] 4.9 43.0 Birmingham
106  Western Australia  Australia Australia 207.8 2017[13] 2.7 76.7 Perth
107 Gansu  China Asia 206.4 2019[2] 26.4 7.8 Lanzhou
108  Rio Grande do Sul  Brazil South America 204.6 2018[31] 11.2 18.2 Porto Alegre
109  Kentucky  United States North America 202.0 2016[6] 4.4 42.0 Louisville
110  Paraná  Brazil South America 201.1 2018[31] 11.2 17.9 Curitiba

References

  1. "Archived copy" (PDF). Archived from the original (PDF) on 2019-02-28. Retrieved 2019-02-28.CS1 maint: archived copy as title (link)
  2. GDP-2019 by Chinese provinces is quarterly data ("Regional - quarterly by province (preliminary estimate) - China NBS National data". data.stats.gov.cn/english/index.htm. 2019-04-07.). the average exchange rate is CNY 6.9 per US dollar (according to the Statistical Communiqué of P.R. China on the 2019 National Economic and Social Development, "Statistical Communiqué of P.R. China on the 2018 National Economic and Social Development". data.stats.gov.cn/english/index.htm. 2019-04-07.)
  3. "都民経済計算(都内総生産等)30年度速報・元年度見込|東京都" (in Japanese). Tokyo Metropolitan Government. Retrieved April 28, 2020.
  4. "Gross Domestic Product by State" (PDF). US Bureau of Economic Analysis.
  5. https://ec.europa.eu/eurostat/documents/2995521/10474907/1-05032020-AP-EN.pdf
  6. "US State GDP 2018" (PDF). Archived (PDF) from the original on 2017-05-13.
  7. "Germany GDP-2012 and 2013 figures". Statistik-portal.de. Archived from the original on 2011-05-24. Retrieved 2017-03-30. Germany Federal Statistical Office; National accounts – Gross domestic product; Annual average exchange rate is US$ 1.11 to EUR€ 1 in 2015
  8. "2017년 지역소득(잠정)". www.kostat.go.kr.
  9. GDP-2018 by Chinese provinces is quarterly data ("Regional - quarterly by province (preliminary estimate) - China NBS National data". data.stats.gov.cn/english/index.htm. 2019-04-07.). the average exchange rate is CNY 6.6174 per US dollar (according to the Statistical Communiqué of P.R. China on the 2018 National Economic and Social Development, "Statistical Communiqué of P.R. China on the 2018 National Economic and Social Development". data.stats.gov.cn/english/index.htm. 2019-04-07.)
  10. "Ontario Economic Update". Fin.gov.on.ca. 2017-03-24. Archived from the original on 2017-05-15. Retrieved 2017-03-30.
  11. https://www.ons.gov.uk/economy/grossdomesticproductgdp/bulletins/regionaleconomicactivitybygrossdomesticproductuk/1998to2018/pdf
  12. "PIB TRIMESTRAL DO ESTADO DE SÃO PAULO" (PDF).
  13. Statistics, c=AU; o=Commonwealth of Australia; ou=Australian Bureau of. "Main Features - Main Features". www.abs.gov.au. Archived from the original on 2013-12-09. Retrieved 2013-12-21.
  14. OECD (2015-03-17). "Istat Statistics". Dati.istat.it. Archived from the original on 2017-03-30. Retrieved 2017-03-30.
  15. "Maharashtra Budget Analysis 2018-19" (PDF). PRS Legislative Research. Archived from the original (PDF) on 2018-03-15. Retrieved 2018-06-02.
  16. https://www.imf.org/external/pubs/ft/weo/2019/02/weodata/weorept.aspx?sy=1990&ey=2019&scsm=1&ssd=1&sort=country&ds=.&br=1&pr1.x=29&pr1.y=8&c=546%2C532&s=NGDP%2CNGDPD%2CPPPGDP&grp=0&a=
  17. "Archived copy" (PDF). Archived from the original (PDF) on 2013-09-13. Retrieved 2013-09-13.CS1 maint: archived copy as title (link)
  18. "CANSIM - 384-0038 - Gross domestic product, expenditure-based, provincial and territorial". Statcan.gc.ca. Archived from the original on 2018-05-30. Retrieved 2017-03-30.
  19. "Валовой региональный продукт". gks.ru. Archived from the original on 2018-03-07.
  20. https://www.mexicocity.com/v/economy
  21. http://www.turkstat.gov.tr/PreHaberBultenleri.do;jsessionid=WvSKczfTxbnynDmp1TvLyNbz23GzhG62pX1pLNDSzrYhjjbMZVQd!-556022155?id=30888
  22. "Archived copy". Archived from the original on 2016-02-29. Retrieved 2016-02-28.CS1 maint: archived copy as title (link)
  23. "State Domestic Product as of 31 March 2019" (PDF). Ministry of Statistics and Program Implementation, Government Of India. Retrieved 21 May 2017.
  24. "Gujarat State Budget". Archived from the original on 2019-08-10. Retrieved 2019-09-02.
  25. "Uttar Pradesh State Budget" (PDF). Archived from the original (PDF) on 2018-02-21. Retrieved 2018-03-28.
  26. "Archived copy" (PDF). Archived from the original (PDF) on 2013-08-10. Retrieved 2013-06-10.CS1 maint: archived copy as title (link)
  27. "Abu Dhabi Emirate: Facts and Figures". Abudhabi.ae. 2017-03-15. Retrieved 2017-03-30.
  28. Badan Pusat Statistik (2020). Produk Domestik Regional Bruto Provinsi di Indonesia 2015-2019. Jakarta: Badan Pusat Statistik.
  29. "Archived copy". Archived from the original on 2017-04-02. Retrieved 2018-02-03.CS1 maint: archived copy as title (link)
  30. "MOSPI Gross State Domestic Product". Ministry of Statistics and Programme Implementation, Government of India. 31 July 2020. Retrieved 8 October 2020.
  31. "PIB TRIMESTRAL DO ESTADO DE SÃO PAULO" (PDF).
  32. Badan Pusat Statistik (2020). Produk Domestik Regional Bruto Provinsi di Indonesia 2015-2019. Jakarta: Badan Pusat Statistik.
This article is issued from Wikipedia. The text is licensed under Creative Commons - Attribution - Sharealike. Additional terms may apply for the media files.