List of countries by garlic production
This is a list of countries by garlic production from the years 2016 to 2018, based on data from the Food and Agriculture Organization Corporate Statistical Database.[1] The total world production for garlic in 2018 was 28,494,130 metric tonnes, up by 3.1% from 27,648,023 tonnes in 2017. China was by far the largest producer, accounting for over 78% of world production at 22,273,802 tonnes.
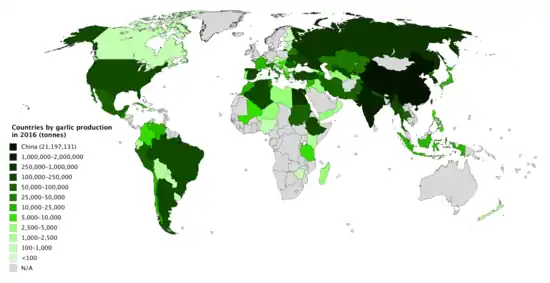
Countries by garlic production in 2016
Production by country
>100,000 tonnes
| Rank | Country/Region | 2018 | 2017 | 2016 |
|---|---|---|---|---|
| 1 | 22,273,802 | 21,759,149 | 21,244,496 | |
| 2 | 1,721,000 | 1,693,000 | 1,617,000 | |
| 3 | 461,970 | 425,401 | 381,851 | |
| 4 | 331,741 | 303,578 | 275,549 | |
| 5 | 286,213 | 289,766 | 272,769 | |
| 6 | 273,476 | 274,712 | 209,795 | |
| 7 | 260,340 | 231,993 | 204,780 | |
| 8 | 254,857 | 214,263 | 200,869 | |
| 9 | 211,981 | 206,074 | 202,992 | |
| 10 | 207,094 | 203,674 | 212,909 | |
| 11 | 202,201 | 123,475 | 103,627 | |
| 12 | 187,020 | 185,830 | 187,960 | |
| 13 | 148,156 | 147,582 | 147,009 | |
| 14 | 143,207 | 148,133 | 135,148 | |
| 15 | 124,801 | 116,972 | 138,664 | |
| 16 | 118,837 | 120,896 | 132,361 | |
| 17 | 104,574 | 94,887 | 78,205 | |
10,000–100,000 tonnes
| Rank | Country/Region | 2018 | 2017 | 2016 |
|---|---|---|---|---|
| 18 | 94,692 | 89,840 | 75,987 | |
| 19 | 81,167 | 75,002 | 70,925 | |
| 20 | 74,288 | 74,271 | 73,974 | |
| 21 | 64,247 | 66,356 | 68,857 | |
| 22 | 60,075 | 43,738 | 44,497 | |
| 23 | 59,500 | 56,668 | 50,426 | |
| 24 | 58,278 | 57,887 | 59,256 | |
| 25 | 57,975 | 55,673 | 54,389 | |
| 26 | 55,523 | 52,670 | 42,666 | |
| 27 | 54,922 | 56,692 | 57,429 | |
| 28 | 44,914 | 21,541 | 21,114 | |
| 29 | 44,881 | 38,831 | 33,481 | |
| 30 | 39,302 | 19,513 | 21,150 | |
| 31 | 34,173 | 32,760 | 31,216 | |
| 32 | 30,496 | 29,983 | 29,568 | |
| 33 | 20,978 | 20,700 | 21,100 | |
| 34 | 20,120 | 20,464 | 21,932 | |
| 35 | 19,111 | 20,133 | 16,342 | |
| 36 | 18,549 | 19,509 | 20,994 | |
| 37 | 18,106 | 38,666 | 33,533 | |
| 38 | 17,320 | 19,462 | 23,257 | |
| 39 | 15,643 | 5,896 | 3,255 | |
| 40 | 15,108 | 13,803 | 13,897 | |
| 41 | 14,919 | 4,206 | 9,955 | |
| 42 | 13,696 | 14,544 | 12,308 | |
| 43 | 13,611 | 13,660 | 12,562 | |
| 44 | 11,413 | 10,819 | 14,207 | |
| 45 | 10,490 | 12,610 | 14,207 | |
1,000–10,000 tonnes
| Rank | Country/Region | 2018 | 2017 | 2016 |
|---|---|---|---|---|
| 46 | 9,510 | 11,522 | 10,166 | |
| 47 | 7,802 | 7,430 | 7,899 | |
| 48 | 7,559 | 7,751 | 7,469 | |
| 49 | 6,130 | 7,882 | 7,135 | |
| 50 | 5,890 | 5,560 | 7,259 | |
| 51 | 5,663 | 5,890 | 5,667 | |
| 52 | 4,937 | 4,260 | 3,761 | |
| 53 | 4,771 | 4,737 | 4,684 | |
| 54 | 4,600 | 3,500 | 2,900 | |
| 55 | 4,134 | 4,214 | 4,221 | |
| 56 | 3,615 | 5,025 | 4,803 | |
| 57 | 3,400 | 3,400 | 3,400 | |
| 58 | 3,312 | 3,240 | 3,167 | |
| 59 | 3,269 | 3,292 | 3,339 | |
| 60 | 2,851 | 2,812 | 2,774 | |
| 61 | 2,573 | 1,725 | 2,760 | |
| 62 | 2,569 | 2,777 | 3,731 | |
| 63 | 2,477 | 2,915 | 2,914 | |
| 64 | 2,357 | 1,901 | 1,444 | |
| 65 | 2,353 | 2,393 | 2,351 | |
| 66 | 2,038 | 2,660 | 2,622 | |
| 67 | 2,033 | 1,891 | 2,958 | |
| 68 | 2,009 | 2,822 | 2,267 | |
| 69 | 1,995 | 1,961 | 1,928 | |
| 70 | 1,689 | 1,340 | 835 | |
| 71 | 1,517 | 1,524 | 2,368 | |
| 72 | 1,490 | 1,563 | 1,410 | |
| 73 | 1,361 | 1,486 | 2,183 | |
| 74 | 1,325 | 1,302 | 1,279 | |
| 75 | 1,126 | 1,884 | 610 | |
| 76 | 1,119 | 1,091 | 1,025 | |
| 77 | 1,092 | 1,067 | 1,041 | |
| 78 | 1,074 | 1,095 | 1,118 | |
| 79 | 1,070 | 970 | 1,622 | |
| 80 | 1,021 | 993 | 964 | |
| 80 | 1,021 | 1,003 | 1,089 | |
<1,000 tonnes
| Rank | Country/Region | 2018 | 2017 | 2016 |
|---|---|---|---|---|
| 82 | 900 | 900 | 850 | |
| 83 | 835 | 1,000 | 800 | |
| 84 | 797 | 708 | 1,176 | |
| 85 | 521 | 230 | N/A | |
| 86 | 445 | 18 | 59 | |
| 87 | 432 | 280 | 351 | |
| 88 | 415 | 410 | 411 | |
| 89 | 366 | 358 | 479 | |
| 90 | 365 | 359 | 354 | |
| 91 | 314 | 231 | 313 | |
| 92 | 235 | 356 | 185 | |
| 93 | 230 | 230 | 225 | |
| 94 | 221 | 217 | 212 | |
| 95 | 208 | 205 | 215 | |
| 96 | 105 | 103 | 100 | |
| 97 | 71 | 96 | 120 | |
| 98 | 60 | 75 | 141 | |
| 99 | 56 | 47 | 61 | |
| 100 | 37 | 42 | 34 | |
References
- "Crops". FAOSTAT. Retrieved 18 December 2020. Countries - Select All; Regions - World + (Total); Elements - Production Quantity; Items - Garlic; Years - 2018 + 2017 + 2016
This article is issued from Wikipedia. The text is licensed under Creative Commons - Attribution - Sharealike. Additional terms may apply for the media files.