List of countries by plum production
This is a list of countries by plum and sloe production in 2016 and 2017, based on data from the Food and Agriculture Organization Corporate Statistical Database.[1] The estimated total world production of plum and sloe for 2017 was 11,758,135 metric tonnes, down 1% from 11,875,874 tonnes in 2016.[n 1] China was by far the largest producer, accounting for nearly 58% of global production.
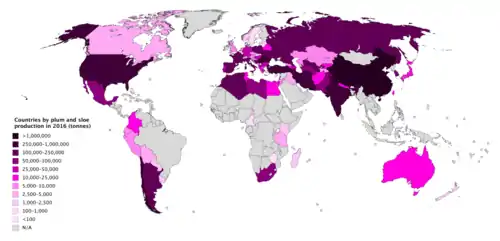
Countries by plum and sloe production in 2016
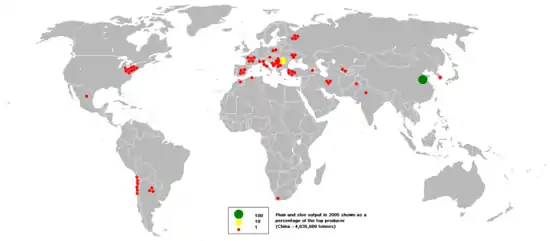
A map of world plum and sloe production, 2005.
Production by country
>100,000 tonnes
| Rank | Country/Region | 2017 | 2016 |
|---|---|---|---|
| 1 | 6,791,974 | 6,632,558 | |
| — | 1,292,856 | 1,474,983 | |
| 2 | 434,390 | 512,975 | |
| 3 | 423,200 | 264,990 | |
| 4 | 330,582 | 471,442 | |
| 5 | 298,893 | 263,395 | |
| 6 | 291,934 | 297,589 | |
| 7 | 290,175 | 293,216 | |
| 8 | 269,467 | 262,197 | |
| 9 | 206,966 | 220,729 | |
| 10 | 205,031 | 211,269 | |
| 11 | 200,470 | 178,320 | |
| 12 | 179,387 | 123,577 | |
| 13 | 172,325 | 193,598 | |
| 14 | 146,377 | 164,602 | |
| 15 | 115,966 | 120,263 | |
| 16 | 111,797 | 102,692 | |
10,000–100,000 tonnes
| Rank | Country/Region | 2017 | 2016 |
|---|---|---|---|
| 17 | 83,607 | 77,931 | |
| 18 | 82,946 | 78,857 | |
| 19 | 76,164 | 99,716 | |
| 20 | 75,668 | 87,030 | |
| 21 | 74,398 | 131,579 | |
| 22 | 58,403 | 109,503 | |
| 23 | 56,208 | 55,129 | |
| 24 | 53,346 | 50,942 | |
| 25 | 52,483 | 51,977 | |
| 26 | 49,194 | 48,630 | |
| 27 | 43,678 | 47,560 | |
| 28 | 42,437 | 40,180 | |
| 28 | 39,110 | 150,229 | |
| 30 | 33,559 | 28,793 | |
| 31 | 30,993 | 30,949 | |
| 32 | 29,515 | 26,067 | |
| 33 | 25,500 | 23,780 | |
| 34 | 25,274 | 18,504 | |
| 35 | 24,500 | 19,500 | |
| 36 | 24,016 | 15,684 | |
| 37 | 23,885 | 37,783 | |
| 38 | 23,365 | 23,493 | |
| 39 | 19,600 | 23,000 | |
| 40 | 17,880 | 33,684 | |
| 41 | 17,862 | 17,992 | |
| 42 | 16,115 | 15,500 | |
| 43 | 16,081 | 16,703 | |
| 44 | 12,424 | 13,727 | |
| 45 | 12,206 | 10,877 | |
1,000–10,000 tonnes
| Rank | Country/Region | 2017 | 2016 |
|---|---|---|---|
| 46 | 9,736 | 12,187 | |
| 47 | 9,721 | 7,783 | |
| 48 | 9,231 | 8,902 | |
| 49 | 9,119 | 10,563 | |
| 50 | 8,878 | 8,834 | |
| 51 | 8,209 | 9,420 | |
| 52 | 8,000 | 9,200 | |
| 53 | 7,413 | 9,031 | |
| 54 | 6,701 | 5,410 | |
| 55 | 5,816 | 5,766 | |
| 56 | 5,789 | 5,543 | |
| 57 | 5,091 | 4,684 | |
| 58 | 4,626 | 3,092 | |
| 59 | 4,500 | 3,267 | |
| 60 | 4,330 | 3,830 | |
| 61 | 4,065 | 5,998 | |
| 62 | 3,800 | 8,500 | |
| 63 | 3,792 | 7,051 | |
| 64 | 3,579 | 3,421 | |
| 65 | 3,293 | 22,228 | |
| 66 | 2,951 | 2,989 | |
| 67 | 2,267 | 2,244 | |
| 68 | 2,118 | 1,952 | |
| 69 | 2,036 | 1,259 | |
| 70 | 1,834 | 1,815 | |
| 71 | 1,733 | 1,733 | |
| 72 | 1,680 | 1,818 | |
| 73 | 1,301 | 1,317 | |
| 74 | 1,201 | 1,842 | |
| 75 | 1,183 | 1,178 | |
External links
Notes
- Sum of values for countries with available data, which may be official or FAO data based on imputation methodology
- Value for a specific year is the sum of the available values for EU member states for that year
References
- "Crops". FAOSTAT. Retrieved 5 August 2019. Countries - Select All; Regions - World + (Total); Elements - Production Quantity; Items - Plums and sloes; Years - 2017 + 2016
This article is issued from Wikipedia. The text is licensed under Creative Commons - Attribution - Sharealike. Additional terms may apply for the media files.