List of countries by pear production
This is a list of countries by pear production in 2016 and 2017, based on data from the Food and Agriculture Organization Corporate Statistical Database.[1] The estimated total world production for pears in 2017 was 24,168,309 metric tonnes, an increase of 2.1% from 23,676,110 tonnes in 2016.[n 1] China was by far the largest producer, accounting for over 67% (two-thirds) of global production.
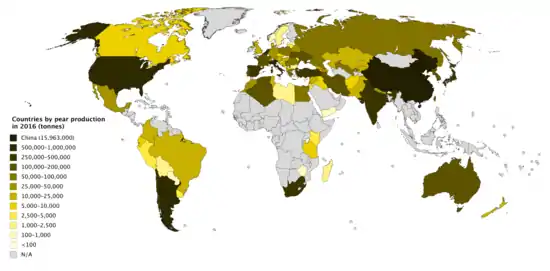
Countries by pear production in 2016
Production by country
>100,000 tonnes
| Rank | Country | 2017 | 2016 |
|---|---|---|---|
| 1 | 16,410,000 | 15,963,000 | |
| 2 | 930,340 | 905,605 | |
| 3 | 772,577 | 701,928 | |
| 4 | 677,891 | 682,061 | |
| 5 | 503,004 | 472,250 | |
| 6 | 414,879 | 423,128 | |
| 7 | 360,957 | 349,247 | |
| 8 | 346,000 | 323,000 | |
| 9 | 330,000 | 374,000 | |
| 10 | 309,189 | 307,166 | |
| 11 | 301,818 | 331,550 | |
| 12 | 274,500 | 278,100 | |
| 13 | 236,982 | 211,951 | |
| 14 | 220,885 | 238,014 | |
| 15 | 202,277 | 137,805 | |
| 16 | 165,440 | 156,000 | |
| 17 | 147,621 | 146,814 | |
| 18 | 118,419 | 129,627 | |
| 19 | 117,694 | 111,424 | |
| 20 | 104,916 | 99,177 | |
10,000–100,000 tonnes
| Rank | Country | 2017 | 2016 |
|---|---|---|---|
| 21 | 96,741 | 104,928 | |
| 22 | 80,576 | 178,144 | |
| 23 | 73,200 | 66,200 | |
| 24 | 64,680 | 69,752 | |
| 25 | 58,551 | 65,841 | |
| 26 | 55,142 | 81,469 | |
| 27 | 52,291 | 60,799 | |
| 28 | 50,492 | 40,687 | |
| 29 | 46,111 | 23,450 | |
| 30 | 46,040 | 52,751 | |
| 31 | 39,828 | 34,699 | |
| 32 | 34,025 | 27,754 | |
| 33 | 32,105 | 30,788 | |
| 34 | 30,061 | 34,724 | |
| 35 | 28,000 | 27,001 | |
| 36 | 27,929 | 26,952 | |
| 37 | 27,700 | 24,000 | |
| 38 | 27,011 | 23,083 | |
| 39 | 23,386 | 34,625 | |
| 40 | 22,767 | 22,422 | |
| 41 | 22,684 | 22,653 | |
| 42 | 22,108 | 14,915 | |
| 43 | 18,652 | 21,926 | |
| 44 | 18,175 | 13,069 | |
| 45 | 17,105 | 17,909 | |
| 46 | 16,033 | 16,000 | |
| 47 | 15,370 | 24,003 | |
| 48 | 14,231 | 14,120 | |
| 49 | 13,458 | 13,384 | |
| 50 | 12,902 | 15,176 | |
| 51 | 12,000 | 4,986 | |
| 52 | 11,670 | 8,282 | |
| 53 | 11,246 | 10,390 | |
<10,000 tonnes
| Rank | Country | 2017 | 2016 |
|---|---|---|---|
| 54 | 9,676 | 8,285 | |
| 55 | 8,862 | 5,226 | |
| 56 | 7,755 | 7,443 | |
| 57 | 6,746 | 6,966 | |
| 58 | 6,426 | 5,931 | |
| 59 | 5,600 | 10,700 | |
| 60 | 5,208 | 4,933 | |
| 61 | 5,052 | 7,207 | |
| 62 | 4,465 | 8,000 | |
| 63 | 4,420 | 4,272 | |
| 64 | 4,267 | 3,929 | |
| 65 | 3,947 | 6,541 | |
| 66 | 3,900 | 4,300 | |
| 67 | 3,767 | 4,059 | |
| 68 | 2,840 | 1,992 | |
| 69 | 2,796 | 3,962 | |
| 70 | 2,448 | 2,422 | |
| 71 | 2,050 | 1,410 | |
| 72 | 1,907 | 1,789 | |
| 73 | 1,590 | 1,588 | |
| 74 | 1,510 | 963 | |
| 75 | 1,441 | 1,431 | |
| 76 | 844 | 417 | |
| 77 | 762 | 950 | |
| 78 | 545 | 594 | |
| 79 | 431 | 365 | |
| 80 | 384 | 378 | |
| 81 | 250 | 238 | |
| 82 | 219 | 542 | |
| 83 | 214 | 214 | |
| 84 | 157 | 163 | |
| 85 | 143 | 142 | |
| 86 | 22 | 23 | |
| 87 | 3 | 3 | |
Notes
- Sum of values for countries with available data, which may be official or FAO data based on imputation methodology
References
- "Crops". FAOSTAT. Retrieved 5 August 2019. Countries - Select All; Regions - World + (Total); Elements - Production Quantity; Items - Pears; Years - 2017 + 2016
This article is issued from Wikipedia. The text is licensed under Creative Commons - Attribution - Sharealike. Additional terms may apply for the media files.