Mitchell County, Kansas
Mitchell County (standard abbreviation: MC) is a county located in the U.S. state of Kansas. As of the 2010 census, the county population was 6,373.[1] The largest city and county seat is Beloit.[2]
Mitchell County | |
|---|---|
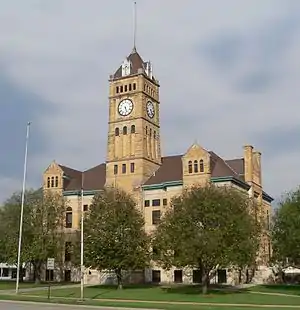 Mitchell County courthouse in Beloit (2014) | |
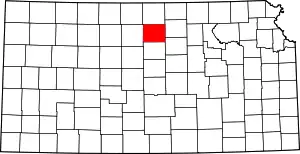 Location within the U.S. state of Kansas | |
 Kansas's location within the U.S. | |
| Coordinates: 39°24′N 98°12′W | |
| Country | |
| State | |
| Founded | February 26, 1867 |
| Named for | William D. Mitchell |
| Seat | Beloit |
| Largest city | Beloit |
| Area | |
| • Total | 719 sq mi (1,860 km2) |
| • Land | 702 sq mi (1,820 km2) |
| • Water | 17 sq mi (40 km2) 2.4%% |
| Population | |
| • Estimate (2018) | 6,150 |
| • Density | 9.1/sq mi (3.5/km2) |
| Time zone | UTC−6 (Central) |
| • Summer (DST) | UTC−5 (CDT) |
| Congressional district | 1st |
| Website | County Website |
History
Early history
For many millennia, the Great Plains of North America was inhabited by nomadic Native Americans. From the 16th century to 18th century, the Kingdom of France claimed ownership of large parts of North America. In 1762, after the French and Indian War, France secretly ceded New France to Spain, per the Treaty of Fontainebleau.
19th century
In 1802, Spain returned most of the land to France, but keeping title to about 7,500 square miles. In 1803, most of the land for modern day Kansas was acquired by the United States from France as part of the 828,000 square mile Louisiana Purchase for 2.83 cents per acre.
In 1854, the Kansas Territory was organized, then in 1861 Kansas became the 34th U.S. state. In 1867, Mitchell County was established.
Geography
According to the U.S. Census Bureau, the county has a total area of 719 square miles (1,860 km2), of which 702 square miles (1,820 km2) is land and 17 square miles (44 km2) (2.4%) is water.[3]
Adjacent counties
- Jewell County (north)
- Cloud County (east)
- Ottawa County (southeast)
- Lincoln County (south)
- Osborne County (west)
Demographics
| Historical population | |||
|---|---|---|---|
| Census | Pop. | %± | |
| 1870 | 485 | — | |
| 1880 | 14,911 | 2,974.4% | |
| 1890 | 15,037 | 0.8% | |
| 1900 | 14,647 | −2.6% | |
| 1910 | 14,089 | −3.8% | |
| 1920 | 13,886 | −1.4% | |
| 1930 | 12,774 | −8.0% | |
| 1940 | 11,339 | −11.2% | |
| 1950 | 10,320 | −9.0% | |
| 1960 | 8,866 | −14.1% | |
| 1970 | 8,010 | −9.7% | |
| 1980 | 8,117 | 1.3% | |
| 1990 | 7,203 | −11.3% | |
| 2000 | 6,932 | −3.8% | |
| 2010 | 6,373 | −8.1% | |
| 2018 (est.) | 6,150 | [4] | −3.5% |
| U.S. Decennial Census[5] 1790-1960[6] 1900-1990[7] 1990-2000[8] 2010-2016[1] | |||

As of the census[9] of 2010, there were 6,373 people, 2,790 households, and 1,725 families residing in the county. The population density was 8.8 people per square mile (3.4/km2). There were 3,296 housing units at an average density of 4.6 per square mile (1.7/km2). The racial makeup of the county was 97.97% White, 0.20% Black or African American, 0.37% Native American, 0.29% Asian, 0.07% Pacific Islander, 0.26% from other races, and 0.80% from two or more races. 1.14% of the population were Hispanic or Latino of any race.
There were 2,790 households, out of which 24.30% had children under the age of 18 living with them, 52.29% were married couples living together, 6.23% had a female householder with no husband present, and 38.17% were non-families. 33.08% of all households were made up of individuals, and 15.12% had someone living alone who was 65 years of age or older. The average household size was 2.20 and the average family size was 2.77.
In the county, the population was spread out, with 21.44% under the age of 18, 8.00% from 18 to 24, 19.83% from 25 to 44, 29.67% from 45 to 64, and 21.04% who were 65 years of age or older. The median age was 45.6 years. For every 100 females there were 102.0 males. For every 100 females age 18 and over, there were 102.2 males.
The median income for a household in the county was $44,247, and the median income for a family was $54,502. Males had a median income of $30,044 versus $20,094 for females. The per capita income for the county was $23,350. About 4.90% of families and 8.26% of the population were below the poverty line, including 12.04% of those under age 18 and 12.33% of those age 65 or over.
Government
Presidential elections
Prior to 1940, Mitchell County was a swing county, backing the national winner in every presidential election from 1900 to 1936. Since 1940, it has become a Republican stronghold, with only George H. W. Bush in 1992 failing to win a majority in the county due to Ross Perot's strong showing in Kansas.
| Year | Republican | Democratic | Third Parties |
|---|---|---|---|
| 2016 | 78.5% 2,308 | 16.2% 477 | 5.3% 157 |
| 2012 | 78.5% 2,327 | 19.7% 584 | 1.8% 54 |
| 2008 | 76.2% 2,440 | 21.9% 701 | 1.9% 62 |
| 2004 | 77.9% 2,609 | 20.7% 693 | 1.4% 47 |
| 2000 | 72.0% 2,350 | 23.0% 751 | 5.1% 165 |
| 1996 | 68.7% 2,435 | 23.5% 833 | 7.8% 276 |
| 1992 | 43.9% 1,601 | 25.7% 938 | 30.4% 1,111 |
| 1988 | 65.2% 2,257 | 33.1% 1,145 | 1.7% 60 |
| 1984 | 76.0% 3,036 | 23.0% 919 | 1.0% 41 |
| 1980 | 71.4% 2,821 | 22.2% 876 | 6.5% 256 |
| 1976 | 54.0% 2,095 | 43.8% 1,700 | 2.2% 85 |
| 1972 | 71.6% 2,830 | 26.1% 1,030 | 2.4% 93 |
| 1968 | 62.9% 2,428 | 29.6% 1,144 | 7.5% 289 |
| 1964 | 50.3% 1,951 | 48.9% 1,898 | 0.8% 31 |
| 1960 | 61.8% 2,779 | 37.6% 1,692 | 0.6% 26 |
| 1956 | 72.2% 3,198 | 27.4% 1,214 | 0.5% 20 |
| 1952 | 81.0% 4,167 | 18.7% 961 | 0.4% 18 |
| 1948 | 62.2% 2,998 | 36.3% 1,750 | 1.6% 75 |
| 1944 | 66.7% 3,238 | 32.5% 1,579 | 0.8% 40 |
| 1940 | 63.6% 3,681 | 35.6% 2,060 | 0.9% 51 |
| 1936 | 45.5% 2,781 | 53.8% 3,289 | 0.7% 41 |
| 1932 | 42.7% 2,502 | 54.2% 3,176 | 3.1% 181 |
| 1928 | 62.8% 3,245 | 35.9% 1,855 | 1.2% 64 |
| 1924 | 59.8% 3,161 | 27.8% 1,470 | 12.4% 656 |
| 1920 | 68.3% 3,310 | 29.1% 1,409 | 2.6% 126 |
| 1916 | 41.4% 2,413 | 54.9% 3,197 | 3.7% 215 |
| 1912 | 22.1% 737 | 43.1% 1,441 | 34.8% 1,163 |
| 1908 | 50.5% 1,765 | 44.9% 1,570 | 4.6% 160 |
| 1904 | 63.9% 2,037 | 27.2% 867 | 8.9% 285 |
| 1900 | 49.7% 1,764 | 47.9% 1,702 | 2.5% 87 |
| 1896 | 42.7% 1,428 | 56.4% 1,889 | 0.9% 30 |
| 1892 | 43.5% 1,467 | 56.5% 1,905 | |
| 1888 | 55.9% 1,676 | 29.4% 880 | 14.7% 442 |
Laws
Following amendment to the Kansas Constitution in 1986, the county remained a prohibition, or "dry", county until 1996, when voters approved the sale of alcoholic liquor by the individual drink with a 30% food sales requirement.[11]
Education
Colleges
- North Central Kansas Technical College in Beloit
Unified school districts
Private schools
- St. John's Catholic High School
- Tipton Catholic High School
Communities
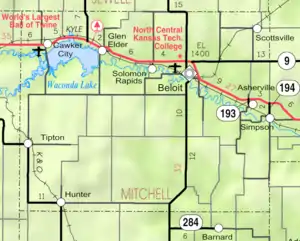
Cities
- Beloit
- Cawker City
- Glen Elder
- Hunter
- Tipton
- Scottsville
- Simpson (partly in Cloud County)
Unincorporated communities
Townships
Mitchell County is divided into twenty townships. The city of Beloit is considered governmentally independent and is excluded from the census figures for the townships. In the following table, the population center is the largest city (or cities) included in that township's population total, if it is of a significant size.
| Township | FIPS | Population center |
Population | Population density /km2 (/sq mi) |
Land area km2 (sq mi) | Water area km2 (sq mi) | Water % | Geographic coordinates |
|---|---|---|---|---|---|---|---|---|
| Asherville | 02625 | 122 | 1 (3) | 93 (36) | 0 (0) | 0.08% | 39°25′48″N 97°59′28″W | |
| Beloit | 05800 | Beloit | 4,003 | 48 (125) | 83 (32) | 0 (0) | 0.02% | 39°26′40″N 98°5′33″W |
| Bloomfield | 07425 | 83 | 1 (2) | 94 (36) | 0 (0) | 0.24% | 39°20′33″N 98°6′24″W | |
| Blue Hill | 07575 | 36 | 0 (1) | 93 (36) | 0 (0) | 0.36% | 39°15′17″N 98°18′43″W | |
| Carr Creek | 10850 | 31 | 0 (1) | 84 (33) | 9 (3) | 9.51% | 39°26′23″N 98°26′40″W | |
| Cawker | 11150 | Cawker City | 578 | 8 (20) | 75 (29) | 17 (7) | 18.68% | 39°30′55″N 98°26′2″W |
| Center | 11875 | 49 | 1 (1) | 93 (36) | 0 (0) | 0.03% | 39°21′26″N 98°12′2″W | |
| Custer | 16875 | Hunter | 132 | 1 (4) | 94 (36) | 0 (0) | 0.13% | 39°14′56″N 98°24′53″W |
| Eureka | 21875 | 41 | 0 (1) | 93 (36) | 0 (0) | 0.38% | 39°15′20″N 97°59′46″W | |
| Glen Elder | 26525 | Glen Elder | 553 | 7 (18) | 78 (30) | 15 (6) | 16.01% | 39°30′32″N 98°18′49″W |
| Hayes | 30975 | 21 | 0 (1) | 93 (36) | 0 (0) | 0.03% | 39°20′4″N 98°19′8″W | |
| Logan | 42025 | Simpson | 168 | 2 (5) | 93 (36) | 0 (0) | 0.12% | 39°21′59″N 97°56′21″W |
| Lulu | 43225 | Scottsville | 90 | 1 (3) | 92 (35) | 0 (0) | 0% | 39°31′53″N 97°58′34″W |
| Pittsburg | 56050 | Tipton | 346 | 4 (10) | 93 (36) | 0 (0) | 0.03% | 39°20′31″N 98°28′3″W |
| Plum Creek | 56825 | 119 | 1 (3) | 92 (36) | 0 (0) | 0.02% | 39°30′53″N 98°5′21″W | |
| Round Springs | 61500 | 27 | 0 (1) | 93 (36) | 0 (0) | 0.14% | 39°15′51″N 98°11′28″W | |
| Salt Creek | 62825 | 39 | 0 (1) | 93 (36) | 0 (0) | 0.37% | 39°15′12″N 98°6′11″W | |
| Solomon Rapids | 66450 | 80 | 1 (2) | 91 (35) | 0 (0) | 0.14% | 39°31′19″N 98°12′58″W | |
| Turkey Creek | 71725 | 134 | 1 (4) | 92 (36) | 0 (0) | 0.23% | 39°26′40″N 98°12′1″W | |
| Walnut Creek | 75150 | 42 | 0 (1) | 88 (34) | 5 (2) | 5.78% | 39°26′49″N 98°19′1″W |
See also
|
|
References
- "State & County QuickFacts". United States Census Bureau. Archived from the original on August 6, 2011. Retrieved July 27, 2014.
- "Find a County". National Association of Counties. Retrieved 2011-06-07.
- "US Gazetteer files: 2010, 2000, and 1990". United States Census Bureau. 2011-02-12. Retrieved 2011-04-23.
- "Population and Housing Unit Estimates". Retrieved December 23, 2019.
- "U.S. Decennial Census". United States Census Bureau. Retrieved July 27, 2014.
- "Historical Census Browser". University of Virginia Library. Retrieved July 27, 2014.
- "Population of Counties by Decennial Census: 1900 to 1990". United States Census Bureau. Retrieved July 27, 2014.
- "Census 2000 PHC-T-4. Ranking Tables for Counties: 1990 and 2000" (PDF). United States Census Bureau. Retrieved July 27, 2014.
- "U.S. Census website". United States Census Bureau. Retrieved 2008-01-31.
- David Leip. "Dave Leip's Atlas of U.S. Presidential Elections". Uselectionatlas.org. Retrieved 2019-09-13.
- "Map of Wet and Dry Counties". Alcoholic Beverage Control, Kansas Department of Revenue. November 2006. Archived from the original on 2007-10-08. Retrieved 2007-12-26.
Further reading
- Standard Atlas of Mitchell County, Kansas; Geo. A. Ogle & Co; 73 pages; 1917.
- Standard Atlas of Mitchell County, Kansas; Geo. A. Ogle & Co; 56 pages; 1902.
- Atlas of Mitchell County, Kansas; Gillen & Davy; 45 pages; 1884.
External links
| Wikimedia Commons has media related to Mitchell County, Kansas. |
- County
- Maps
- Mitchell County Maps: Current, Historic, KDOT
- Kansas Highway Maps: Current, Historic, KDOT
- Kansas Railroad Maps: Current, 1996, 1915, KDOT and Kansas Historical Society
Places adjacent to Mitchell County, Kansas | ||||||||||
|---|---|---|---|---|---|---|---|---|---|---|
| ||||||||||
Municipalities and communities of Mitchell County, Kansas, United States | ||
|---|---|---|
| Cities | Map of Kansas highlighting Mitchell County | |
| Unincorporated community | ||
| Ghost towns | ||
| Townships |
| |
| Footnotes | †This populated place is designated a Census-Designated Place (CDP) by the United States Census Bureau, ‡This populated place also has portions in an adjacent county or counties. | |
| ||
| Authority control |
|---|