Smith County, Kansas
Smith County (standard abbreviation: SM) is a county located in the U.S. state of Kansas. As of the 2010 census, the population was 3,853 with a 2018 estimate of 3,603.[1][2] Its county seat is Smith Center.[3] The county is named in memory of Maj. J. Nelson Smith, who was part of the 2nd Colorado Cavalry, killed in action at the Battle of Westport on October 21, 1864.
Smith County | |
|---|---|
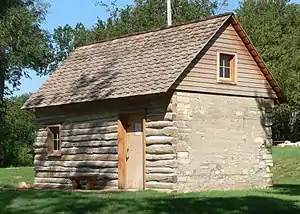 Home on the Range Cabin near Smith Center (2014) | |
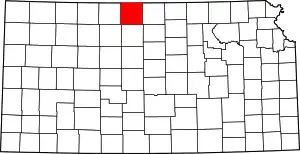 Location within the U.S. state of Kansas | |
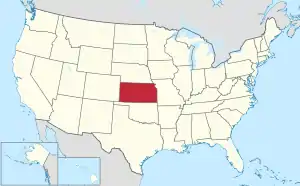 Kansas's location within the U.S. | |
| Coordinates: 39°50′00″N 98°45′00″W | |
| Country | |
| State | |
| Founded | 1872 |
| Named for | J. Nelson Smith |
| Seat | Smith Center |
| Largest city | Smith Center |
| Area | |
| • Total | 897 sq mi (2,320 km2) |
| • Land | 895 sq mi (2,320 km2) |
| • Water | 1.5 sq mi (4 km2) 0.2% |
| Population (2010) | |
| • Total | 3,853 |
| • Estimate (2018) | 3,603 |
| • Density | 4.3/sq mi (1.7/km2) |
| Time zone | UTC−6 (Central) |
| • Summer (DST) | UTC−5 (CDT) |
| Congressional district | 1st |
| Website | SmithCoKS.com |
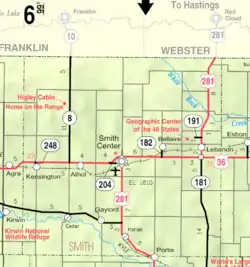
The geographic center of the contiguous United States is located within the county, near Lebanon.[4]
History
Early history
For many millennia, the Great Plains of North America was inhabited by nomadic Native Americans. From the 16th century to 18th century, the Kingdom of France claimed ownership of large parts of North America. In 1762, after the French and Indian War, France secretly ceded New France to Spain, per the Treaty of Fontainebleau.
19th century
In 1802, Spain returned most of the land to France, but keeping title to about 7,500 square miles. In 1803, most of the land for modern day Kansas was acquired by the United States from France as part of the 828,000 square mile Louisiana Purchase for 2.83 cents per acre.
In 1854, the Kansas Territory was organized, then in 1861 Kansas became the 34th U.S. state. In 1872, Smith County was established. The first homestead in Smith County was in 1871 and there were 3,800 inhabitants by 1875. The county grew to 15,000 people by 1889. Corn was the main crop at first but drought and grasshopper plagues severely hurt the crops. When hardy Winter wheat was introduced to Kansas by Russian settlers, it eventually became the predominant crop in Smith County. The population of the county has slowly declined since 1900 due in large part because of advanced farming techniques that require less human labor.
Brewster Higley wrote the song "Home on the Range" in 1873 in a cabin 9 miles northwest of Smith Center. It later became the Kansas State song.[5][6]
Geography
According to the U.S. Census Bureau, the county has a total area of 897 square miles (2,320 km2), of which 895 square miles (2,320 km2) is land and 1.5 square miles (3.9 km2) (0.2%) is water.[7] The county is divided into 25 townships, each of which is listed below in the subdivisions section of this article.
The geographic center of the 48 contiguous states is located within the county, near the city of Lebanon.[8] The geographic center of North America is located in neighboring Osborne County.
The Solomon River runs through the southern part of the county and provides a flat basin and water for irrigated crops.
Major highways
There are two major highways serving the county. The main east–west route is U.S. Highway 36, which travels through Athol, Kensington, and Smith Center. The main north–south route is U.S. Highway 281, which intersects US-36 in Smith Center. Kansas state highways K-8, K-9 and K-180 serve other areas of the county.
Adjacent counties
- Webster County, Nebraska (northeast)
- Jewell County (east)
- Osborne County (south)
- Rooks County (southwest)
- Phillips County (west)
- Franklin County, Nebraska (northwest)
Demographics
| Historical population | |||
|---|---|---|---|
| Census | Pop. | %± | |
| 1870 | 66 | — | |
| 1880 | 13,883 | 20,934.8% | |
| 1890 | 15,613 | 12.5% | |
| 1900 | 16,384 | 4.9% | |
| 1910 | 15,365 | −6.2% | |
| 1920 | 14,985 | −2.5% | |
| 1930 | 13,545 | −9.6% | |
| 1940 | 10,582 | −21.9% | |
| 1950 | 8,846 | −16.4% | |
| 1960 | 7,776 | −12.1% | |
| 1970 | 6,757 | −13.1% | |
| 1980 | 5,947 | −12.0% | |
| 1990 | 5,078 | −14.6% | |
| 2000 | 4,536 | −10.7% | |
| 2010 | 3,853 | −15.1% | |
| 2018 (est.) | 3,603 | [9] | −6.5% |
| U.S. Decennial Census[10] 1790-1960[11] 1900-1990[12] 1990-2000[13] 2010-2016[2] | |||

As of the census[14] of 2000, there were 4,536 people, 1,953 households, and 1,322 families residing in the county. The population density was 5 people per square mile (2/km2). There were 2,326 housing units at an average density of 3 per square mile (1/km2). The racial makeup of the county was 98.79% White, 0.11% Black or African American, 0.24% Native American, 0.04% Asian, 0.11% Pacific Islander, 0.22% from other races, and 0.49% from two or more races. 0.73% of the population were Hispanic or Latino of any race.
There were 1,953 households, out of which 25.60% had children under the age of 18 living with them, 60.60% were married couples living together, 4.70% had a female householder with no husband present, and 32.30% were non-families. 30.20% of all households were made up of individuals, and 18.60% had someone living alone who was 65 years of age or older. The average household size was 2.27 and the average family size was 2.78.
In the county, the population was spread out, with 21.70% under the age of 18, 4.70% from 18 to 24, 22.10% from 25 to 44, 23.60% from 45 to 64, and 27.90% who were 65 years of age or older. The median age was 46 years. For every 100 females there were 92.70 males. For every 100 females age 18 and over, there were 90.40 males.
The median income for a household in the county was $28,486, and the median income for a family was $36,951. Males had a median income of $25,089 versus $18,608 for females. The per capita income for the county was $14,983. About 8.80% of families and 10.70% of the population were below the poverty line, including 12.80% of those under age 18 and 9.50% of those age 65 or over.
The population distribution by township is as follows according to the 2000 census: Banner 54; Beaver 60; Blaine 60; Cedar 619; Center 2,094; Cora 38; Crystal Plains 40; Dor 46; Garfield 33; German 34; Harlan 100; Harvey 130; Houston 206; Lane 134; Lincoln 73; Logan 47; Martin 24; Oak 399; Pawnee 35; Pleasant 34; Swan 42; Valley 75; Washington 63; Webster 47; White Rock 49.
Government
Presidential elections
| Year | Republican | Democratic | Third Parties |
|---|---|---|---|
| 2016 | 81.3% 1,661 | 14.5% 297 | 4.1% 84 |
| 2012 | 80.3% 1,624 | 17.7% 358 | 2.0% 41 |
| 2008 | 77.8% 1,719 | 20.2% 446 | 2.0% 45 |
| 2004 | 76.1% 1,803 | 22.8% 540 | 1.1% 27 |
| 2000 | 70.2% 1,534 | 24.5% 534 | 5.3% 116 |
| 1996 | 65.4% 1,628 | 25.6% 638 | 9.0% 224 |
| 1992 | 43.3% 1,236 | 27.7% 789 | 29.0% 827 |
| 1988 | 65.3% 1,951 | 33.6% 1,004 | 1.1% 33 |
| 1984 | 75.7% 2,332 | 22.2% 684 | 2.1% 63 |
| 1980 | 71.7% 2,415 | 21.4% 719 | 6.9% 234 |
| 1976 | 58.5% 2,009 | 38.8% 1,333 | 2.7% 94 |
| 1972 | 74.3% 2,600 | 23.4% 818 | 2.4% 83 |
| 1968 | 67.5% 2,558 | 24.8% 939 | 7.7% 293 |
| 1964 | 52.3% 2,026 | 46.7% 1,809 | 0.9% 36 |
| 1960 | 71.9% 3,013 | 27.6% 1,157 | 0.5% 22 |
| 1956 | 73.0% 3,142 | 26.5% 1,139 | 0.6% 26 |
| 1952 | 77.8% 3,623 | 21.2% 986 | 1.1% 51 |
| 1948 | 61.9% 2,760 | 35.7% 1,590 | 2.4% 106 |
| 1944 | 69.9% 3,282 | 29.3% 1,377 | 0.7% 34 |
| 1940 | 65.6% 3,630 | 33.5% 1,855 | 0.9% 50 |
| 1936 | 53.5% 3,292 | 46.3% 2,847 | 0.3% 17 |
| 1932 | 46.5% 2,870 | 51.1% 3,155 | 2.3% 144 |
| 1928 | 74.3% 4,021 | 24.7% 1,338 | 0.9% 50 |
| 1924 | 57.2% 3,226 | 29.0% 1,634 | 13.8% 777 |
| 1920 | 66.1% 3,251 | 31.2% 1,535 | 2.7% 132 |
| 1916 | 41.1% 2,605 | 54.1% 3,431 | 4.8% 306 |
| 1912 | 25.8% 970 | 40.9% 1,534 | 33.3% 1,250 |
| 1908 | 51.7% 1,843 | 44.7% 1,593 | 3.7% 132 |
| 1904 | 66.0% 2,254 | 17.5% 596 | 16.5% 564 |
| 1900 | 46.5% 1,770 | 51.9% 1,978 | 1.6% 61 |
| 1896 | 40.2% 1,385 | 58.6% 2,019 | 1.1% 39 |
| 1892 | 41.3% 1,389 | 58.7% 1,972 | |
| 1888 | 51.7% 1,726 | 23.3% 777 | 25.0% 835 |
Smith County is overwhelmingly Republican. No Democratic Presidential candidate has won Smith County since Franklin D. Roosevelt in 1932. Since 1940 the only Democrat to win forty percent of the county's vote has been Lyndon Johnson during his 1964 landslide, and the last to pass thirty percent was Michael Dukakis during the drought-affected 1988 election
Laws
Following amendment to the Kansas Constitution in 1986, the county remained a prohibition, or "dry", county until 1992, when voters approved the sale of alcoholic liquor by the individual drink with a 30 percent food sales requirement.[16]
Education
Unified school districts
Communities
Cities
Townships
Smith County is divided into twenty-five townships. None of the cities within the county are considered governmentally independent, and all figures for the townships include those of the cities. In the following table, the population center is the largest city (or cities) included in that township's population total, if it is of a significant size.
| Township | FIPS | Population center |
Population | Population density /km2 (/sq mi) |
Land area km2 (sq mi) | Water area km2 (sq mi) | Water % | Geographic coordinates |
|---|---|---|---|---|---|---|---|---|
| Banner | 04100 | 54 | 0.58 (1.50) | 93.29 (36.02) | 0 (0) | 0% | 39°42′3″N 98°47′13″W | |
| Beaver | 05200 | 60 | 0.65 (1.67) | 92.89 (35.86) | 0.27 (0.10) | 0.29% | 39°56′50″N 98°46′34″W | |
| Blaine | 07200 | 60 | 0.64 (1.67) | 93.24 (36.00) | 0.04 (0.01) | 0.04% | 39°47′20″N 98°40′48″W | |
| Cedar | 11350 | Kensington | 619 | 6.68 (17.29) | 92.71 (35.80) | 0.08 (0.03) | 0.09% | 39°46′10″N 99°1′50″W |
| Center | 12175 | Smith Center | 2,094 | 22.48 (58.22) | 93.15 (35.97) | 0.04 (0.02) | 0.05% | 39°46′47″N 98°47′7″W |
| Cora | 15525 | 38 | 0.41 (1.06) | 92.96 (35.89) | 0.17 (0.06) | 0.18% | 39°52′45″N 98°40′7″W | |
| Crystal Plains | 16575 | 40 | 0.43 (1.11) | 93.00 (35.91) | 0.05 (0.02) | 0.05% | 39°41′27″N 98°40′52″W | |
| Dor | 18300 | 46 | 0.50 (1.29) | 92.55 (35.73) | 0.30 (0.11) | 0.32% | 39°37′33″N 99°0′4″W | |
| Garfield | 25825 | 33 | 0.35 (0.92) | 92.96 (35.89) | 0.04 (0.02) | 0.04% | 39°35′48″N 98°40′21″W | |
| German | 26150 | 34 | 0.37 (0.96) | 91.78 (35.44) | 0.27 (0.10) | 0.29% | 39°56′41″N 99°0′39″W | |
| Harlan | 30100 | 100 | 1.07 (2.78) | 93.03 (35.92) | 0.05 (0.02) | 0.05% | 39°36′25″N 98°46′42″W | |
| Harvey | 30550 | Cedar | 130 | 1.40 (3.63) | 92.86 (35.85) | 0.00 (0.00) | 0% | 39°41′10″N 98°55′32″W |
| Houston | 33225 | Gaylord | 206 | 2.22 (5.74) | 92.94 (35.88) | 0.14 (0.05) | 0.15% | 39°37′38″N 98°52′12″W |
| Lane | 38450 | Athol | 134 | 1.44 (3.73) | 92.98 (35.90) | 0.03 (0.01) | 0.04% | 39°46′49″N 98°53′30″W |
| Lincoln | 41200 | 73 | 0.79 (2.04) | 92.80 (35.83) | 0.15 (0.06) | 0.16% | 39°36′13″N 98°33′23″W | |
| Logan | 42275 | 47 | 0.51 (1.32) | 92.50 (35.72) | 0.14 (0.05) | 0.15% | 39°57′5″N 98°34′4″W | |
| Martin | 45000 | 24 | 0.26 (0.67) | 92.49 (35.71) | 0.25 (0.10) | 0.27% | 39°56′40″N 98°54′21″W | |
| Oak | 51650 | Lebanon | 399 | 4.30 (11.13) | 92.88 (35.86) | 0.07 (0.03) | 0.07% | 39°48′10″N 98°33′29″W |
| Pawnee | 54825 | 35 | 0.38 (0.98) | 92.13 (35.57) | 0.41 (0.16) | 0.44% | 39°57′7″N 98°39′50″W | |
| Pleasant | 56300 | 34 | 0.37 (0.95) | 92.69 (35.79) | 0.05 (0.02) | 0.05% | 39°51′28″N 98°54′28″W | |
| Swan | 69625 | 42 | 0.46 (1.18) | 92.00 (35.52) | 0.23 (0.09) | 0.25% | 39°52′56″N 99°1′12″W | |
| Valley | 73175 | 75 | 0.81 (2.09) | 92.82 (35.84) | 0.015 (0.006) | 0.02% | 39°41′28″N 98°59′59″W | |
| Washington | 75775 | 63 | 0.68 (1.76) | 92.87 (35.86) | 0 (0) | 0% | 39°52′54″N 98°46′24″W | |
| Webster | 76275 | 47 | 0.51 (1.31) | 92.76 (35.82) | 0.02 (0.01) | 0.02% | 39°42′27″N 98°34′8″W | |
| White Rock | 78000 | 49 | 0.53 (1.37) | 92.88 (35.86) | 0.04 (0.02) | 0.04% | 39°52′37″N 98°33′5″W |
See also
|
|
References
- https://www.census.gov/quickfacts/fact/table/smithcountykansas/PST045218
- "State & County QuickFacts". United States Census Bureau. Retrieved July 29, 2014.
- "Find a County". National Association of Counties. Retrieved 2011-06-07.
- "Population and Geographic Centers" (PDF). www.census.gov. Retrieved March 6, 2014.
- Kansas Historical Society (October 2015). "Smith County, Kansas". Kansapedia. Retrieved 21 May 2019.
- Kansas Historical Society (December 2014). "Brewster Higley". Kansapedia. Retrieved 21 May 2019.
- "US Gazetteer files: 2010, 2000, and 1990". United States Census Bureau. 2011-02-12. Retrieved 2011-04-23.
- Geographic Center of the Lower 48 United States
- "Population and Housing Unit Estimates". Retrieved November 29, 2019.
- "U.S. Decennial Census". United States Census Bureau. Retrieved July 29, 2014.
- "Historical Census Browser". University of Virginia Library. Retrieved July 29, 2014.
- "Population of Counties by Decennial Census: 1900 to 1990". United States Census Bureau. Retrieved July 29, 2014.
- "Census 2000 PHC-T-4. Ranking Tables for Counties: 1990 and 2000" (PDF). United States Census Bureau. Retrieved July 29, 2014.
- "U.S. Census website". United States Census Bureau. Retrieved 2008-01-31.
- http://uselectionatlas.org/RESULTS
- "Map of Wet and Dry Counties". Alcoholic Beverage Control, Kansas Department of Revenue. November 2006. Archived from the original on 2007-10-08. Retrieved 2007-12-26.
Further reading
- Standard Atlas of Smith County, Kansas; Geo. A. Ogle & Co; 82 pages; 1917.
- Plat Book of Smith County, Kansas; North West Publishing Co; 48 pages; 1900.
External links
| Wikimedia Commons has media related to Smith County, Kansas. |
- County
- Other
- Maps
- Smith County Maps: Current, Historic, KDOT
- Kansas Highway Maps: Current, Historic, KDOT
- Kansas Railroad Maps: Current, 1996, 1915, KDOT and Kansas Historical Society
Places adjacent to Smith County, Kansas | ||||||||||
|---|---|---|---|---|---|---|---|---|---|---|
| ||||||||||
Municipalities and communities of Smith County, Kansas, United States | ||
|---|---|---|
| Cities | Map of Kansas highlighting Smith County | |
| Unincorporated communities | ||
| Ghost towns | ||
| ||
| Authority control |
|---|