Sheridan County, Kansas
Sheridan County (standard abbreviation: SD) is a county located in the U.S. state of Kansas. As of the 2010 census, the county population was 2,556.[1] Its county seat is Hoxie.[2] The county was named in honor of Phillip H. Sheridan, a general of the American Civil War era.
Sheridan County | |
|---|---|
.jpg.webp) The Buffalo Hunters' Home in Sheridan. Photo taken in 1873 | |
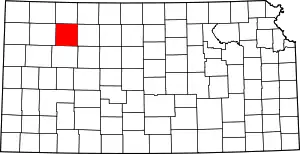 Location within the U.S. state of Kansas | |
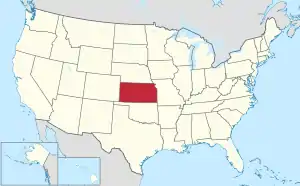 Kansas's location within the U.S. | |
| Coordinates: 39°21′N 100°26′W | |
| Country | |
| State | |
| Founded | 1873 |
| Named for | Philip Sheridan |
| Seat | Hoxie |
| Largest city | Hoxie |
| Area | |
| • Total | 896 sq mi (2,320 km2) |
| • Land | 896 sq mi (2,320 km2) |
| • Water | 0.3 sq mi (0.8 km2) 0.03% |
| Population (2010) | |
| • Total | 2,556 |
| • Estimate (2018) | 2,533 |
| • Density | 2.9/sq mi (1.1/km2) |
| Time zone | UTC−6 (Central) |
| • Summer (DST) | UTC−5 (CDT) |
| Congressional district | 1st |
| Website | County Website |

History
Early history
For many millennia, the Great Plains of North America was inhabited by nomadic Native Americans. From the 16th century to 18th century, the Kingdom of France claimed ownership of large parts of North America. In 1762, after the French and Indian War, France secretly ceded New France to Spain, per the Treaty of Fontainebleau.
19th century
In 1802, Spain returned most of the land to France while keeping title to about 7,500 square miles. In 1803, most of the land for modern day Kansas was acquired by the United States from France as part of the 828,000 square miles Louisiana Purchase for 2.83 cents per acre.
In 1854, the Kansas Territory was organized, then in 1861 Kansas became the 34th U.S. state. In 1873, the remaining unorganized western part of the state was divided into 22 new counties, including Sheridan County.[3] Sheridan County was then organized in 1880, with the county seat at Kenneth.[4] After it became apparent in 1886, that the railroad line coming to the area would run south of Kenneth to the new town of Hoxie, the residents of Kenneth accepted an offer to get new lots in Hoxie (and move their buildings at no expense), and the county seat transferred to Hoxie. The Lincoln-Colorado railroad line opened through the county in 1888, and formally became part of the Union Pacific Railroad in the late 1890s.
20th century
The population of Sheridan County grew in the early 20th century and peaked in 1930 at 6,038 residents. Since then the population has steadily declined, as part of the general depopulation of the Great Plains.
The rail line stayed in operation in Sheridan County until 1998. After flooding east of Plainville in the 1993 floods damaged the line, the railroad concluded it would not be cost effective to rebuild, and the entire line from Plainville to Colby was abandoned by 1998.[5][6]
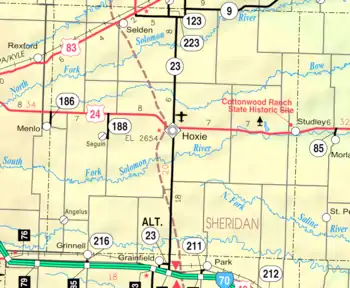
Geography
According to the U.S. Census Bureau, the county has a total area of 896 square miles (2,320 km2), of which 896 square miles (2,320 km2) is land and 0.3 square miles (0.78 km2) (0.03%) is water.[7]
Adjacent counties
- Decatur County (north)
- Norton County (northeast)
- Graham County (east)
- Gove County (south)
- Thomas County (west)
Demographics
| Historical population | |||
|---|---|---|---|
| Census | Pop. | %± | |
| 1880 | 1,567 | — | |
| 1890 | 3,733 | 138.2% | |
| 1900 | 3,819 | 2.3% | |
| 1910 | 5,651 | 48.0% | |
| 1920 | 5,484 | −3.0% | |
| 1930 | 6,038 | 10.1% | |
| 1940 | 5,312 | −12.0% | |
| 1950 | 4,607 | −13.3% | |
| 1960 | 4,267 | −7.4% | |
| 1970 | 3,859 | −9.6% | |
| 1980 | 3,544 | −8.2% | |
| 1990 | 3,043 | −14.1% | |
| 2000 | 2,813 | −7.6% | |
| 2010 | 2,556 | −9.1% | |
| 2018 (est.) | 2,533 | [8] | −0.9% |
| U.S. Decennial Census[9] 1790-1960[10] 1900-1990[11] 1990-2000[12] 2010-2016[1] | |||
As of the census[13] of 2000, there were 2,813 people, 1,124 households, and 795 families residing in the county. The population density was 3 people per square mile (1/km2). There were 1,263 housing units at an average density of 1 per square mile (1/km2). The racial makeup of the county was 98.65% White, 0.14% Black or African American, 0.07% Native American, 0.07% Asian, 0.14% Pacific Islander, 0.36% from other races, and 0.57% from two or more races. 1.46% of the population were Hispanic or Latino of any race.
There were 1,124 households, out of which 30.40% had children under the age of 18 living with them, 63.80% were married couples living together, 4.50% had a female householder with no husband present, and 29.20% were non-families. 27.60% of all households were made up of individuals, and 14.80% had someone living alone who was 65 years of age or older. The average household size was 2.46 and the average family size was 3.01.
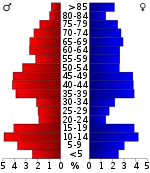
In the county, the population was spread out, with 26.30% under the age of 18, 5.80% from 18 to 24, 23.70% from 25 to 44, 23.90% from 45 to 64, and 20.30% who were 65 years of age or older. The median age was 42 years. For every 100 females there were 100.10 males. For every 100 females age 18 and over, there were 95.80 males.
The median income for a household in the county was $33,547, and the median income for a family was $38,292. Males had a median income of $26,351 versus $16,250 for females. The per capita income for the county was $16,299. About 12.00% of families and 15.70% of the population were below the poverty line, including 27.30% of those under age 18 and 5.50% of those age 65 or over.
Government
Presidential elections
| Year | Republican | Democratic | Third Parties |
|---|---|---|---|
| 2016 | 87.1% 1,197 | 9.2% 127 | 3.6% 50 |
| 2012 | 86.0% 1,154 | 12.5% 168 | 1.5% 20 |
| 2008 | 80.5% 1,108 | 18.5% 254 | 1.0% 14 |
| 2004 | 81.4% 1,144 | 17.0% 239 | 1.6% 23 |
| 2000 | 76.0% 1,132 | 18.9% 281 | 5.1% 76 |
| 1996 | 74.2% 1,053 | 18.6% 264 | 7.3% 103 |
| 1992 | 45.2% 739 | 21.2% 347 | 33.6% 550 |
| 1988 | 57.9% 901 | 38.6% 600 | 3.5% 55 |
| 1984 | 73.9% 1,274 | 24.3% 419 | 1.9% 32 |
| 1980 | 71.0% 1,202 | 23.1% 391 | 5.9% 100 |
| 1976 | 49.2% 838 | 46.5% 793 | 4.3% 74 |
| 1972 | 64.4% 1,134 | 31.4% 552 | 4.3% 75 |
| 1968 | 58.4% 1,002 | 32.8% 563 | 8.9% 152 |
| 1964 | 43.8% 808 | 55.7% 1,028 | 0.6% 11 |
| 1960 | 51.9% 1,047 | 47.3% 954 | 0.7% 15 |
| 1956 | 67.4% 1,324 | 32.2% 633 | 0.4% 7 |
| 1952 | 73.9% 1,581 | 25.9% 555 | 0.2% 4 |
| 1948 | 52.7% 1,097 | 46.4% 966 | 0.9% 19 |
| 1944 | 66.9% 1,342 | 32.8% 658 | 0.4% 7 |
| 1940 | 62.1% 1,492 | 37.6% 903 | 0.4% 9 |
| 1936 | 40.3% 1,007 | 57.7% 1,442 | 2.1% 52 |
| 1932 | 32.4% 878 | 65.5% 1,773 | 2.1% 56 |
| 1928 | 60.5% 1,450 | 38.8% 930 | 0.7% 16 |
| 1924 | 59.1% 1,320 | 24.3% 542 | 16.6% 371 |
| 1920 | 69.5% 1,194 | 27.8% 477 | 2.7% 46 |
| 1916 | 37.5% 760 | 58.7% 1,189 | 3.8% 78 |
| 1912 | 18.2% 195 | 47.5% 509 | 34.3% 368 |
| 1908 | 48.9% 639 | 48.3% 631 | 2.8% 37 |
| 1904 | 57.9% 607 | 28.0% 293 | 14.1% 148 |
| 1900 | 46.3% 445 | 51.9% 499 | 1.8% 17 |
| 1896 | 40.5% 282 | 55.1% 384 | 4.5% 31 |
| 1892 | 41.1% 325 | 58.9% 466 | |
| 1888 | 62.0% 623 | 33.5% 337 | 4.5% 45 |
Sheridan County is overwhelmingly Republican. Since Michael Dukakis in the heavily drought-influenced 1988 election won almost 39 percent of the county's vote, no Democratic presidential candidate has topped 22 percent, and in 2016 Hillary Clinton’s share plummeted into single figures.
Laws
Although the Kansas Constitution was amended in 1986 to allow the sale of alcoholic liquor by the individual drink with the approval of voters, Sheridan County has remained a prohibition, or "dry", county.[15]
Education
Unified school districts
Communities
Townships
Sheridan County is divided into fourteen townships. None of the cities within the county are considered governmentally independent, and all figures for the townships include those of the cities. In the following table, the population center is the largest city (or cities) included in that township's population total, if it is of a significant size.
| Township | FIPS | Population center |
Population | Population density /km2 (/sq mi) |
Land area km2 (sq mi) | Water area km2 (sq mi) | Water % | Geographic coordinates |
|---|---|---|---|---|---|---|---|---|
| Adell | 00300 | 13 | 0 (0) | 140 (54) | 0 (0) | 0.01% | 39°30′58″N 100°14′13″W | |
| Bloomfield | 07450 | 45 | 0 (1) | 93 (36) | 0 (0) | 0% | 39°26′8″N 100°39′52″W | |
| Bowcreek | 08125 | 54 | 0 (1) | 186 (72) | 0 (0) | 0% | 39°25′48″N 100°17′2″W | |
| East Saline | 19675 | 66 | 0 (1) | 186 (72) | 0 (0) | 0.03% | 39°11′50″N 100°12′38″W | |
| Kenneth | 36525 | Hoxie | 1,430 | 15 (40) | 93 (36) | 0 (0) | 0% | 39°21′16″N 100°26′24″W |
| Logan | 42225 | 115 | 1 (2) | 187 (72) | 0 (0) | 0.04% | 39°21′26″N 100°37′4″W | |
| Parnell | 54650 | 104 | 1 (1) | 185 (71) | 0 (0) | 0.03% | 39°25′33″N 100°30′57″W | |
| Prairie Dog | 57500 | 71 | 1 (2) | 93 (36) | 0 (0) | 0.03% | 39°31′27″N 100°40′15″W | |
| Sheridan | 64750 | 269 | 2 (5) | 138 (53) | 0 (0) | 0.05% | 39°31′40″N 100°32′38″W | |
| Solomon | 66400 | 248 | 1 (2) | 279 (108) | 0 (0) | 0.04% | 39°13′54″N 100°38′0″W | |
| Springbrook | 67350 | 108 | 0 (1) | 279 (108) | 0 (0) | 0.01% | 39°13′38″N 100°28′15″W | |
| Union | 72400 | 60 | 1 (2) | 92 (36) | 0 (0) | 0% | 39°31′52″N 100°22′35″W | |
| Valley | 73150 | 139 | 1 (2) | 186 (72) | 0 (0) | 0.09% | 39°21′0″N 100°16′5″W | |
| West Saline | 77375 | 91 | 0 (1) | 186 (72) | 0 (0) | 0.02% | 39°12′44″N 100°20′28″W |
See also
|
|
References
- "State & County QuickFacts". United States Census Bureau. Retrieved July 29, 2014.
- "Find a County". National Association of Counties. Retrieved 2011-06-07.
- Transactions of the Kansas State Historical Society, 1903-1904 (1904)
- Cutler, William G. History of the State of Kansas (1883)
- Surfact Transportation Board Decision, Docket No. AB-33, March 21, 1997, STB.gov, Retrieved 23 October 2017
- The Plainville Branch, Abandonedrails.com, Retrieved 23 October 2017
- "US Gazetteer files: 2010, 2000, and 1990". United States Census Bureau. 2011-02-12. Retrieved 2011-04-23.
- "Population and Housing Unit Estimates". Retrieved December 2, 2019.
- "U.S. Decennial Census". United States Census Bureau. Retrieved July 29, 2014.
- "Historical Census Browser". University of Virginia Library. Retrieved July 29, 2014.
- "Population of Counties by Decennial Census: 1900 to 1990". United States Census Bureau. Retrieved July 29, 2014.
- "Census 2000 PHC-T-4. Ranking Tables for Counties: 1990 and 2000" (PDF). United States Census Bureau. Retrieved July 29, 2014.
- "U.S. Census website". United States Census Bureau. Retrieved 2008-01-31.
- http://uselectionatlas.org/RESULTS
- "Map of Wet and Dry Counties". Alcoholic Beverage Control, Kansas Department of Revenue. November 2004. Archived from the original on 2007-10-08. Retrieved 2007-01-21.
Further reading
- Standard Atlas of Sheridan County, Kansas; Geo. A. Ogle & Co; 58 pages; 1907.
External links
| Wikimedia Commons has media related to Sheridan County, Kansas. |
- County
- Other
- Maps
- Sheridan County Maps: Current, Historic, KDOT
- Kansas Highway Maps: Current, Historic, KDOT
- Kansas Railroad Maps: Current, 1996, 1915, KDOT and Kansas Historical Society
Places adjacent to Sheridan County, Kansas | ||||||||||
|---|---|---|---|---|---|---|---|---|---|---|
| ||||||||||
Municipalities and communities of Sheridan County, Kansas, United States | ||
|---|---|---|
| Cities | Map of Kansas highlighting Sheridan County | |
| Unincorporated communities | ||
| Ghost towns | ||
| Townships | ||
| ||
| Authority control |
|---|