Atchison County, Kansas
Atchison County (county code AT) is a county located in northeastern Kansas, in the Central United States. As of the 2010 census, the county population was 16,924.[1] Its county seat and most populous city is Atchison.[2] The county is named in honor of David Rice Atchison, a United States Senator from Missouri.[3]
Atchison County | |
|---|---|
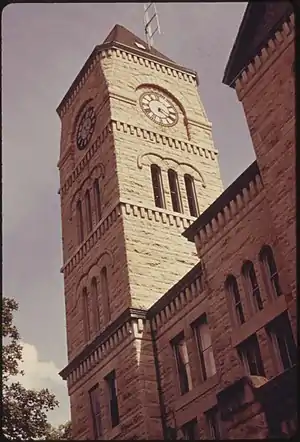 Atchison County Courthouse in Atchison | |
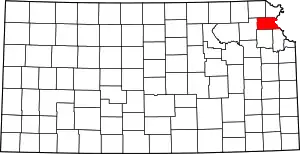 Location within the U.S. state of Kansas | |
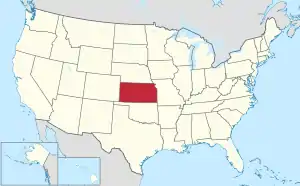 Kansas's location within the U.S. | |
| Coordinates: | |
| Country | |
| State | |
| Founded | August 25, 1855 |
| Named for | David Rice Atchison |
| Seat | Atchison |
| Largest city | Atchison |
| Area | |
| • Total | 434 sq mi (1,120 km2) |
| • Land | 431 sq mi (1,120 km2) |
| • Water | 2.6 sq mi (7 km2) 0.6%% |
| Population | |
| • Estimate (2018) | 16,193 |
| • Density | 39/sq mi (15/km2) |
| Time zone | UTC−6 (Central) |
| • Summer (DST) | UTC−5 (CDT) |
| Area code | 913 |
| Congressional district | 2nd |
| Website | AtchisonCountyKS.org |
History
Early history
For many millennia, the Great Plains of North America was inhabited by nomadic Native Americans. From the 16th century to 18th century, the Kingdom of France claimed ownership of large parts of North America. In 1762, after the French and Indian War, France secretly ceded New France to Spain, per the Treaty of Fontainebleau.
19th century
In 1802, Spain returned most of the land to France, but keeping title to about 7,500 square miles. In 1803, most of the land for modern day Kansas was acquired by the United States from France as part of the 828,000 square mile Louisiana Purchase for 2.83 cents per acre.
In 1854, the Kansas Territory was organized, then in 1861 Kansas became the 34th U.S. state. In 1855, Atchison County was established.
Geography
According to the U.S. Census Bureau, the county has a total area of 434 square miles (1,120 km2), of which 431 square miles (1,120 km2) is land and 2.6 square miles (6.7 km2) (0.6%) is water.[4] It is the fourth-smallest county by area in Kansas.
On July 4, 1804, to mark Independence Day, the Lewis and Clark Expedition named Independence Creek (River) located near the city of Atchison (see Timeline of the Lewis and Clark Expedition).
Adjacent counties
- Doniphan County (north)
- Buchanan County, Missouri (northeast)
- Leavenworth County (southeast)
- Platte County, Missouri (east)
- Jefferson County (south)
- Jackson County (west)
- Brown County (northwest)
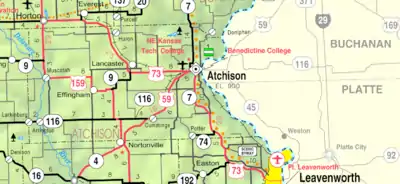
Major highways
Demographics
| Historical population | |||
|---|---|---|---|
| Census | Pop. | %± | |
| 1860 | 7,729 | — | |
| 1870 | 15,507 | 100.6% | |
| 1880 | 26,668 | 72.0% | |
| 1890 | 26,758 | 0.3% | |
| 1900 | 28,606 | 6.9% | |
| 1910 | 28,107 | −1.7% | |
| 1920 | 23,411 | −16.7% | |
| 1930 | 23,945 | 2.3% | |
| 1940 | 22,222 | −7.2% | |
| 1950 | 21,496 | −3.3% | |
| 1960 | 20,898 | −2.8% | |
| 1970 | 19,165 | −8.3% | |
| 1980 | 18,397 | −4.0% | |
| 1990 | 16,932 | −8.0% | |
| 2000 | 16,774 | −0.9% | |
| 2010 | 16,924 | 0.9% | |
| 2016 (est.) | 16,380 | [7] | −3.2% |
| U.S. Decennial Census[8] 1790-1960[9] 1900-1990[10] 1990-2000[11] 2010-2016[1] | |||
Atchison County comprises the Atchison, KS Micropolitan Statistical Area, which is also included in the Kansas City-Overland Park-Kansas City, MO-KS Combined Statistical Area.
As of the 2000 census,[12] there were 16,774 people, 6,275 households, and 4,279 families residing in the county. The population density was 39 people per square mile (15/km2). There were 6,818 housing units at an average density of 16 per square mile (6/km2). The racial makeup of the county was 91.62% White, 5.32% Black or African American, 0.55% Native American, 0.34% Asian, 0.06% Pacific Islander, 0.51% from other races, and 1.59% from two or more races. Hispanic or Latino of any race were 1.95% of the population.
There were 6,275 households, out of which 32.40% had children under the age of 18 living with them, 54.30% were married couples living together, 10.00% had a female householder with no husband present, and 31.80% were non-families. 27.60% of all households were made up of individuals, and 12.80% had someone living alone who was 65 years of age or older. The average household size was 2.51 and the average family size was 3.05.
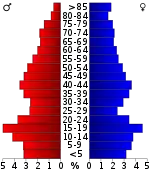
In the county, the population was spread out, with 26.70% under the age of 18, 11.30% from 18 to 24, 24.50% from 25 to 44, 21.40% from 45 to 64, and 16.20% who were 65 years of age or older. The median age was 36 years. For every 100 females there were 93.30 males. For every 100 females age 18 and over, there were 90.30 males.
The median income for a household in the county was $34,355, and the median income for a family was $40,614. Males had a median income of $29,481 versus $20,485 for females. The per capita income for the county was $15,207. About 7.90% of families and 13.30% of the population were below the poverty line, including 13.80% of those under age 18 and 17.90% of those age 65 or over.
Government
Presidential elections
Atchison County has been a swing county for most of its history. It has had multiple extended streaks of being a bellwether county, the first running from 1896 to 1936. After voting more Republican than the nation in the 1940s & voting for losing candidate Richard Nixon in 1960, another bellwether streak ran from 1964 to 2004. Since then, the county has become significantly more Republican, with Barack Obama failing to win the county in both of his victories & Hillary Clinton losing it by over 30 percent to Donald Trump in 2016.
| Year | Republican | Democratic | Third Parties |
|---|---|---|---|
| 2016 | 61.6% 4,049 | 30.3% 1,989 | 8.2% 537 |
| 2012 | 58.7% 3,917 | 38.5% 2,567 | 2.9% 190 |
| 2008 | 52.7% 3,791 | 45.1% 3,241 | 2.2% 159 |
| 2004 | 54.5% 3,880 | 43.8% 3,120 | 1.7% 118 |
| 2000 | 49.0% 3,378 | 46.0% 3,171 | 5.1% 351 |
| 1996 | 43.3% 2,828 | 44.8% 2,926 | 12.0% 784 |
| 1992 | 33.5% 2,521 | 39.3% 2,959 | 27.2% 2,050 |
| 1988 | 49.0% 3,243 | 48.0% 3,177 | 2.9% 194 |
| 1984 | 62.5% 4,537 | 36.4% 2,641 | 1.1% 77 |
| 1980 | 53.9% 4,084 | 40.4% 3,063 | 5.7% 434 |
| 1976 | 48.3% 4,030 | 49.2% 4,108 | 2.5% 206 |
| 1972 | 67.8% 5,471 | 29.8% 2,404 | 2.4% 191 |
| 1968 | 46.0% 3,644 | 42.7% 3,379 | 11.4% 899 |
| 1964 | 38.2% 3,147 | 61.2% 5,037 | 0.6% 45 |
| 1960 | 52.3% 4,793 | 47.3% 4,336 | 0.3% 31 |
| 1956 | 64.1% 5,608 | 35.8% 3,134 | 0.1% 9 |
| 1952 | 64.6% 6,004 | 35.3% 3,283 | 0.1% 9 |
| 1948 | 51.0% 4,141 | 48.2% 3,910 | 0.8% 62 |
| 1944 | 58.6% 4,731 | 41.2% 3,325 | 0.3% 20 |
| 1940 | 56.1% 5,921 | 43.2% 4,557 | 0.8% 82 |
| 1936 | 47.6% 5,312 | 52.1% 5,817 | 0.3% 31 |
| 1932 | 45.2% 4,778 | 53.3% 5,640 | 1.5% 157 |
| 1928 | 63.7% 6,647 | 36.0% 3,756 | 0.4% 37 |
| 1924 | 63.8% 6,246 | 22.5% 2,199 | 13.7% 1,341 |
| 1920 | 65.0% 5,872 | 34.1% 3,082 | 0.9% 77 |
| 1916 | 48.6% 4,624 | 48.7% 4,634 | 2.7% 254 |
| 1912 | 27.4% 1,535 | 43.7% 2,449 | 28.9% 1,618 |
| 1908 | 54.9% 3,244 | 43.9% 2,593 | 1.2% 68 |
| 1904 | 64.3% 3,542 | 33.6% 1,854 | 2.1% 117 |
| 1900 | 55.5% 3,390 | 43.9% 2,682 | 0.5% 32 |
| 1896 | 52.7% 3,326 | 46.9% 2,963 | 0.4% 28 |
| 1892 | 49.2% 2,666 | 50.8% 2,756 | |
| 1888 | 52.1% 3,219 | 42.1% 2,603 | 5.8% 357 |
Laws
Atchison County was a prohibition, or "dry", county until the Kansas Constitution was amended in 1986 and voters approved the sale of alcoholic liquor by the individual drink with a 30% food sales requirement.[14]
Education
Unified school districts
- Atchison County USD 377 (Web site)
- Atchison USD 409
Communities
Unincorporated communities
- Arrington
- Cummings
- Curlew
- Eden
- Farmington
- Good Intent
- Hawthorn
- Kennekuk
- Larkinburg
- Monrovia
- Mount Pleasant[15]
- Oak Mills
- Pardee
- Parnell
- Port William
- Potter
- St. Pats
- Shannon
- Sumner[16]
Townships
Atchison County is divided into eight townships. The city of Atchison is considered governmentally independent and is excluded from the census figures for the townships. In the following table, the population center is the largest city (or cities) included in that township's population total, if it is of a significant size.
| Township | FIPS | Population center |
Population | Population density /km2 (/sq mi) |
Land area km2 (sq mi) | Water area km2 (sq mi) | Water % | Geographic coordinates |
|---|---|---|---|---|---|---|---|---|
| Benton | 06150 | Effingham | 1,076 | 7 (18) | 156 (60) | 0 (0) | 0.25% | 39°30′20″N 95°23′37″W |
| Center | 11550 | 676 | 5 (13) | 139 (54) | 0 (0) | 0.15% | 39°28′52″N 95°16′54″W | |
| Grasshopper | 28225 | Muscotah | 588 | 3 (9) | 170 (66) | 1 (0) | 0.52% | 39°35′12″N 95°30′4″W |
| Kapioma | 36100 | 271 | 2 (6) | 123 (48) | 0 (0) | 0.05% | 39°29′6″N 95°31′8″W | |
| Lancaster | 38350 | Lancaster | 922 | 6 (15) | 156 (60) | 0 (0) | 0.28% | 39°35′56″N 95°18′38″W |
| Mount Pleasant | 48925 | 829 | 7 (17) | 124 (48) | 0 (0) | 0.09% | 39°29′17″N 95°11′3″W | |
| Shannon | 64275 | 1,753 | 12 (32) | 140 (54) | 2 (1) | 1.16% | 39°35′15″N 95°9′26″W | |
| Walnut | 74800 | 427 | 5 (12) | 94 (36) | 2 (1) | 2.34% | 39°27′55″N 95°5′3″W | |
| Sources: "Census 2000 U.S. Gazetteer Files". U.S. Census Bureau, Geography Division. Archived from the original on 2002-08-02. | ||||||||
See also
|
|
References
- "State & County QuickFacts". United States Census Bureau. Archived from the original on July 6, 2011. Retrieved July 21, 2014.
- "Find a County". National Association of Counties. Archived from the original on 2011-05-31. Retrieved 2011-06-07.
- "Profile for Atchison County, Kansas". ePodunk. Retrieved 4 June 2014.
- "US Gazetteer files: 2010, 2000, and 1990". United States Census Bureau. 2011-02-12. Retrieved 2011-04-23.
- National Atlas Archived December 5, 2008, at the Wayback Machine
- U.S. Census Bureau TIGER shape files
- "Population and Housing Unit Estimates". Retrieved June 9, 2017.
- "U.S. Decennial Census". United States Census Bureau. Retrieved July 21, 2014.
- "Historical Census Browser". University of Virginia Library. Retrieved July 21, 2014.
- "Population of Counties by Decennial Census: 1900 to 1990". United States Census Bureau. Retrieved July 21, 2014.
- "Census 2000 PHC-T-4. Ranking Tables for Counties: 1990 and 2000" (PDF). United States Census Bureau. Retrieved July 21, 2014.
- "U.S. Census website". United States Census Bureau. Retrieved 2008-01-31.
- http://uselectionatlas.org/RESULTS
- "Map of Wet and Dry Counties". Alcoholic Beverage Control, Kansas Department of Revenue. November 2004. Archived from the original on 2007-10-08. Retrieved 2007-01-21.
- Ingalls, Sheffield (1916). History of Atchison County, Kansas. Standard Publishing Company. pp. 127.
- Ingalls, Sheffield (1916). History of Atchison County, Kansas. Standard Publishing Company. pp. 85.
Further reading
- Standard Atlas of Atchison County, Kansas; Geo. A. Ogle & Co; 40 pages; 1903.
External links
| Wikimedia Commons has media related to Atchison County, Kansas. |
- Official sites
- Atchison County - Official
- Atchison County - Directory of Public Officials
- Atchison County - Chamber of Commerce
- Historical
- Atchison County - History, Kansas State Historical Society
- Atchison County - Historical Society
- Maps
- Atchison County Maps: Current, Historic, KDOT
- Kansas Highway Maps: Current, Historic, KDOT
- Kansas Railroad Maps: Current, 1996, 1915, KDOT and Kansas Historical Society
Places adjacent to Atchison County, Kansas | |
|---|---|
Municipalities and communities of Atchison County, Kansas, United States | ||
|---|---|---|
| Cities | Map of Kansas highlighting Atchison County | |
| Unincorporated communities | ||
| Indian reservations | ||
| Townships | ||
| Ghost towns | ||
| Footnotes | ‡This populated place also has portions in an adjacent county or counties | |
| ||
| Authority control |
|---|