Sedgwick County, Kansas
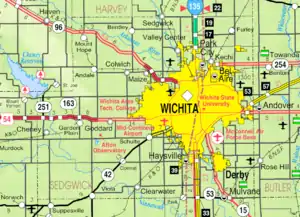
Sedgwick County (county code: SG) is located in the U.S. state of Kansas. The county seat is Wichita,[1] the most populous city in the state. As of the 2010 census, the population was 498,365 with a 2019 estimate of 516,042[2][3] making it the second most populous county in Kansas.
Sedgwick County | |
|---|---|
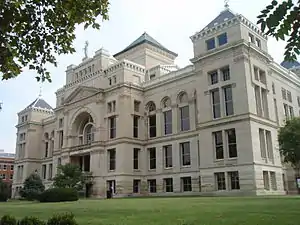 Old Sedgwick County Courthouse in Wichita (2009) | |
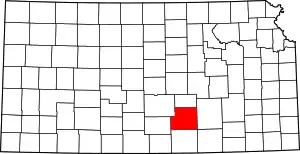 Location within the U.S. state of Kansas | |
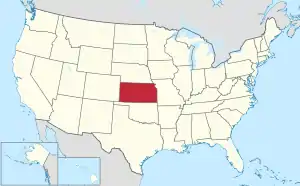 Kansas's location within the U.S. | |
| Coordinates: 37°43′00″N 97°27′00″W | |
| Country | |
| State | |
| Founded | February 26, 1867 |
| Named for | John Sedgwick |
| Seat | Wichita |
| Largest city | Wichita |
| Area | |
| • Total | 1,009 sq mi (2,610 km2) |
| • Land | 998 sq mi (2,580 km2) |
| • Water | 12 sq mi (30 km2) 1.2% |
| Population (2010) | |
| • Total | 498,365 |
| • Estimate (2019) | 516,042 |
| • Density | 490/sq mi (190/km2) |
| Time zone | UTC−6 (Central) |
| • Summer (DST) | UTC−5 (CDT) |
| Congressional district | 4th |
| Website | sedgwickcounty.org |
History
Early history
For many millennia, the Great Plains of North America was inhabited by nomadic Native Americans. From the 16th century to 18th century, the Kingdom of France claimed ownership of large parts of North America. In 1762, after the French and Indian War, France secretly ceded New France to Spain, per the Treaty of Fontainebleau. In 1802, Spain returned most of the land to France.
In 1803, most of the land for modern day Kansas was acquired by the United States from France as part of the 828,000 square mile Louisiana Purchase for 2.83 cents per acre. In 1848, after the Mexican–American War, the Treaty of Guadalupe Hidalgo with Spain brought into the United States all or part of land for ten future states, including southwest Kansas. In 1854, the Kansas Territory was organized, then in 1861 Kansas became the 34th U.S. state.
19th century
Sedgwick County was founded in 1867, and named after John Sedgwick, who was a major general in the Union Army during the American Civil War.[4]
In 1887, the Chicago, Kansas and Nebraska Railway built a branch line north–south from Herington to Caldwell.[5] This branch line connected Herington, Lost Springs, Lincolnville, Antelope, Marion, Aulne, Peabody, Elbing, Whitewater, Furley, Kechi, Wichita, Peck, Corbin, Wellington, Caldwell. By 1893, this branch line was incrementally built to Fort Worth, Texas. This line is called the "OKT". The Chicago, Kansas and Nebraska Railway was foreclosed in 1891 and was taken over by Chicago, Rock Island and Pacific Railway, which shut down in 1980 and reorganized as Oklahoma, Kansas and Texas Railroad, merged in 1988 with Missouri Pacific Railroad, and finally merged in 1997 with Union Pacific Railroad. Most locals still refer to this railroad as the "Rock Island".
20th century
Sedgwick County was the setting for the murders committed by the BTK strangler from 1974 until 1991. Dennis Rader, an employee of the Sedgwick County city of Park City was arrested in early 2005 after he began sending incriminating letters taunting the police in 2004. He had not been heard from since 1979. Ken Landwehr of the Wichita Police Department led the task force which captured Rader, setting a new standard of serial crime detection in the process, which is still studied by police departments across the world. Rader is serving 10 life sentences at the El Dorado Correctional Facility in El Dorado.
Geography
According to the U.S. Census Bureau, the county has a total area of 1,009 square miles (2,610 km2), of which 998 square miles (2,580 km2) is land and 12 square miles (31 km2) (1.2%) is water.[6]
Adjacent counties
- Harvey County (north)
- Butler County (east)
- Cowley County (southeast)
- Sumner County (south)
- Kingman County (west)
- Reno County (northwest)
Demographics
| Historical population | |||
|---|---|---|---|
| Census | Pop. | %± | |
| 1870 | 1,095 | — | |
| 1880 | 18,753 | 1,612.6% | |
| 1890 | 43,626 | 132.6% | |
| 1900 | 44,037 | 0.9% | |
| 1910 | 73,095 | 66.0% | |
| 1920 | 92,234 | 26.2% | |
| 1930 | 136,330 | 47.8% | |
| 1940 | 143,311 | 5.1% | |
| 1950 | 222,290 | 55.1% | |
| 1960 | 343,231 | 54.4% | |
| 1970 | 350,694 | 2.2% | |
| 1980 | 366,531 | 4.5% | |
| 1990 | 403,662 | 10.1% | |
| 2000 | 452,869 | 12.2% | |
| 2010 | 498,365 | 10.0% | |
| 2019 (est.) | 516,042 | [7] | 3.5% |
| U.S. Decennial Census[8] 1790-1960[9] 1900–1990[10] 1990-2000[11] 2010–2019[3] | |||
Sedgwick County is part of the Wichita, KS Metropolitan Statistical Area.
As of the census[12] of 2000, there were 452,869 people, 176,444 households, and 117,688 families residing in the county. The population density was 453 people per square mile (175/km2). There were 191,133 housing units at an average density of 191 per square mile (74/km2). The racial makeup of the county was 79.38% White, 9.13% Black or African American, 1.11% Native American, 3.34% Asian, 0.06% Pacific Islander, 4.17% from other races, and 2.81% from two or more races. 8.04% of the population were Hispanic or Latino of any race.
There were 176,444 households, out of which 34.40% had children under the age of 18 living with them, 51.70% were married couples living together, 10.90% had a female householder with no husband present, and 33.30% were non-families. 28.20% of all households were made up of individuals, and 8.70% had someone living alone who was 65 years of age or older. The average household size was 2.53 and the average family size was 3.14.
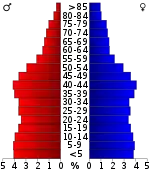
In the county, the population was spread out, with 28.20% under the age of 18, 9.50% from 18 to 24, 30.30% from 25 to 44, 20.60% from 45 to 64, and 11.40% who were 65 years of age or older. The median age was 34 years. For every 100 females, there were 97.80 males. For every 100 females age 18 and over, there were 95.20 males.
The median income for a household in the county was $42,485, and the median income for a family was $51,645. Males had a median income of $37,770 versus $26,153 for females. The per capita income for the county was $20,907. About 7.00% of families and 9.50% of the population were below the poverty line, including 11.90% of those under age 18 and 7.00% of those age 65 or over.
Economy
It is the birthplace of famous restaurants such as White Castle and Pizza Hut.[13][14] It is also the aviation headquarters of well known Cessna and Learjet.[15][16]
Government
Presidential elections
| Year | Republican | Democratic | Third Parties |
|---|---|---|---|
| 2020 | 54.7% 122,416 | 42.9% 95,870 | 2.4% 5,402 |
| 2016 | 54.4% 104,353 | 36.3% 69,627 | 9.3% 17,818 |
| 2012 | 58.2% 106,506 | 39.4% 71,977 | 2.4% 4,412 |
| 2008 | 55.2% 106,849 | 42.5% 82,337 | 2.4% 4,544 |
| 2004 | 62.1% 110,381 | 36.5% 64,839 | 1.4% 2,459 |
| 2000 | 57.4% 93,724 | 38.3% 62,561 | 4.4% 7,132 |
| 1996 | 56.1% 93,397 | 35.8% 59,643 | 8.1% 13,559 |
| 1992 | 40.5% 75,577 | 33.6% 62,670 | 25.9% 48,228 |
| 1988 | 55.3% 86,124 | 42.1% 65,618 | 2.6% 4,003 |
| 1984 | 62.5% 95,874 | 36.1% 55,263 | 1.4% 2,178 |
| 1980 | 51.8% 75,317 | 37.9% 55,105 | 10.3% 15,009 |
| 1976 | 50.7% 69,828 | 46.5% 63,989 | 2.8% 3,812 |
| 1972 | 65.7% 83,949 | 30.7% 39,220 | 3.6% 4,532 |
| 1968 | 51.8% 60,853 | 37.5% 44,041 | 10.7% 12,575 |
| 1964 | 43.8% 52,592 | 55.2% 66,372 | 1.0% 1,217 |
| 1960 | 55.2% 73,501 | 44.3% 58,887 | 0.5% 696 |
| 1956 | 61.1% 72,292 | 38.6% 45,732 | 0.3% 336 |
| 1952 | 66.5% 70,983 | 32.7% 34,926 | 0.8% 879 |
| 1948 | 49.6% 39,165 | 48.9% 38,621 | 1.6% 1,243 |
| 1944 | 52.8% 38,896 | 46.7% 34,442 | 0.5% 360 |
| 1940 | 48.1% 32,160 | 51.1% 34,219 | 0.8% 547 |
| 1936 | 35.3% 21,654 | 64.4% 39,503 | 0.3% 197 |
| 1932 | 41.5% 21,815 | 55.8% 29,344 | 2.7% 1,435 |
| 1928 | 74.4% 32,132 | 24.7% 10,649 | 0.9% 405 |
| 1924 | 57.2% 21,144 | 23.6% 8,712 | 19.2% 7,087 |
| 1920 | 59.2% 16,642 | 39.1% 10,998 | 1.8% 494 |
| 1916 | 41.8% 10,899 | 51.3% 13,391 | 6.9% 1,792 |
| 1912 | 9.8% 1,419 | 39.6% 5,752 | 50.6% 7,350[lower-alpha 1] |
| 1908 | 50.3% 6,756 | 45.0% 6,049 | 4.8% 640 |
| 1904 | 60.8% 6,697 | 26.0% 2,869 | 13.2% 1,455 |
| 1900 | 50.0% 5,363 | 48.0% 5,144 | 2.0% 212 |
| 1896 | 42.7% 4,122 | 56.3% 5,434 | 1.1% 102 |
| 1892 | 46.7% 4,770 | 53.3% 5,448 | |
| 1888 | 55.5% 6,071 | 36.8% 4,025 | 7.7% 841 |
| 1884 | 53.5% 3,464 | 38.1% 2,467 | 8.3% 537 |
| 1880 | 57.1% 2,288 | 33.8% 1,354 | 9.0% 364 |
Sedgwick County is fairly conservative for an urban county. It has only gone Democratic in a presidential election once since 1944. Democratic strength is concentrated in Wichita, while the suburban areas are strongly Republican.
Laws
Sedgwick County was a prohibition, or "dry", county until the Kansas Constitution was amended in 1986 and voters approved the sale of alcoholic liquor by the individual drink with a 30 percent food sales requirement. The food sales requirement was removed with voter approval in 1988.[18]
Transportation
Airports
The following public-use airports are located in Sedgwick County:
- Wichita Dwight D. Eisenhower National Airport (ICT)
- Beech Factory Airport (BEC)
- Cessna Aircraft Field (CEA)
- Colonel James Jabara Airport (AAO)
- Cook Airfield (K50)
- Maize Airport (70K)
- Westport Airport (71K)
- Westport Auxiliary Airport (72K)
The following are closed airports:
- Riverside Airport (K32)
Education
Colleges and universities
Points of interest
Communities
Cities
Census-designated places
Unincorporated places
Ghost towns
- Davidson
- Hatfield
- Huckle
- Jamesburg
- Marshall
- Oatville
- Wichita Heights
Townships
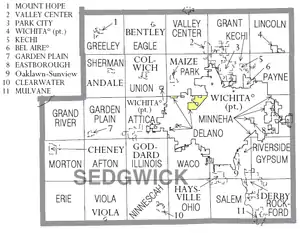
Sedgwick County is divided into twenty-seven townships. The cities of Bel Aire and Wichita are considered governmentally independent and are excluded from the census figures for the townships. In the following table, the population center is the largest city (or cities) included in that township's population total, if it is of a significant size. The county use to have one more township, Wichita Township, but it no longer exists.[20]
| Township | FIPS | Population center |
Population | Population density /km2 (/sq mi) |
Land area km2 (sq mi) | Water area km2 (sq mi) | Water % | Geographic coordinates |
|---|---|---|---|---|---|---|---|---|
| Afton | 00425 | 1,290 | 14 (37) | 91 (35) | 2 (1) | 1.73% | 37°36′10″N 97°37′54″W | |
| Attica | 03125 | Goddard | 4,959 | 62 (161) | 80 (31) | 0 (0) | 0.23% | 37°40′44″N 97°32′16″W |
| Delano | 17375 | 196 | 25 (64) | 8 (3) | 1 (0) | 13.81% | 37°43′2″N 97°25′13″W | |
| Eagle | 19250 | Bentley | 1,069 | 12 (30) | 92 (36) | 1 (1) | 1.44% | 37°51′48″N 97°32′26″W |
| Erie | 21550 | 106 | 1 (3) | 94 (36) | 0 (0) | 0.03% | 37°31′24″N 97°44′51″W | |
| Garden Plain | 25400 | Garden Plain | 1,780 | 19 (50) | 92 (36) | 0 (0) | 0.15% | 37°40′25″N 97°39′47″W |
| Grand River | 27300 | 607 | 7 (17) | 91 (35) | 2 (1) | 2.20% | 37°40′6″N 97°45′14″W | |
| Grant | 28125 | Valley Center (part) | 3,710 | 40 (104) | 93 (36) | 0 (0) | 0.47% | 37°50′55″N 97°20′23″W |
| Greeley | 28400 | Mount Hope | 1,094 | 12 (31) | 93 (36) | 1 (1) | 1.43% | 37°52′21″N 97°39′17″W |
| Gypsum | 29300 | 5,822 | 64 (164) | 92 (35) | 0 (0) | 0.51% | 37°36′26″N 97°12′34″W | |
| Illinois | 33775 | 1,620 | 18 (45) | 93 (36) | 0 (0) | 0.12% | 37°35′54″N 97°31′53″W | |
| Kechi | 36250 | Park City | 8,041 | 143 (370) | 56 (22) | 0 (0) | 0.23% | 37°47′35″N 97°19′14″W |
| Lincoln | 41150 | 473 | 5 (13) | 91 (35) | 0 (0) | 0.12% | 37°52′35″N 97°11′53″W | |
| Minneha | 47125 | Eastborough | 5,084 | 117 (304) | 43 (17) | 1 (0) | 1.49% | 37°41′11″N 97°11′25″W |
| Morton | 48550 | Cheney | 2,380 | 26 (67) | 91 (35) | 1 (0) | 1.14% | 37°37′24″N 97°46′33″W |
| Ninnescah | 50725 | Clearwater | 2,913 | 31 (81) | 93 (36) | 0 (0) | 0.47% | 37°30′51″N 97°31′28″W |
| Ohio | 52450 | 1,146 | 12 (32) | 94 (36) | 0 (0) | 0.14% | 37°31′56″N 97°25′21″W | |
| Park | 54425 | Maize | 4,128 | 51 (131) | 82 (32) | 2 (1) | 2.04% | 37°46′26″N 97°26′13″W |
| Payne | 55075 | 1,119 | 14 (36) | 80 (31) | 0 (0) | 0.21% | 37°46′58″N 97°12′22″W | |
| Riverside | 60125 | Haysville (part) Derby (part) Oaklawn-Sunview CDP | 15,694 | 333 (862) | 47 (18) | 1 (0) | 1.98% | 37°34′56″N 97°18′22″W |
| Rockford | 60675 | Derby (part) | 20,019 | 198 (514) | 101 (39) | 1 (0) | 0.99% | 37°31′55″N 97°14′47″W |
| Salem | 62675 | Haysville (part) | 8,411 | 102 (263) | 83 (32) | 1 (0) | 0.95% | 37°32′23″N 97°20′11″W |
| Sherman | 65100 | Andale | 1,362 | 14 (37) | 96 (37) | 0 (0) | 0.22% | 37°47′23″N 97°38′4″W |
| Union | 72375 | Colwich | 2,156 | 23 (60) | 93 (36) | 0 (0) | 0.23% | 37°46′55″N 97°32′8″W |
| Valley Center | 73275 | Valley Center (part) | 3,642 | 39 (100) | 94 (36) | 0 (0) | 0.16% | 37°51′22″N 97°24′10″W |
| Viola | 74050 | Viola | 547 | 6 (15) | 93 (36) | 1 (0) | 0.98% | 37°30′41″N 97°39′3″W |
| Waco | 74300 | 3,381 | 45 (117) | 75 (29) | 0 (0) | 0.12% | 37°36′35″N 97°24′57″W |
See also
|
|
References
- "Find a County". National Association of Counties. Retrieved June 7, 2011.
- https://www.census.gov/quickfacts/sedgwickcountykansas
- "State & County QuickFacts". United States Census Bureau. Retrieved July 29, 2014.
- Kansas State Historical Society (1916). Biennial Report of the Board of Directors of the Kansas State Historical Society. Kansas State Printing Plant. pp. 205.
- Rock Island Rail History
- "US Gazetteer files: 2010, 2000, and 1990". United States Census Bureau. February 12, 2011. Retrieved April 23, 2011.
- "Population and Housing Unit Estimates". Retrieved March 26, 2020.
- "U.S. Decennial Census". United States Census Bureau. Retrieved July 29, 2014.
- "Historical Census Browser". University of Virginia Library. Retrieved July 29, 2014.
- "Population of Counties by Decennial Census: 1900 to 1990". United States Census Bureau. Retrieved July 29, 2014.
- "Census 2000 PHC-T-4. Ranking Tables for Counties: 1990 and 2000" (PDF). United States Census Bureau. Retrieved July 29, 2014.
- "U.S. Census website". United States Census Bureau. Retrieved January 31, 2008.
- https://consumerist.com/2015/07/14/the-white-castle-story-the-birth-of-fast-food-the-burger-revolution/
- https://www.pizzahut.de/en/about-pizza-hut/the-history-of-pizza-hut/
- https://www.winmo.com/open/company/education-education-and-training-centers/ks/wichita/cessna-aircraft-company/2865
- https://www.bloomberg.com/research/stocks/private/snapshot.asp?privcapid=4217195
- http://uselectionatlas.org/RESULTS
- "Map of Wet and Dry Counties". Alcoholic Beverage Control, Kansas Department of Revenue. November 2006. Archived from the original on October 8, 2007. Retrieved December 28, 2007.
- http://geonames.usgs.gov/pls/gnispublic/f?p=115:3:103222460506338::NO:3:P3_FID,P3_TITLE:473853%2CTrails%20View
- County Map from Historical Atlas of Sedgwick County, Kansas; John P. Edwards; 50 pages; 1882.
- Notes
- This total comprises 6,546 votes (45.08 percent) for Progressive Theodore Roosevelt (who carried the county) and 804 votes (5.54 percent) for Socialist Eugene V. Debs.
Further reading
- Wichita : Illustrated History 1868 to 1880; Eunice S. Chapter; 52 pages; 1914. (Download 3MB PDF eBook)
- History of Wichita and Sedgwick County Kansas : Past and present, including an account of the cities, towns, and villages of the county; 2 Volumes; O.H. Bentley; C.F. Cooper & Co; 454 / 479 pages; 1910. (Volume1 - Download 20MB PDF eBook),(Volume2 - Download 31MB PDF eBook)
- Standard Atlas of Sedgwick County, Kansas; Geo. A. Ogle & Co; 78 pages; 1905.
- Historical Atlas of Sedgwick County, Kansas; John P. Edwards; 50 pages; 1882.
External links
| Wikimedia Commons has media related to Sedgwick County, Kansas. |
- County
- Historical
- Maps
- Sedgwick County Maps: Current, Historic, KDOT
- Kansas Highway Maps: Current, Historic, KDOT
- Kansas Railroad Maps: Current, 1996, 1915, KDOT and Kansas Historical Society
Places adjacent to Sedgwick County, Kansas | ||||||||||
|---|---|---|---|---|---|---|---|---|---|---|
| ||||||||||
Municipalities and communities of Sedgwick County, Kansas, United States | ||
|---|---|---|
| Cities | Map of Kansas highlighting Sedgwick County | |
| Unincorporated communities |
| |
| Townships | ||
| Footnotes | †This populated place is designated a Census-Designated Place (CDP) by the United States Census Bureau, ‡This populated place also has portions in an adjacent county or counties. | |
| ||
| Authority control |
|---|