Mobile County, Alabama
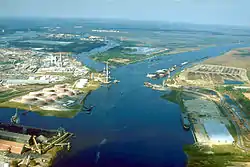
Mobile County (/moʊˈbiːl/ moh-BEEL) is located in the southwestern corner of the U.S. state of Alabama. It is the second most-populous county in the state after Jefferson County. As of the 2010 census, its population was 412,992.[2] Its county seat is Mobile, which was founded as a deepwater port on the Mobile River. The only such port in Alabama, it has long been integral to the economy for providing access to inland waterways as well as the Gulf of Mexico.[3]
Mobile County | |
|---|---|
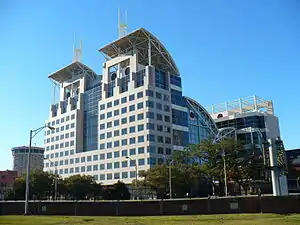 Mobile Government Plaza in Mobile | |
 Seal | |
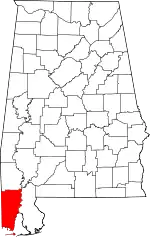 Location within the U.S. state of Alabama | |
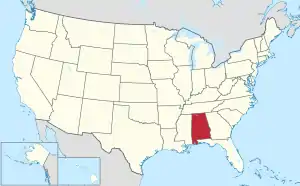 Alabama's location within the U.S. | |
| Coordinates: 30°47′11″N 88°12′50″W | |
| Country | |
| State | |
| Founded | December 18, 1812[1] |
| Seat | Mobile |
| Largest city | Mobile |
| Area | |
| • Total | 1,644 sq mi (4,260 km2) |
| • Land | 1,229 sq mi (3,180 km2) |
| • Water | 415 sq mi (1,070 km2) 25.2%% |
| Population (2010) | |
| • Total | 412,992 |
| • Estimate (2019) | 413,210 |
| • Density | 337/sq mi (130/km2) |
| Time zone | UTC−6 (Central) |
| • Summer (DST) | UTC−5 (CDT) |
| Congressional district | 1st |
| Website | mobilecountyal |
| |
The city, river, and county were named in honor of Maubila, a village of the paramount chief Tuskaloosa of the regional Mississippian culture. In 1540 he arranged an ambush of soldiers of Hernando de Soto's expedition in an effort to expel them from the territory. The Spaniards were armed with guns and killed many of the tribe. Today Mobile County comprises the Mobile, Alabama Metropolitan Statistical Area.
The northern border of Mobile County and southern area of neighboring Washington County constitute the homeland of the state-recognized tribe of MOWA Band of Choctaw Indians, descendants of Choctaw and Creek who stayed in this area during the period of Indian Removal. They have organized to preserve their culture and language. They were the first of nine tribes to be recognized by the state.
History
This area was occupied for thousands of years by varying cultures of indigenous peoples. At the time of Spanish expeditions in the early 16th century, it was part of the territory of the Mississippian culture, which constructed major earthwork mounds. It was ruled by the paramount chief Tuskaloosa.
The historic Choctaw emerged somewhat later, and are believed to be descendants of those earlier peoples. They occupied this area along what early French traders and colonists called the Mobile River. They also founded the settlement of Mobile on the river and bay in the early eighteenth century.
The British took over the territory in 1763 (along with other French territories east of the Mississippi River) after defeating the French in the Seven Years' War. During the American Revolutionary War, it came under Spanish rule as part of Spanish Florida. Spain ceded the territory to the United States after the War of 1812.
In the 1830s, the United States forced the removal of most of the Native American tribes in the area under President Andrew Jackson's policy and an act of Congress to relocate them to Indian Territory west of the Mississippi River. Many of those who remained continued their culture, and took refuge in the swamps in the border area between Mobile and Washington counties. Since the late 20th century, several tribes have reorganized and gained state recognition. Among those is the MOWA Band of Choctaw Indians, which was recognized as a tribe in 1979 by the state. The people have long been based in this area of the former Choctaw homeland, along the northern border of Mobile County and the southern border of Washington County.
After more than a century of European settlement, beginning with French colonists, Mobile County was organized by the state legislature and the proclamation of Governor Holmes of the Mississippi Territory on December 18, 1812.[1] When Mississippi was separated and admitted as a state on December 10, 1817, after adopting its constitution on August 15, 1817, Mobile County became part of what was called the Alabama Territory. Two years later, the county became part of the state of Alabama, granted statehood on December 14, 1819.[4][5]
The city of Mobile, first settled by French colonists in the early 18th century as part of La Louisiane, was designated as the county seat from the early days of the county.[1] Both the county and city derive their name from Fort Louis de la Mobile, a French fortification established (near present-day Axis, Alabama) in 1702. The word "Mobile" is believed to stem from a Choctaw word for "paddlers".[1] The area was occupied by French colonists from 1702 to 1763, and their influence has been strong in the city. It was ruled by the British from 1763 to 1780, when more American colonists began to enter the territory; and controlled by the Spanish from 1780 to 1813.
At the end of the War of 1812, the United States took over the territory. At that time, new settlers were being attracted to the land, eager to develop short-staple cotton in the uplands area. Invention of the cotton gin made processing of this type of cotton profitable, stimulating wholesale development of new cotton plantations in the Black Belt during the antebellum years. Mobile developed as a major deepwater port; in the nineteenth century, cotton was its major export.
There were nine documented lynchings in Mobile from 1891 to 1981.
- March 31, 1891 — Zachariah Graham[6]
- October 2, 1906 — Roy Hoyle[7]
- October 2, 1906 — Willie Thompson[8]
- October 2, 1906 — Corneilius Robinson[9]
- September 22, 1907 — Mose Dossett[10]
- January 23, 1909 — Richard Robertson[11]
- July 31, 1910 — Bill Walker[12]
- June 6, 1919 — James E. Lewis[13]
- March 21, 1981 — Michael Donald
Courthouse fires occurred in the years 1823, 1840, and 1872.[1]
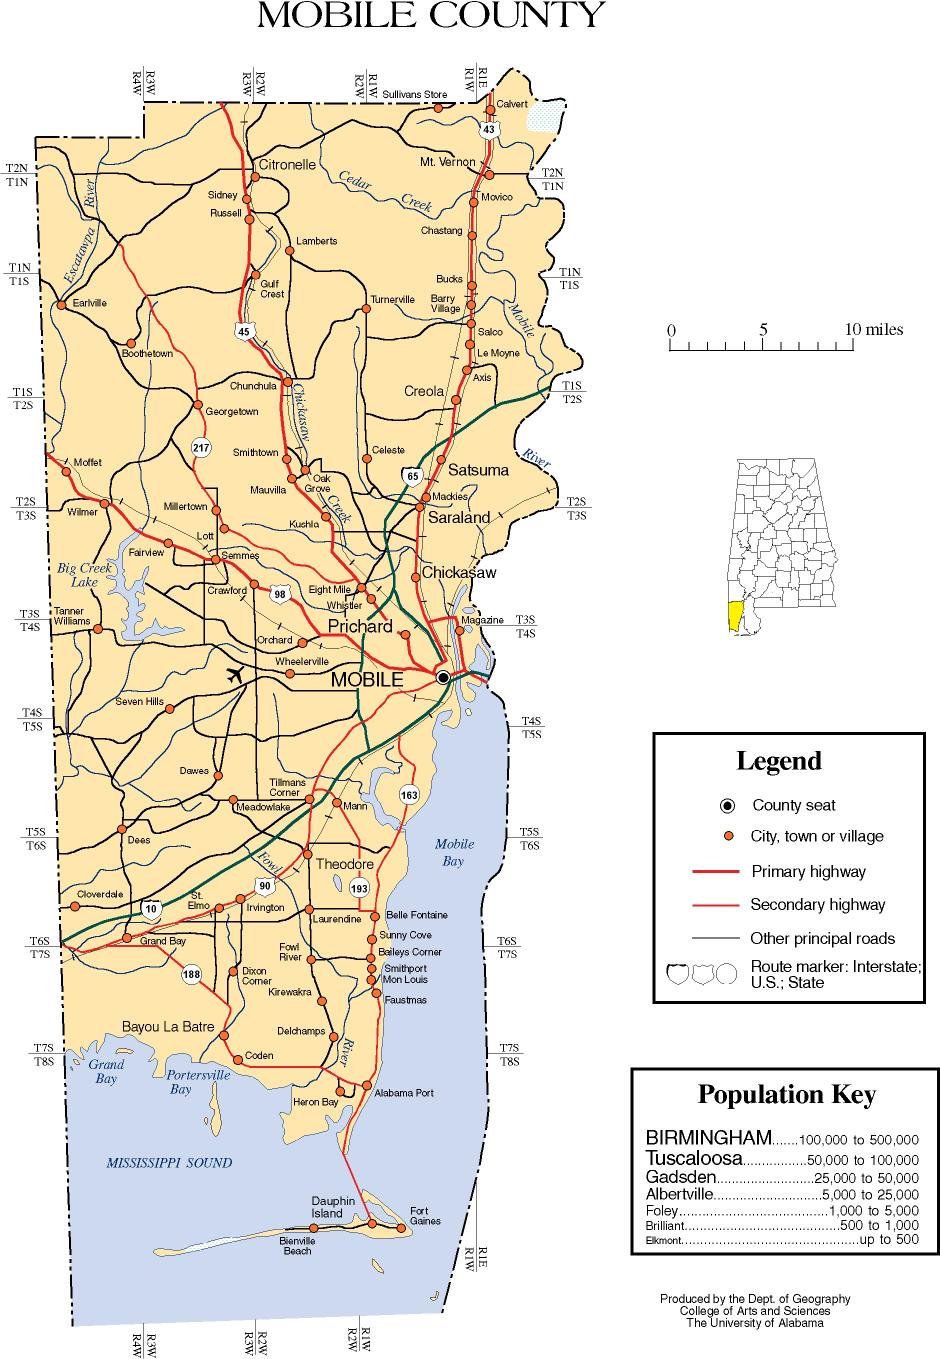
Geography
According to the U.S. Census Bureau, the county has a total area of 1,644 square miles (4,260 km2), of which 1,229 square miles (3,180 km2) is land and 415 square miles (1,070 km2) (25.2%) is water.[14] It is the fourth-largest county in Alabama by land area and second-largest by total area. It includes several islands, including Dauphin Island, Gaillard Island and Mon Louis Island.
Major highways
.svg.png.webp) Interstate 10
Interstate 10.svg.png.webp) Interstate 65
Interstate 65.svg.png.webp) Interstate 165
Interstate 165 planned western bypass
 U.S. Highway 43
 U.S. Highway 45
 U.S. Highway 90
 U.S. Highway 98
 State Route 158
 State Route 163
 State Route 188
 State Route 193
 State Route 213
 State Route 217
Adjacent counties
- Washington County (north)
- Baldwin County (east)
- Jackson County, Mississippi (southwest)
- George County, Mississippi (west)
- Greene County, Mississippi (northwest)
National protected areas
Demographics
| Historical population | |||
|---|---|---|---|
| Census | Pop. | %± | |
| 1820 | 2,672 | — | |
| 1830 | 6,267 | 134.5% | |
| 1840 | 18,741 | 199.0% | |
| 1850 | 27,600 | 47.3% | |
| 1860 | 41,131 | 49.0% | |
| 1870 | 49,311 | 19.9% | |
| 1880 | 48,653 | −1.3% | |
| 1890 | 51,587 | 6.0% | |
| 1900 | 62,740 | 21.6% | |
| 1910 | 80,854 | 28.9% | |
| 1920 | 100,117 | 23.8% | |
| 1930 | 118,363 | 18.2% | |
| 1940 | 141,974 | 19.9% | |
| 1950 | 231,105 | 62.8% | |
| 1960 | 314,301 | 36.0% | |
| 1970 | 317,308 | 1.0% | |
| 1980 | 364,980 | 15.0% | |
| 1990 | 378,643 | 3.7% | |
| 2000 | 399,843 | 5.6% | |
| 2010 | 412,992 | 3.3% | |
| 2019 (est.) | 413,210 | [15] | 0.1% |
| U.S. Decennial Census[16] 1790–1960[17] 1900–1990[18] 1990–2000[19] 2010–2018[2] | |||
2010
According to the 2010 United States Census, the population of the county comprised the following racial and ethnic groups:
- 60.2% White
- 34.6% Black
- 0.9% Native American
- 1.8% Asian
- 0.0% Native Hawaiian or Pacific Islander
- 1.5% Two or more races
- 2.4% Hispanic or Latino (of any race)
2000
According to the 2000 United States Census,[20] there were 399,843 people, 150,179 households, and 106,777 families residing in the county. The population density was 324 people per square mile (125/km2). There were 165,101 housing units at an average density of 134 per square mile (52/km2). The racial makeup of the county was 63.07% White, 33.38% Black or African American, 0.67% Native American, 1.41% Asian, 0.03% Pacific Islander, 0.40% from other races, and 1.04% from two or more races. 1.22% of the population were Hispanic or Latino of any race.
There were 150,179 households, out of which 34.40% had children under the age of 18 living with them, 49.50% were married couples living together, 17.70% had a female householder with no husband present, and 28.90% were non-families. 24.80% of all households were made up of individuals, and 8.80% had someone living alone who was 65 years of age or older. The average household size was 2.61 and the average family size was 3.13.
In the county, the population dispersal was 27.50% under the age of 18, 10.00% from 18 to 24, 28.70% from 25 to 44, 21.90% from 45 to 64, and 12.00% who were 65 years of age or older. The median age was 34 years. For every 100 females, there were 91.50 males. For every 100 females age 18 and over, there were 87.10 males. The median income for a household in the county was $33,710, and the median income for a family was $40,378. Males had a median income of $32,329 versus $21,986 for females. The per capita income for the county was $17,178. About 15.60% of families and 18.50% of the population were below the poverty line, including 26.20% of those under age 18 and 14.60% of those age 65 or over.
Government

Local
Mobile County has a limited form of home rule and is governed by a three-member county commission. Each commissioner represents a single-member district and is elected by the voters of that district to serve a four-year term. Each commissioner has an equal vote on the commission. One of the commissioners is selected as Commission President.
As of January 2014) Mobile County Commissioners are:
- District 1 (northern County) – Merceria L. Ludgood (D) (current Commission President)
- District 2 (western and central County) – Connie Hudson (R)
- District 3 (southern County) – Jerry Carl (R)
State
Under the state constitution, the legislature maintains considerable power over county affairs. Mobile County is represented in the Alabama Legislature by three senators and nine representatives. It is represented in the Alabama Senate by Democrat Vivian Davis Figures from the 33rd district, by Republican Rusty Glover from the 34th district, and by Republican Bill Hightower from the 35th district.[21] It is represented in the Alabama House of Representatives by Democrat Adline Clarke from the 97th district, Democrat Napoleon Bracy from the 98th district, Democrat James Buskey from the 99th district, Republican Victor Gaston from the 100th district, Republican Jamie Ison from the 101st district, Republican Chad Fincher from the 102nd district, Democrat Joseph C. Mitchell from the 103rd district, Republican Jim Barton from the 104th district, and Republican David Sessions from the 105th district.[22]
Education
In most areas of Mobile County, schools are operated by the Mobile County Public School System. The cities of Chickasaw, Saraland, and Satsuma have separate school systems. Each is served by Chickasaw City Schools, Saraland Board of Education, and Satsuma City School System.
Mobile County is also the home of the University of South Alabama (USA), a public research university divided into ten colleges, including one of Alabama's two state-supported medical schools. USA has an enrollment of over 16,000 students and employs more than 6,000 faculty, administrators, and support staff.
Politics
During the late 20th century, white conservatives left the Democratic Party for the Republican Party. In that same period, as African Americans regained their ability to exercise the franchise after passage of the 1965 Voting Rights Act, they tended to support the national Democratic Party.
Today the population of Mobile County is majority white; at the time of the Civil War, it was majority black. In 2004, the incumbent Republican president George W. Bush won 59 percent of the vote and 92,014 votes. Democrat John F. Kerry won 40 percent of the vote and 63,732 votes. Other candidates won one percent of the vote.[23]
In the 2008 presidential election, Mobile County cast the majority of its votes for the Republican candidate John McCain. He won 54% of the vote and 98,049 votes. Democrat Barack Obama received 45% of the vote and 82,181 votes. Other candidates won 1% of the vote.[23]
In the Senate off-year election in 2008, Republican Jeff Sessions did better than John McCain. Sessions won 57 percent of the vote and 102,043 votes. His challenger, Democrat Vivian Figures, won 43 percent of the vote and 77,292 votes.[23]
| Year | Republican | Democratic | Others |
|---|---|---|---|
| 2020 | 55.2% 101,243 | 43.3% 79,474 | 1.3% 2,447 |
| 2016 | 55.1% 95,116 | 41.8% 72,186 | 3.2% 5,435 |
| 2012 | 54.2% 94,893 | 45.0% 78,760 | 0.9% 1,487 |
| 2008 | 54.0% 98,049 | 45.3% 82,181 | 0.7% 1,194 |
| 2004 | 58.7% 92,014 | 40.7% 63,732 | 0.7% 1,025 |
| 2000 | 55.9% 78,162 | 42.0% 58,640 | 2.1% 2,943 |
| 1996 | 51.3% 66,775 | 42.1% 54,749 | 6.6% 8,579 |
| 1992 | 50.7% 72,935 | 38.2% 54,962 | 11.1% 15,891 |
| 1988 | 60.9% 72,203 | 38.4% 45,524 | 0.7% 870 |
| 1984 | 62.6% 81,923 | 36.1% 47,252 | 1.4% 1,784 |
| 1980 | 57.7% 67,515 | 39.5% 46,180 | 2.8% 3,297 |
| 1976 | 50.9% 53,835 | 47.5% 50,264 | 1.7% 1,777 |
| 1972 | 73.2% 62,639 | 24.2% 20,694 | 2.7% 2,301 |
| 1968 | 11.4% 10,509 | 20.3% 18,615 | 68.3% 62,812 |
| 1964 | 70.7% 49,493 | 29.3% 20,488 | |
| 1960 | 45.1% 24,608 | 52.5% 28,626 | 2.4% 1,308 |
| 1956 | 52.2% 20,639 | 43.4% 17,163 | 4.4% 1,732 |
| 1952 | 49.3% 14,153 | 50.4% 14,473 | 0.3% 89 |
| 1948 | 19.4% 2,685 | 80.6% 11,150 | |
| 1944 | 23.1% 2,867 | 76.0% 9,439 | 0.9% 117 |
| 1940 | 14.0% 1,887 | 85.1% 11,480 | 0.9% 126 |
| 1936 | 8.6% 1,072 | 90.0% 11,165 | 1.4% 175 |
| 1932 | 14.9% 1,705 | 84.4% 9,658 | 0.7% 78 |
| 1928 | 45.8% 5,058 | 54.1% 5,965 | 0.1% 10 |
| 1924 | 28.5% 1,814 | 64.9% 4,125 | 6.6% 416 |
| 1920 | 29.7% 2,681 | 68.4% 6,171 | 1.9% 171 |
| 1916 | 21.4% 832 | 76.2% 2,968 | 2.5% 96 |
| 1912 | 3.7% 140 | 80.0% 3,009 | 16.3% 613 |
| 1908 | 14.0% 453 | 75.0% 2,422 | 10.9% 353 |
| 1904 | 8.8% 325 | 89.3% 3,283 | 1.8% 67 |
| 1900 | 41.6% 2,243 | 54.5% 2,939 | 3.8% 205 |
| 1896 | 37.7% 2,778 | 53.6% 3,948 | 8.5% 631 |
| 1892 | 5.6% 397 | 66.3% 4,680 | 28.0% 1,979 |
| 1888 | 44.9% 2,542 | 55.0% 3,109 | 0.0% 0 |
Communities
Cities
- Bayou La Batre
- Chickasaw
- Citronelle
- Creola
- Mobile (county seat)
- Prichard
- Saraland
- Satsuma
- Semmes
Towns
Census-designated places
Unincorporated communities
Ghost town
See also
References
- "Mobile County, Alabama history". Alabama Department of Archives and History (ADAH). June 5, 2009.
- "State & County QuickFacts". United States Census Bureau. Archived from the original on June 6, 2011. Retrieved May 16, 2014.
- "Find a County". National Association of Counties. Retrieved June 7, 2011.
- "An 1820 Claim to Congress: Alabama Territory : 1817". The Intruders. TNGenNet Inc. 2001.
- "Statehood Dates". 50states.com. 2009 [1998].
- "CSDE Lynching Database". lynching.csde.washington.edu. Retrieved September 24, 2017.
- "CSDE Lynching Database". lynching.csde.washington.edu. Retrieved September 24, 2017.
- "CSDE Lynching Database". lynching.csde.washington.edu. Retrieved September 24, 2017.
- "CSDE Lynching Database". lynching.csde.washington.edu. Retrieved September 24, 2017.
- "CSDE Lynching Database". lynching.csde.washington.edu. Retrieved September 24, 2017.
- "CSDE Lynching Database". lynching.csde.washington.edu. Retrieved September 24, 2017.
- "CSDE Lynching Database". lynching.csde.washington.edu. Retrieved September 24, 2017.
- "CSDE Lynching Database". lynching.csde.washington.edu. Retrieved September 24, 2017.
- "2010 Census Gazetteer Files". United States Census Bureau. August 22, 2012. Retrieved August 22, 2015.
- "Population and Housing Unit Estimates". Retrieved May 16, 2019.
- "U.S. Decennial Census". United States Census Bureau. Retrieved August 22, 2015.
- "Historical Census Browser". University of Virginia Library. Retrieved August 22, 2015.
- Forstall, Richard L., ed. (March 24, 1995). "Population of Counties by Decennial Census: 1900 to 1990". United States Census Bureau. Retrieved August 22, 2015.
- "Census 2000 PHC-T-4. Ranking Tables for Counties: 1990 and 2000" (PDF). United States Census Bureau. April 2, 2001. Retrieved August 22, 2015.
- "U.S. Census website". United States Census Bureau. Retrieved May 14, 2011.
- "Roster of the Alabama State Senate". Official Website of the Alabama Legislature. Archived from the original on 2013-06-29. Retrieved 2013-07-05.
- "Roster of the Alabama House of Representatives". Official Website Of The Alabama Legislature. Archived from the original on 2013-06-21. Retrieved 2013-07-05.
- David Leip (2008). "Atlas of United States Presidential Election Results".
- Leip, David. "Dave Leip's Atlas of U.S. Presidential Elections". uselectionatlas.org. Retrieved 24 June 2018.
External links
| Wikimedia Commons has media related to Mobile County, Alabama. |
| Wikisource has the text of an 1879 American Cyclopædia article about Mobile County, Alabama. |
- Mobile County, Alabama, official website
- Map of roads/towns in Mobile County from University of Alabama
- South Alabama Community Website
Places adjacent to Mobile County, Alabama | |
|---|---|
Municipalities and communities of Mobile County, Alabama, United States | ||
|---|---|---|
| Cities | Map of Alabama highlighting Mobile County | |
| Towns | ||
| CDPs | ||
| Unincorporated communities | ||
| Ghost town | ||
| Indian reservation | ||
| Footnotes | ‡This populated place also has portions in an adjacent county or counties | |
| ||
Montgomery (capital) | ||
| Topics | ||
| Society | ||
| Regions | ||
| Flora and fauna | ||
| Largest cities | ||
| Metros | ||
| Counties |
| |
| Authority control |
|---|