Sioux County, North Dakota
Sioux County is a county located along the southern border of the U.S. state of North Dakota. As of the 2010 census, the population was 4,153.[1] Its eastern border is the Missouri River and its county seat is Fort Yates.[2]
Sioux County | |
|---|---|
.jpg.webp) Postcard. Historic Sioux County Courthouse at Fort Yates, North Dakota. | |
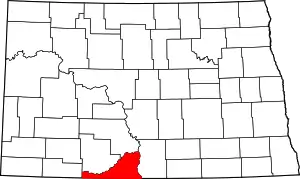 Location within the U.S. state of North Dakota | |
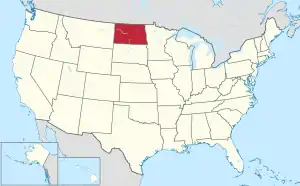 North Dakota's location within the U.S. | |
| Coordinates: 46°07′N 101°03′W | |
| Country | |
| State | |
| Founded | September 3, 1914 (created) September 12, 1914 (organized) |
| Named for | Sioux people |
| Seat | Fort Yates |
| Largest community | Cannon Ball |
| Area | |
| • Total | 1,128 sq mi (2,920 km2) |
| • Land | 1,094 sq mi (2,830 km2) |
| • Water | 34 sq mi (90 km2) 3.0% |
| Population (2010) | |
| • Total | 4,153 |
| • Estimate (2019) | 4,230 |
| • Density | 3.7/sq mi (1.4/km2) |
| Time zones | |
| (eastern portion) | UTC−6 (Central) |
| • Summer (DST) | UTC−5 (CDT) |
| (western portion) | UTC−7 (Mountain) |
| • Summer (DST) | UTC−6 (MDT) |
History
The county was created by proclamation of Governor Louis B. Hanna on September 3, 1914. It was named for the Native American Lakota, whose historic territory included this area. The county government organization was completed on September 12 of that year.[3] The county lies entirely within the Standing Rock Indian Reservation, forming the northernmost 30 percent of the reservation; the balance of the reservation is in South Dakota. It is the only county in North Dakota that is entirely within an Indian reservation. From 2013 to 2018, Sioux County was included in the Bismarck, ND Metropolitan Statistical Area.
Geography
Sioux County lies on the south line of North Dakota. Its south boundary line abuts the north boundary line of the state of South Dakota. Its north boundary line is formed by the east-northeastward-flowing Cedar Creek, which discharges into the Missouri River at the county's northeast corner, and its east boundary line is formed by the south-southeast-flowing Missouri River, which also forms Lake Oahe along the county boundary line. Porcupine Creek flows southeastward into the Missouri River, draining the northeastern part of the county. The county terrain consists of low rolling hills etched with gullies and drainages; the area is mostly devoted to agriculture.[4] The terrain slopes to the east and south; its highest point is on the west line, near the southwestern corner of the county, at 2,602' (793m) ASL.[5] The county has a total area of 1,128 square miles (2,920 km2), of which 1,094 square miles (2,830 km2) is land and 34 square miles (88 km2) (3.0%) is water.[6]
The southwest corner counties of North Dakota (Adams, Billings, Bowman, Golden Valley, Grant, Hettinger, Slope, and Stark) observe Mountain Time. The counties of McKenzie, Dunn, and Sioux are split, observing Mountain Time in their western portions.
Major highways
Adjacent counties
- Morton County - north (observes Central Time)
- Emmons County - east (observes Central Time)
- Corson County, South Dakota - south (observes Mountain Time)
- Adams County - west (observes Mountain Time)
- Grant County - northwest (observes Mountain Time)
Protected areas[4]
- Cedar River National Grassland (part)
- Froelich Dam State Game Management Area
Demographics
| Historical population | |||
|---|---|---|---|
| Census | Pop. | %± | |
| 1920 | 3,308 | — | |
| 1930 | 4,687 | 41.7% | |
| 1940 | 4,419 | −5.7% | |
| 1950 | 3,696 | −16.4% | |
| 1960 | 3,662 | −0.9% | |
| 1970 | 3,632 | −0.8% | |
| 1980 | 3,620 | −0.3% | |
| 1990 | 3,761 | 3.9% | |
| 2000 | 4,044 | 7.5% | |
| 2010 | 4,153 | 2.7% | |
| 2019 (est.) | 4,230 | [7] | 1.9% |
| US Decennial Census[8] 1790-1960[9] 1900-1990[10] 1990-2000[11] 2010-2019[1] | |||
2000 census
As of the 2000 United States Census, there were 4,044 people, 1,095 households, and 871 families in the county. The population density was 3.70/sqmi (1.42/km2). There were 1,216 housing units at an average density of 1.11/sqmi (0.43/km2). The racial makeup of the county was 84.59% Native American, 14.34% White, 0.02% Black or African American, 0.02% Asian, 0.05% Pacific Islander, 0.07% from other races, and 0.89% from two or more races. 1.61% of the population were Hispanic or Latino of any race. 11.5% were of German ancestry.
There were 1,095 households, out of which 48.90% had children under the age of 18 living with them, 39.10% were married couples living together, 29.10% had a female householder with no husband present, and 20.40% were non-families. 16.60% of all households were made up of individuals, and 4.40% had someone living alone who was 65 years of age or older. The average household size was 3.63 and the average family size was 3.98.
The county population contained 40.30% under the age of 18, 11.10% from 18 to 24, 26.90% from 25 to 44, 16.20% from 45 to 64, and 5.60% who were 65 years of age or older. The median age was 24 years. For every 100 females there were 104.20 males. For every 100 females age 18 and over, there were 99.70 males.
The median income for a household in the county was $22,483, and the median income for a family was $24,000. Males had a median income of $22,039 versus $19,458 for females. The per capita income for the county was $7,731. About 33.60% of families and 39.20% of the population were below the poverty line, including 44.40% of those under age 18 and 25.80% of those age 65 or over. The county's per-capita income makes it one of the poorest counties in the United States.
2010 census
As of the 2010 Census, there were 4,153 people, 1,158 households, and 900 families in the county.[12] The population density was 3.8 inhabitants per square mile (1.5/km2). There were 1,311 housing units at an average density of 1.2 per square mile (0.46/km2).[13] The racial makeup of the county was 84.1% American Indian, 12.6% white, 0.2% black or African American, 0.1% Asian, 0.1% from other races, and 2.9% from two or more races. Those of Hispanic or Latino origin made up 2.0% of the population.[12] In terms of ancestry, 13.5% were German, and 0.3% were American.[14]
Of the 1,158 households, 54.1% had children under the age of 18 living with them, 32.5% were married couples living together, 31.6% had a female householder with no husband present, 22.3% were non-families, and 17.4% of all households were made up of individuals. The average household size was 3.55 and the average family size was 3.89. The median age was 26.3 years.[12]
The median income for a household in the county was $30,990 and the median income for a family was $31,098. Males had a median income of $31,894 versus $26,619 for females. The per capita income for the county was $13,542. About 39.0% of families and 47.2% of the population were below the poverty line, including 58.4% of those under age 18 and 36.1% of those age 65 or over.[15]
Politics
With its population being mostly Native American, Sioux County is one of the most consistently Democratic counties in both North Dakota and the Great Plains, having last backed a Republican presidential candidate in 1980. In 2016, Hillary Clinton won the most votes in Sioux County, one of only two counties she won in the state. Green Party candidate Jill Stein received 10.4% of the popular vote.[16]
| Year | Republican | Democratic | Third parties |
|---|---|---|---|
| 2020 | 21.8% 258 | 67.8% 804 | 10.5% 124 |
| 2016 | 21.1% 260 | 61.5% 758 | 17.4% 214 |
| 2012 | 19.7% 225 | 78.7% 900 | 1.7% 19 |
| 2008 | 15.6% 215 | 83.1% 1,145 | 1.3% 18 |
| 2004 | 28.0% 319 | 70.5% 804 | 1.5% 17 |
| 2000 | 25.8% 269 | 69.6% 724 | 4.6% 48 |
| 1996 | 30.0% 207 | 57.0% 393 | 13.0% 90 |
| 1992 | 26.8% 264 | 47.1% 463 | 26.1% 257 |
| 1988 | 31.2% 325 | 67.3% 701 | 1.5% 16 |
| 1984 | 39.5% 442 | 58.6% 655 | 1.9% 21 |
| 1980 | 56.9% 620 | 35.1% 383 | 8.0% 87 |
| 1976 | 32.8% 354 | 64.5% 697 | 2.8% 30 |
| 1972 | 49.1% 561 | 48.8% 557 | 2.1% 24 |
| 1968 | 45.3% 482 | 49.3% 525 | 5.5% 58 |
| 1964 | 31.0% 314 | 68.6% 695 | 0.4% 4 |
| 1960 | 45.4% 571 | 54.7% 688 | |
| 1956 | 60.0% 718 | 39.8% 476 | 0.3% 3 |
| 1952 | 73.2% 968 | 25.4% 336 | 1.4% 18 |
| 1948 | 57.2% 667 | 39.9% 465 | 2.9% 34 |
| 1944 | 60.0% 673 | 39.7% 445 | 0.4% 4 |
| 1940 | 66.8% 1,167 | 33.1% 578 | 0.1% 1 |
| 1936 | 35.2% 585 | 52.7% 877 | 12.1% 202 |
| 1932 | 20.3% 350 | 77.1% 1,328 | 2.6% 44 |
| 1928 | 40.5% 687 | 58.2% 988 | 1.4% 23 |
| 1924 | 62.2% 777 | 4.6% 58 | 33.2% 414 |
| 1920 | 80.8% 776 | 17.0% 163 | 2.3% 22 |
| 1916 | 50.1% 232 | 43.2% 200 | 6.7% 31 |
References
- "State & County QuickFacts". United States Census Bureau. Retrieved November 1, 2013.
- "Find a County". National Association of Counties. Retrieved June 7, 2011.
- "Dakota Territory, South Dakota, and North Dakota: Individual County Chronologies". Dakota Territory Atlas of Historical County Boundaries. The Newberry Library. 2006. Retrieved February 22, 2019.
- Sioux County ND Google Maps (accessed 22 February 2019)
- ""Find an Altitude/Sioux County ND" Google Maps (accessed 22 February 2019)". Archived from the original on May 21, 2019. Retrieved February 22, 2019.
- "2010 Census Gazetteer Files". US Census Bureau. August 22, 2012. Archived from the original on January 29, 2015. Retrieved February 1, 2015.
- "Population and Housing Unit Estimates". Retrieved April 2, 2020.
- "US Decennial Census". US Census Bureau. Retrieved February 1, 2015.
- "Historical Census Browser". University of Virginia Library. Retrieved February 1, 2015.
- Forstall, Richard L., ed. (April 20, 1995). "Population of Counties by Decennial Census: 1900 to 1990". US Census Bureau. Retrieved February 1, 2015.
- "Census 2000 PHC-T-4. Ranking Tables for Counties: 1990 and 2000" (PDF). US Census Bureau. April 2, 2001. Retrieved February 1, 2015.
- "Profile of General Population and Housing Characteristics: 2010 Demographic Profile Data". US Census Bureau. Archived from the original on February 13, 2020. Retrieved April 3, 2016.
- "Population, Housing Units, Area, and Density: 2010 - County". US Census Bureau. Archived from the original on February 13, 2020. Retrieved April 3, 2016.
- "Selected Social Characteristics in the US – 2006-2010 American Community Survey 5-Year Estimates". US Census Bureau. Archived from the original on February 13, 2020. Retrieved April 3, 2016.
- "Selected Economic Characteristics – 2006-2010 American Community Survey 5-Year Estimates". US Census Bureau. Archived from the original on February 13, 2020. Retrieved April 3, 2016.
- Leip, David. "Atlas of US Presidential Elections". uselectionatlas.org. Retrieved April 13, 2018.
External links
Places adjacent to Sioux County, North Dakota | ||||||||||
|---|---|---|---|---|---|---|---|---|---|---|
| ||||||||||
Municipalities and communities of Sioux County, North Dakota, United States | ||
|---|---|---|
| Cities | Map of North Dakota highlighting Sioux County | |
| CDPs | ||
| Indian reservations | ||
| Footnotes | ‡This populated place also has portions in an adjacent county or counties | |
| ||
| Authority control |
|---|