New Jersey's 1st congressional district
New Jersey's 1st congressional district is a congressional district in the U.S. state of New Jersey. The district, which includes the city of Camden and the suburbs of Philadelphia, has been represented by Democrat Donald Norcross since November 2014. It is among the most reliably Democratic districts in New Jersey, as it is mainly made up of Democratic-dominated Camden County.

The district from 2003 to 2013
| New Jersey's 1st congressional district | |||
|---|---|---|---|
.svg.png.webp) District map as of 2013 | |||
| Representative |
| ||
| Distribution |
| ||
| Population (2019) | 726,825[1] | ||
| Median household income | $75,244[1] | ||
| Ethnicity |
| ||
| Cook PVI | D+13[2] | ||
Counties and municipalities in the district
For the 113th and successive Congresses (based on redistricting following the 2010 United States Census), the district contains all or portions of three counties and 52 municipalities:[3]
- Burlington County (2 municipalities)
- Maple Shade Township, Palmyra
- Camden County (36 municipalities)
- Audubon, Audubon Park, Barrington, Bellmawr, Berlin, Berlin Township, Brooklawn, Camden, Cherry Hill Township, Chesilhurst, Clementon, Collingswood, Gibbsboro, Gloucester City, Gloucester Township, Haddon Heights, Haddon Township, Haddonfield, Hi-Nella, Laurel Springs, Lawnside, Lindenwold, Magnolia, Merchantville, Mount Ephraim, Oaklyn, Pennsauken Township, Pine Hill, Pine Valley, Runnemede, Somerdale, Stratford, Tavistock, Voorhees Township, Winslow Township, Woodlynne
Recent election results in statewide races
| Year | Office | Results |
|---|---|---|
| 2000 | President | Gore 63 – 34% |
| 2004 | President | Kerry 61 – 39% |
| 2008 | President | Obama 65 – 34% |
| 2012 | President | Obama 65 – 34% |
| 2016 | President | Clinton 61 – 36% |
| 2020 | President | Biden 62 – 36% |
List of members representing the district
1789–1813: One seat
| Member (Residence) |
Party | Years | Cong ress |
Electoral history |
|---|---|---|---|---|
| Seats had been elected at-large until 1799. | ||||
 John Condit (Orange: Bergen, Essex, and Middlesex Counties) |
Democratic-Republican | March 4, 1799 – March 3, 1801 |
6th | Elected in 1798. Redistricted to the at-large district. |
| All seats elected at-large after 1801. | ||||
1813–1815: Two seats
From 1813 to 1815, two seats were apportioned, elected at-large on a general ticket.
| Cong ress |
Years | Seat A | Seat B | |||||
|---|---|---|---|---|---|---|---|---|
| Member (Residence) |
Party | Electoral history | Member (Residence) |
Party | Electoral history | |||
| March 4, 1813 – March 3, 1815 |
13th | Lewis Condict (Morristown: Bergen, Essex, Morris, and Sussex Counties) |
Democratic-Republican | Redistricted from the at-large district and re-elected in 1813. Redistricted to the at-large district. |
Thomas Ward (Newark) |
Democratic-Republican | Elected in 1813. Redistricted to the at-large district. | |
All seats elected at-large starting in 1815.
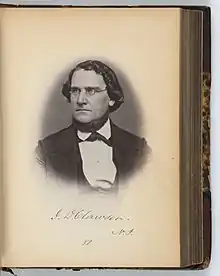
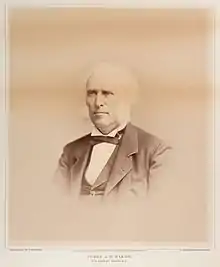
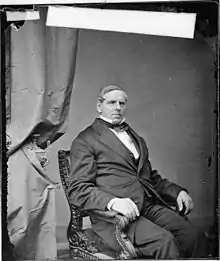
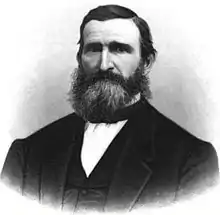
1843–present: One seat
.jpg.webp)
.jpg.webp)
.jpg.webp)
.jpg.webp)
.jpg.webp)
.png.webp)


.jpg.webp)
Recent election results
2012
| Party | Candidate | Votes | % | |
|---|---|---|---|---|
| Democratic | Rob Andrews (incumbent) | 210,470 | 68.2 | |
| Republican | Gregory Horton | 92,459 | 30.0 | |
| Green | John Reitter | 4,413 | 1.4 | |
| Reform | Margaret Chapman | 1,177 | 0.4 | |
| Total votes | 308,519 | 100.0 | ||
| Democratic hold | ||||
2014
| Party | Candidate | Votes | % | |
|---|---|---|---|---|
| Democratic | Donald Norcross | 93,315 | 57.4 | |
| Republican | Garry Cobb | 64,073 | 39.4 | |
| Independent | Scot John Tomaszewski | 1,784 | 1.1 | |
| Independent | Robert Shapiro | 1,134 | 0.7 | |
| Independent | Margaret M. Chapman | 1,103 | 0.7 | |
| Independent | Mike Berman | 634 | 0.4 | |
| Independent | Donald E Letton | 449 | 0.3 | |
| Total votes | 162,492 | 100.0 | ||
| Democratic hold | ||||
2016
| Party | Candidate | Votes | % | |
|---|---|---|---|---|
| Democratic | Donald Norcross (incumbent) | 183,231 | 60.0 | |
| Republican | Bob Patterson | 112,388 | 36.8 | |
| Independent | Scot John Tomaszewski | 5,473 | 1.8 | |
| Libertarian | William F. Sihr IV | 2,410 | 0.8 | |
| Independent | Michael Berman | 1,971 | 0.6 | |
| Total votes | 305,473 | 100.0 | ||
| Democratic hold | ||||
2018
| Party | Candidate | Votes | % | |
|---|---|---|---|---|
| Democratic | Donald Norcross (incumbent) | 169,628 | 64.4 | |
| Republican | Paul E. Dilks | 87,617 | 33.3 | |
| Libertarian | Robert Shapiro | 2,821 | 1.1 | |
| Independent | Paul Hamlin | 2,368 | 0.9 | |
| Independent | Mohammad Kabir | 984 | 0.4 | |
| Total votes | 263,418 | 100.0 | ||
| Democratic hold | ||||
2020
| Party | Candidate | Votes | % | |
|---|---|---|---|---|
| Democratic | Donald Norcross (incumbent) | 240,567 | 62.5 | |
| Republican | Claire Gustafson | 144,463 | 37.5 | |
| Total votes | 385,030 | 100.0 | ||
| Democratic hold | ||||
References
- Center for New Media & Promotion (CNMP), US Census Bureau. "My Congressional District". www.census.gov.
- "Partisan Voting Index – Districts of the 115th Congress" (PDF). The Cook Political Report. April 7, 2017. Retrieved April 7, 2017.
- Plan Components Report, New Jersey Redistricting Commission, December 23, 2011. Accessed September 29, 2013.
- "Election Information" (PDF). NJ Department of State. November 6, 2012. Retrieved March 9, 2018.
- "Official General Election Results: U.S. House of Representatives" (PDF). New Jersey Department of Elections. Retrieved December 7, 2020.
Sources
- Martis, Kenneth C. (1989). The Historical Atlas of Political Parties in the United States Congress. New York: Macmillan Publishing Company.
- Martis, Kenneth C. (1982). The Historical Atlas of United States Congressional Districts. New York: Macmillan Publishing Company.
- Congressional Biographical Directory of the United States 1774–present
This article is issued from Wikipedia. The text is licensed under Creative Commons - Attribution - Sharealike. Additional terms may apply for the media files.