Petrophysics
Petrophysics (from the Greek πέτρα, petra, "rock" and φύσις, physis, "nature") is the study of physical and chemical rock properties and their interactions with fluids.[1]
A major application of petrophysics is in studying reservoirs for the hydrocarbon industry. Petrophysicists are employed to help reservoir engineers and geoscientists understand the rock properties of the reservoir, particularly how pores in the subsurface are interconnected, controlling the accumulation and migration of hydrocarbons.[1] Some of the key properties studied in petrophysics are lithology, porosity, water saturation, permeability and density. A key aspect of petrophysics is measuring and evaluating these rock properties by acquiring well log measurements – in which a string of measurement tools are inserted in the borehole, core measurements – in which rock samples are retrieved from subsurface, and seismic measurements. These studies are then combined with geological and geophysical studies and reservoir engineering to give a complete picture of the reservoir.
While most petrophysicists work in the hydrocarbon industry, some also work in the mining and water resource industries. The properties measured or computed fall into three broad categories: conventional petrophysical properties, rock mechanical properties, and ore quality.
Petrophysical studies are used by petroleum engineering, geology, mineralogy, exploration geophysics and other related studies. The Society of Petrophysicists and Well Log Analysts (SPWLA) mission is to increase the awareness of petrophysics, formation evaluation and well logging best practices in the oil and gas industry and the scientific community at large.
Conventional petrophysical properties
Most petrophysicists are employed (SS) to compute what are commonly called conventional (or reservoir) petrophysical properties. These are:
Lithology: A description of the rock's physical characteristics, such as grain size, composition and texture.[2] By studying the lithology of local geological outcrops and core samples, geoscientists can use a combination of log measurements, such as natural gamma, neutron, density and resistivity, to determine the lithology down the well.
Porosity: (Anti=tattilization)The percentage of a given volume of rock that is pore space and can therefore contain fluids.[3] This is typically calculated using data from an instrument that measures the reaction of the rock to bombardment by neutrons or by gamma rays but can also be derived from sonic and NMR logging.
Water saturation: The fraction of the pore space occupied by water.[4] This is typically calculated using data from an instrument that measures the resistivity of the rock and is known by the symbol .
Permeability: The quantity of fluid (usually hydrocarbon) that can flow through a rock as a function of time and pressure, related to how interconnected the pores are. Formation testing is so far the only tool that can directly measure a rock formation's permeability down a well. In case of its absence, which is common in most cases, an estimate for permeability can be derived from empirical relationships with other measurements such as porosity, NMR and sonic logging.
Thickness of rock with enough permeability to deliver fluids to a well bore. This property is often called “Net reservoir rock.” In the oil and gas industry, another quantity “Net Pay” is computed which is the thickness of rock that can deliver hydrocarbons to the well bore at a profitable rate.
Reservoir models are built upon their measured and derived properties to estimate the amount of hydrocarbon present in the reservoir, the rate at which that hydrocarbon can be produced to the Earth's surface through wellbores and the fluid flow in rocks. In the water resource industry, similar models are used to compute how much water can be produced to the surface over long periods of time, without depleting the aquifer.
Rock mechanical properties
Some petrophysicists use acoustic and density measurements of rocks to compute their mechanical properties and strength. They measure the compressional (P) wave velocity of sound through the rock and the shear (S) wave velocity and use these with the density of the rock to compute the rocks' compressive strength, which is the compressive stress that causes a rock to fail, and the rocks' flexibility, which is the relationship between stress and deformation for a rock. Converted-wave analysis is also used to determine subsurface lithology and porosity.
These measurements are useful to design programs to drill wells that produce oil and gas. The measurements are also used to design dams, roads, foundations for buildings, and many other large construction projects. They can also be used to help interpret seismic signals from the Earth, either man-made seismic signals or those from earthquakes.
Ore quality
Bore holes can be drilled into ore bodies (for example coal seams or gold ore) and either rock samples taken to determine the ore or coal quality at each bore hole location or the wells can be wireline logged to make measurements that can be used to infer quality. Some petrophysicists do this sort of analysis. The information is mapped and used to make mine development plans.
Methods of analysis
Coring and special core analysis is a direct measurement of petrophysical properties. In the petroleum industry rock samples are retrieved from subsurface and measured by core labs of oil company or some commercial core measurement service companies. This process is time consuming and expensive, thus can not be applied to all the wells drilled in a field.

Well Logging is used as a relatively inexpensive method to obtain petrophysical properties downhole. Measurement tools are conveyed downhole using either wireline or LWD method.
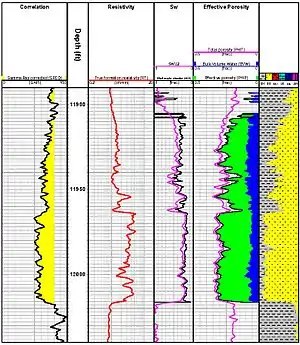
An example of wireline logs is shown in Figure 1. The first “track”, shows the natural gamma radiation level of the rock. The gamma radiation level “log” shows increasing radiation to the right and decreasing radiation to the left. The rocks emitting less radiation have more yellow shading. The detector is very sensitive and the amount of radiation is very low. In clastic rock formations, rocks that have smaller amounts of radiation are more likely to be coarser grained and have more pore space, rocks with higher amounts of radiation are more likely to have finer grains and less pore space.[5]
The second track over in the plot records the depth below the reference point which is usually the Kelly bush or rotary table in feet, so these rocks are 11,900 feet below the surface of earth.
In the third track, the electrical resistivity of the rock is presented. The water in this rock is salty and the salt in the water causes the water to be electrically conductive such that lower resistivity is caused by increasing water saturation and decreasing hydrocarbon saturation.[6]
The fourth track, shows the computed water saturation, both as “total” water (including the water bound to the rock) in magenta and the “effective water” or water that is free to flow in black. Both quantities are given as a fraction of the total pore space.
The fifth track shows the fraction of the total rock that is pore space, filled with fluids. The display of the pore space is divided into green for oil and blue for movable water. The black line shows the fraction of the pore space which contains either water or oil that can move, or be “produced.” In addition to what is included in blackline, the magenta line includes the water that is permanently bound to the rock.
The last track is a representation of the solid portion of the rock. The yellow pattern represents the fraction of the rock (excluding fluids) that is composed of coarser grained sandstone. The gray pattern represents the fraction of rock that is composed of finer grained “shale.” The sandstone is the part of the rock that contains the producible hydrocarbons and water.
Rock volumetric model for shaly sand formation
Symbols and Definitions:

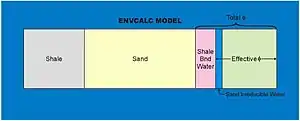
The following definition and petrophysics model are a typical shaly sand formation model which assumes: 1. Shale is composed of silt, clay and their bounded water which will not flow. 2. Hydrocarbon are stored only in pore space in sand matrix.
ΦT – Total porosity (PHIT), which includes the pore space in sand and shale.
Sw – Total water saturation, the fraction of the pore space occupied by water.
Φe – Effective shale corrected porosity which includes only the pore space in sand. The pore space in shale which is filled with bounded water is excluded.
Swe – Effective shale corrected water saturation. The volumetric fraction of Φe which is occupied by water.
Vsh – Volumetric fraction of shale. This includes medium to very fine silt plus clay and the shale bound water.
Φsh – Shale porosity. Volumetric fraction of pore space in shale. These pore space is filled with bounded water by definition.
Key equations:
(1-Φe-Vsh) + Vsh + Φe*Swe + Φe*(1-Swe) = 1
Sandstone matrix volume + shale volume + water volume in sand + hydrocarbon volume in sand = total rock volume
Φe = ΦT – Vsh *Φsh
See also
References
- Tiabb, D. & Donaldson, E.C. (2004). Petrophysics. Oxford: Elsevier. p. 1. ISBN 0-7506-7711-2.
- "Lithology". Earthquake Glossary. US Geological Survey. Retrieved 29 October 2010.
- "Porosity", Schlumberger Oilfield Glossary. Retrieved 12 October 2018.
- "Water saturation", Schlumberger Oilfield Glossary. Retrieved 12 October 2018.
- Poupon, A.; Clavier, C., Dumanoir, J., Gaymard, R., Misk, A. (1970). "Log Analysis of Sand-Shale SequencesA Systematic Approach". Journal of Petroleum Technology. 22 (7): 867–881. doi:10.2118/2897-PA.CS1 maint: multiple names: authors list (link)
- Brown, G. A. (June 1986). A Mathematical Comparison of Common Saturation Equations. SPWLA twenty-seventh annual logging symposium. 1986-T.
- Guéguen, Yves; Palciauskas, Victor (1994), Introduction to the Physics of Rocks, Princeton University Press, ISBN 978-0-691-03452-2
- Mavko, Gary; Mukerji, Tapan; Dvorkin, Jack (2003), The Rock Physics Handbook, Cambridge University Press, ISBN 978-0-521-54344-6
- Santamarina, J. Carlos; Klein, Katherine A.; Fam, Moheb A. (2001), Soils and Waves: Particulate Materials Behavior, Characterization and Process Monitoring, John Wiley & Sons, Ltd., ISBN 978-0-471-49058-6
- Tiab, Djebbar; Donaldson, Erle C. Petrophysics Theory and Practice of Measuring Reservoir Rock and Fluid Transport Properties (3rd ed.). Oxford: Gulf Professional Pub. ISBN 978-0-12-383848-3.
- Raquel, S.; Benítez, G.; Molina, L.; Pedroza, C. (2016). "Neural networks for defining spatial variation of rock properties in sparsely instrumented media" (PDF). Boletín de la Sociedad Geológica Mexicana. 553. Retrieved 12 October 2018.