Poverty in Canada
Poverty in Canada refers to people that do not have "enough income to purchase a specific basket of goods and services in their community."
Canada's official poverty line was re-defined in 2018 based on the Market Basket Measure.[1] An alternative measure for poverty, the Low Income Measure (LIM), defined as household after-tax income below half of the median after-tax income, was reported at 13.0% in 2017.[1]
The number of people living below the official poverty line decreased substantially from 12.1% in 2013 to 9.5% in 2017.[2]
A February 2020 Statistics Canada report, that is based on 2018 income tax returns, says that 3.2 million Canadians were living below the poverty line.
Current overview
According to Statistics Canada 2018 Canadian Income Survey (CIS), published on February 24, 2020, the Official Poverty Line used by the Government of Canada, is the market basket measure (MBM).[3] The MBM definition states that a "family lives in poverty if it does not have enough income to purchase a specific basket of goods and services in its community." [3]
According to this definition, a February 2020 Statistics Canada report, there were approximately 3.2 million Canadians living below Canada's Official Poverty Line, based on 2018 income tax returns.[3][4] This represents 8.7% of the population. In comparison, in 2017, 9.5% of the population in 2017 were living below the poverty line.[3]
In 2018, In Canada, there were 566,000 children under 18 living in poverty—representing 8.2% of the population. Of these, the poverty rate for children in couple families was 5.8% compared to 26.2% in female lone parent families.[3] The number of children living in poverty in Canada peaked in 2012 at 1 million, representing 15% of the population.[3] Children in lone-parent families remain more vulnerable to poverty. In 2018, the child poverty rate was 5.8% for those living in couple families, compared with 26.2% for those in female lone-parent families.[3] In 2018, there were 216,000 persons aged 65 years living below the poverty line. The percentage of seniors living in poverty was 1.7 for those living with families, and 7.9% for unattached seniors.[3]
In a March 2019 the Organisation for Economic Co-operation and Development (OECD) reported that Canada's relative poverty rate of 12.4%, was "slightly above" the average for OECD member countries, which is 11.7%.[5] While poverty rates for the elderly population was lower than average compared to other OECD countries, the poverty rates for children and youth in Canada was higher than the OECD average. In Canada in 2019, the elderly had the "lowest poverty rate amongst all age-groups in Canada."[5]
Poverty measurement in Canada
A variety of poverty measurements have been used in Canada by researchers and governments, including the Low-Income Cut-Off (LICO), Low Income Measure (LIM), and Market Basket Measure (MBM).[6][7]
In August 2018, the federal government, under Prime Minister Justin Trudeau, adopted the Market Basket Measure (MBM) of poverty as the official poverty line.[8]
Based on the MBM, a 26 February 2019 Statistics Canada report said that overall poverty in Canada had fallen from 12.1% in 2013 to 9.5% in 2017.[9] This is slightly below the average value of poverty for the years 2000–2009.[10]
The Canadian government (in a report released in 2018 as "Opportunity For All") aims to reduce the percentage of people in poverty to 10% by 2020 and to 6% by 2030. [11][12]
Market Basket Measure (MBM)
Government of Canada is using the Market Basket Measure (MBM) of poverty as official poverty line since August 2018.[13] The MBM was developed in 2003[14][15] and the MBM thresholds take into account community size, location and household and composition, estimating the disposable income required to meet basic needs.[16][17] Forty eight Canadian communities have been included in the measure.[7] The MBM was back-calculated until 2000 and in the years until 2009 was on average 10.4% with a high of 11.9% in 2000 and a low of 8.8% in 2007.[10] The latest available value for 2017 reports the MBM based poverty rate at 9.5%.[18]
Low-Income Cut-Off
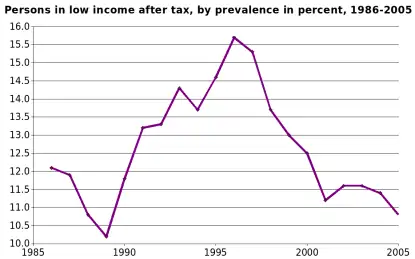
According to the Low-Income Cut-Off (LICO), there was a dramatic increase in poverty in Canada from the mid-1990s to 2020. LICO—which is updated annually for inflation but not for changes in spending patterns—measures the amount of money a family spends on necessities, such as housing, food and clothing, as determined by federal public servants. Based on LICO, a family that spends 20% more of their income on necessities, than the average Canadian family, they fall below the LICO poverty line. LICO measurements have been questioned.[19][20] By 2007, Low-Income Cut-Off (LICO) rates were often quoted by the media as a measure of poverty[21] even though Statistics Canada had stated that it was not a poverty measure.[22]
The measure was reported by Statistics Canada since the 1960s.[23] They were reported only in their "pre-tax" form until 2000, at which point Statistics Canada started to publish both pre and after-tax LICO rates. After-tax LICO rates have been retroactively calculated back to 1986. The measure is intended to represent an income threshold below which a family will likely devote a larger share of its income on the necessities of food shelter and clothing than the average family.[24] As of 2011, 8.8% of Canadians are in a family whose income is below the after-tax low-income cut-off.[25]
There are 7 family sizes and 5 community sizes, resulting in 35 total LICO groups, each one evaluated on a pre and after-tax basis (70 calculations in total). The LICO is currently set at 63% of the average family income within each group. This stems from the 1992 Family Expenditures Survey, which showed the average family spent 43% of its after-tax income on food, shelter and clothing, plus Statistics Canada added an additional 20% margin.
Statistics Canada prefers using the after-tax LICO over the pre-tax LICO "to draw conclusions about [families] overall economic well-being";[26] however, the pre-tax measures are needed depending on the study being conducted because some sources of data, such as the census, contain only pre-tax income information. It can also be useful to know the pre-tax income profile of groups before the effects of progressive tax rates.
Statistics Canada calculates the LICO threshold separately based on the size of settlements.[27]:104 There are five sizes—"small rural settlements, urban areas with populations of fewer than 30,000, urban centres with 30,000-99,999 people, urban centres with 100,000-499,000 people, and cities with over 500,000.":104 Poverty in Canada is most prevalent in "larger urban centres designated as census metropolitan areas (CMAs), and all of the CMAs LICOs are calculated in the last of the categories above. LICOs does not factor in the difference in the cost of living by community. In Toronto, Vancouver, and Montreal, the cost of housing is very high compared to Montreal, for example. The LICO measure of poverty may inadvertently "overestimate real poverty in a city with a lower cost of living such as Montreal, while underestimating it in cities with costs of living that are far above the average."[27]:104
In 2008, the Central Intelligence Agency (CIA) reported an estimate of 9.4% in The World Factbook. They noted that this figure was higher than population below poverty line figures for countries with comparable economies as an artifact of it being the LICO.[28]
Low Income Measure
The Low Income Measure is a purer measure of relative income. It is defined as 50% of median income, adjusted for family size. In effect, this measure indicates the percentage or number of people in the bottom income quartile.
It is considered an especially useful measure for international comparisons, and is popular with anti-poverty groups and some foreign governments (e.g., Ireland).[29] It results in a higher measure of poverty compared to other measures. In 2017, it was estimated to be 12.9% on an after-tax basis.[25]
| Province | LIM-AT (2016)[30] |
|---|---|
| 9.3% | |
| 15.5% | |
| 15.4% | |
| 17.1% | |
| 15.4% | |
| 17.2% | |
| 14.4% | |
| 16.9% | |
| 14.6% | |
| 12.8% | |
| Canada | 14.2% |
Gini coefficient
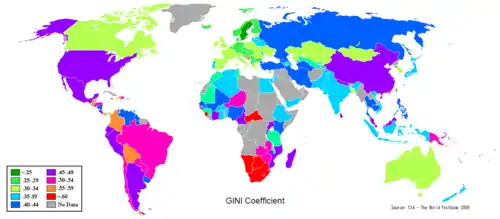
The Gini coefficient is a measure of statistical dispersion most prominently used as a measure of inequality of income distribution or inequality of wealth distribution. It is defined as a ratio with values between 0 and 1: the numerator is the area between the Lorenz curve of the distribution and the uniform distribution line; the denominator is the area under the uniform distribution line. Thus, a low Gini coefficient indicates more equal income or wealth distribution, while a high Gini coefficient indicates more unequal distribution. 0 corresponds to perfect equality (everyone having exactly the same income) and 1 corresponds to perfect inequality (where one person has all the income, while everyone else has zero income). The Gini coefficient requires that no one have a negative net income or wealth.
Serious consideration of the Gini coefficient for public policy implications is rare in Canada. Discussion of income inequality in the Canadian media generally implies that income inequality should be continually reduced as an objective, whereas international economists evaluating Gini coefficients generally focus on the idea of targeting an optimal range for the Gini coefficient. Some researchers have suggested the optimal Gini coefficient range is about .25-.40 (Wolfgang Kitterer, 2006, More Growth through Redistribution?). As of 2017, the Gini coefficient for Canada was estimated to be 0.31 on an after-tax basis (basically stable since 2014).[31][32][33]
History of poverty in Canada
Prior to Confederation, English Poor Laws were only in effect in the Maritime colonies. While charities and churches[34] took some responsibility for the poor, many people "ended up in houses of refuge, mental institutions, or prisons."[35]
The British North America Act of 1867 Constitution Act, 1867 established Canada as a self-governing country and led to the creation of the 1876 Indian Act, the primary document which governs how the Canadian state interacts with the First Nations. Throughout its long history the Indian Act has been an ongoing source of controversy.[36][37] The provisions of Section 91(24) of the Constitution Act, 1867, provided Canada's federal government exclusive authority to legislate in relation to "Indians and Lands Reserved for Indians".[38] The Indian Act, its corresponding federal policies and funding mechanisms, has been blamed for the extreme poverty experienced by First Nations in Canada since its inception.[39]
By 1900, the number of unemployed urban poor had increased, in pace with urbanization and industrialization in the late Victorian period.[40] Faced with lack of jobs, lay-offs, and economic cycles, one in seven Canadian families were unable to survive on pooled wages.[35] Following a brief period of modest growth in the early 1900s, World War I brought rapid inflation. Canada's first census in 1911, showed that most Canadians did not earn enough to pay for essential needs.[41]:481 Wages did not increase until the post-war period in the 1920s.
In the 1930s, the Great Depression caused an increase in unemployment and poverty.[35][42] In October 1935, Prime Minister William Lyon Mackenzie King introduced a new era in which he sought to banish "poverty and adversity, want and misery" from Canada.[43] His commitment to help the underprivileged was similar to that of the American President Franklin D. Roosevelt with his New Deal.[44][45] Mackenzie King introduced a wide range of New Deal-like reforms, including the 1937 Federal Home Improvement Plan, which provided subsidized rates of interest, and the 1938 National Housing Act that supported low-rent housing.[46][47] He also introduced compulsory contributions for pensions in 1939 and subsidies for farmers in 1940. The UK's influential Beveridge Report of 1942 and its Canadian counterpart, commissioned by Mackenzie King—the 1943 Report on Social Security for Canada by Leonard Marsh—called for the creation of a postwar welfare state, a comprehensive system of social security with full employment that would ultimately end all poverty.[48] Both these reports reflected Keynesian economics—the major economic theory of the postwar period. The Marsh Report recommended a broad range of social assistance, social insurance and public welfare programs.[49] In 1944, Mackenzie King introduced the Family Allowance program, which was the first universal social welfare program in Canada.[35] In 1948, the federal government subsidized medical services in the provinces.[50] During World War II, a small unemployment insurance program was introduced.[35] These actions formed the foundations of Canada's "social security system or welfare state" which succeeded in "reducing the impact of poverty for many families."[35]
In 1921, 1931, and 1941, the majority of Canadians lived in poverty, based on the annual census.[41]:481 For three decades following WWII, Canada's strong economy facilitated the introduction and expansion of social programs. By 1951, the number of people living in poverty has become a minority. By 1961, only 15% of Canadians lived in poverty.[41]:481
The United States launched a "war against poverty" in 1964. In 1965, the Canadian federal government undertook a study to examine greater federal-provincial co-operation to combat poverty.[51]
In 1966, the Canada Pension Plan and Quebec Pension Plan came into effect.[48] The 1967 Guaranteed Income Supplement assisted seniors and near-seniors who would not be able to benefit fully from the other government pension plans.[48][52] Statistics Canada's 1968 report Canadians' incomes provides the "basis for defining and measuring low incomes in Canada."[51] The 1968 Economic Council of Canada (ECC) report said that 27% of Canadians lived in poverty. In response to the ECC report, a special Senate committee on poverty, was commissioned—chaired by David Croll—that undertook "cross-country hearings and investigations."[51] The Croll report, published in 1971, "reiterated much of what had been revealed in the ECC's report and proposed a guaranteed annual income program to eliminate poverty in Canada".[51] A Senate inquiry estimated that as many as 1 in 4 Canadians were living in poverty in 1969.[53]
By the end of the 1960s, Statistics Canada estimated that the number of Canadians living in poverty—using measurements drawn up by Jenny Podoluk—had fallen from about 25% of the population in 1961 to about 18% in 1969.[54] From 1969 to 1982, the proportion of families with incomes below the poverty line fell from 20.8% to 13.9%.[55]
In 1976, Canada ratified the International Covenant on Economic, Social and Cultural Rights, which obligated the federal government to consider poverty as a human rights issue.[56]
Against the backdrop of the early 1980s recession, which affected much of the developed world in the late 1970s and early 1980s,[57][58] and left Canada with weaker economic growth and inflation, Prime Minister Trudeau introduced a series of unpopular budgets.[57][58] His Finance Minister Allan MacEachen said that the global oil price shocks—in 1973 and again in 1979—had caused a "sharp renewal of inflationary forces and real income losses" in Canada and in the industrial world...They are not just Canadian problems ... they are world-wide problems."[59] Concerns about the recession, were raised by world leaders at the Venice Summit, at meetings of Finance Ministers of the International Monetary Fund (IMF) and the Organisation for Economic Co-operation and Development (OECD), Leaders of developed countries raised their concerns at the Venice Summit, at meetings of Finance Ministers of the International Monetary Fund (IMF) and the Organisation for Economic Co-operation and Development (OECD).[59] The Bank of Canada described Canadians experiencing a "deeply troubling air of uncertainty and anxiety" about the economy.[59][60][61][62] In his last term in office, Trudeau expanded government support for Canada's poorest citizens.[63]
In Western countries, unemployment increased from the mid-1970s to mid-1980s, partly because of two oil shocks that caused the price of oil to rise, a decline in birthrates, increased competition from Asia and Latin America—whose economies were emerging, and the automation of jobs.[64] As corporations saw a loss of profits with a militant labour movement winning wage settlements, Canada followed in the steps of the US, and introduced statutory wage and price controls in 1975.[64] The political success of Margaret Thatcher in Britain in 1979, Ronald Reagan in the United States in 1980, Helmut Kohl in Germany in 1983, and Brian Mulroney in Canada 1984, indicated a shift away from the welfare state.[64] According to a 1989 article in the journal, Capital and Class, Prime Minister Mulroney implemented neoliberal policies by decreasing the state's involvement in the monetary sector and loosening restrictions on trade with the United States and overseas.[65] He introduced legislation to balance the budget.[65] He worked towards limiting government involvement in the economy and related institutions.[65] The neoliberal policies introduced by Mulroney were moderate and less radical compared to those introduced by the President Reagan.[65] A 2014 article in the journal Forum for Social Economics, said that neoliberal policies enacted since the 1980s resulted in a global trend of inequality in income distribution.[66] According to David Harvey, governments implementing neoliberal policies focus on optimizing conditions for market activity and capital accumulation and way from a social state and redistributive policies.[67][68]
Since the late 1980s, in Canada and many industrial nations, there was a rise in poverty.[69]
A 2011 Canadian Review of Social Policy article said that Montreal, Toronto, and Vancouver were the three major gateway cities where the "vast majority of immigrants" settled and where they "experience greater threats of poverty."[27]:107 Even immigrants who arrive in Canada with "strong human capital assets" have to face a "more challenging labour market and economic environment" than those who arrived in the 1990s. This newer cohort became "far more vulnerable to low income and poverty" over longer periods of time.[27]:107 According to a 2000 article in the Journal of International Migration and Integration, using data from the 1996 census, immigrants in Canada are more likely to live in high-poverty neighbourhoods, than non-immigrants.[69] Immigrants in these extremely poor neighbourhoods experience social isolation, as well as other social ills associated with high-poverty neighbourhoods—"poor educational and health care services, high crime, and high unemployment rates".[69] From 1918 to 2001, "spatial concentration of family poverty in the City of Toronto" had increased.[70]:1 Research undertaken in the mid-1990s revealed that there was a "strong association between race and minority status, and living in neighbourhoods of concentrated poverty in Canada."[70]:1[71][72]
In 1997, Canada did not have an official poverty measurement.[22]
In 2003, the United Nations Committee on Economic, Social and Cultural Rights called on Canada to "expand protection in human rights legislation . . . to protect poor people . . . from discrimination because of social or economic status" The report noted the "persistence of poverty" in Canada, particularly for vulnerable groups.[56]
The poverty rate in Canada in 2008, was among the highest of the OECD member nations, the world's wealthiest industrialized nations.[73]
In 2013, Canada's high poverty rate ranked among the worst of 17 high income countries with 12.1% living in poverty.[2] Canada's child poverty rate was 15.1% compared to 12.8% in the mid-1990s. Only the United States ranked lower.[74]
By 2017, the number of people living below the official poverty line had decreased substantially to 9.5%.[2]
Immigrant Poverty in Canada
New immigrants are more likely to face the adversity that comes with poverty for numerous reasons. Many find this fact unsettling as Canada has built their economic structure around the work performed by immigrants and as a result, is a leading destination for individuals wanting to leave their country.[27] In addition, research suggests that recent immigrants are more disadvantaged compared to individuals who have immigrated in the past. There are many factors that contribute to this, but there is a strong emphasis on the fact that new immigrants often face an economic market that can only provide them with poorly paid occupations.[27]
Many believe that even well-rounded immigrants are not immune to the impoverished living conditions that many newcomers face. It is recognized that immigrants who have worked for an education in their previous country of residence often face obstacles in getting their education accounted for in Canada.[27] To build on this, individuals who immigrate to Canada tend to hold higher levels of education as compared to individuals who were born in Canada. This inevitably puts them in a disadvantaged position as they are competing for jobs against others who often have their educational achievements recognized by employers. It is evident that the problem is not necessarily that immigrants are under qualified, but that their qualifications often go unrecognized by employers.[27]
As a result of these factors, immigrants tend to reside in parts of cities that are inhabited by individuals who are employed in low income positions. Residents of such areas are often left to confront problems such as unreliable transit systems and substandard living conditions. These areas often have fewer services available to individuals, that often puts new immigrants in a more difficult position. Further, this system of settlement often leads to segregated living conditions based on ethnicity.[27]
Relative poverty in the Canadian provinces
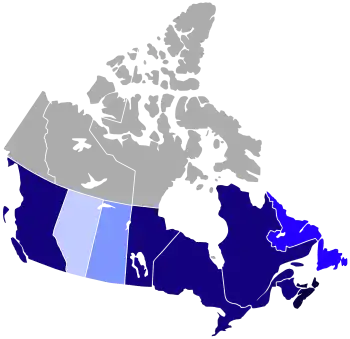
Caption:
British Columbia holds the title of having the most prevalent rates of impoverishment and childhood poverty within Canada.[75] There are many factors that lead up to the disproportionate rates of poverty which affects many British Columbians. The most notable of which is insufficient wages paired with inadequate social assistance resources.[76] British Columbia does not record high rates of poverty because of large rates unemployment, but it has more to do with the insufficient wages that many British Columbians receive. This means that although many British Columbians are employed, their wages do not give them the opportunity to live without impoverished living conditions.[75] To add on to this, this province has seen an increase in costs for accommodation and groceries which adds more obstacles that the poor must face.[76] With that being said, it has been noted that British Columbia is the lone province within the country that does not have any measures put in place to reduce the instances of impoverishment.[76] Although the quality of life for the poor has been on the decline, the wealthy residents have been benefiting from the policies that were put in place by the Liberal government when they held power.[75] It goes without saying, that British Columbia is faced with a disproportionate rate of poverty because of many interlocking factors. Nonetheless, this province has a lot of room for improvement in terms of implementing policies that can increase of quality of life for a large proportion of its residents.
Indigenous children in Canada
According to a left-wing think tank, the Canadian Centre for Policy Alternatives, "Based on data from the 2006 census, this study found that the average child poverty rate for all children in Canada is 17%, while the average child poverty rate for all Indigenous children is more than twice that figure, at 40%." "50% — of status First Nations children live below the poverty line. This number grows to 62% in Manitoba and 64% in Saskatchewan."[77] The study referred to used the Low Income Measure as their definition for poverty, which always shows a high rate. Nonetheless, the much higher LIM statistics for indigenous families indicate a much higher level of poverty among that demographic.
Canada has received international recognition for its social welfare system, but this image of Canada does not reflect the reality for many Indigenous children. Canada has been able to avoid criticism for its childhood poverty rate as statistics often do not include the rates of poverty within Indigenous reserves and the three territories in Canada.[78] Once the data on childhood poverty in these areas is included, the statistics suggest that the number of children living in deprivation rises to around 18%. This percentage of childhood impoverishment seems to imply that Canada's allocation of funding designed to assist Indigenous children is failing to match the severity of the problem.[78]
It is evident that all levels of government are not completing their role in assisting Indigenous children. Educational institutions that are located on reserves often do not get the resources they need which affects the quality of education these children receive.[78] This includes projects that aim to help give Indigenous children a chance to continue with their studies after completing high school. The reality of these initiatives is that they do not have the necessary resources to help majority of applicants as the ratio of applicants far outweighs the funding that they receive.[78]
Indigenous children face many other obstacles due to the lack of assistance and resources from the government. There are reserves where residents are still fighting for access to safe drinking water.[78] Further, such children are likely to reside in shelters that do not have enough room to adequately occupy all the residents. In addition, often children residing on reserves are living within houses that are in substandard condition and thus, needing urgent renovations.[78]
Poverty reduction strategies
Several Canadian provinces are introducing poverty reduction strategies, following the examples set by the European Union, Ireland and the United Kingdom. Newfoundland & Labrador, Nova Scotia, Quebec, Ontario and Manitoba are all developing provincial strategies. Quebec and Manitoba have enshrined their efforts in legislation. Newfoundland & Labrador has established a provincial ministry. Ontario has set a cabinet roundtable to address child poverty, as per the Liberals's campaign promise.
Because of these moves, each province is exploring the development of a measurement tool to track any progress made on reducing poverty, such as the use of a Deprivation Index.
As of August 2018, the Government of Canada has introduced the "Opportunity for All" which is being deemed Canada's first official poverty reduction strategy.[79]
Low income assistance
Reduced tax burden
The Canadian income tax system is highly progressive. This can be seen by comparing the 2005 pre-tax low-income cut-off rate of 15.3%[80] with the after-tax rate of only 10.8%.[81] It is also evident in the Gini coefficient, which was estimated to be 0.428 on a pre-tax basis but only 0.315 on an after-tax basis.[31] The Conference Board of Canada 2013 study noted the Canadian system provides relief to the poor which contributes to lowering poverty rates in Canada. Their 2013 report stated that without Canada's tax system and transfers, the poverty rate would have been 23% not the current 12%.[74]
Social programs
The Conference Board of Canada 2013 study noted "that due to the tax system and transfers to the poor, income inequality is 27% lower than it otherwise would be."[74] Canada has a wide range of government transfers to persons, which totaled $176.6 billion in 2009.[82] Some of the transfers designed to assist low-income people in Canada include Welfare and Old age security. There is also an extensive mandatory Employment Insurance program designed to assist workers who have become unemployed to lessen the chance of them falling into poverty.
In addition to government transfers, there are number of other publicly funded services and social programs that benefit those with low-incomes like Medicare, Public education for grade school; subsidized post-secondary education, Subsidized housing, and Employment equity programs, which often target various groups of people who are deemed to be susceptible to having low-incomes.
Working income tax benefit
The WITB was introduced in 2007 to encourage low income people to enter the labour force, and to provide them with increased financial support. The WITB has been expanded considerably since its introduction. As of 2012, it is worth up to $970 for a single individual, $1762 for couples and single parent families.[83] A person or couple must have at least $3,000 in employment income, and not be a student, to be eligible for WITB. Benefits increase, and then decrease, with income, and are completely clawed back at an income of $11,011 for singles, $15,205 for couples or single parents (in 2012).These credits are not taxed (see Income taxes in Canada#Income not taxed).
Child credits
Low-income Canadians are eligible for the Canada Child Tax Benefit (a federal benefit), and provincial child tax credits or benefits and Québec family allowances. For example, Ontario pays a benefit scheduled to grow to $180 per month by 2011 for a family earnings less than $20,000 with two children.[84] These credits are not taxed (see Income taxes in Canada#Income not taxed).
Minimum wage laws
Under the Constitution of Canada, the responsibility for enacting and enforcing labour laws including minimum wages in Canada rests with the ten provinces, the three territories also having been granted this power by virtue of federal legislation. This means that each province and territory has its own minimum wage. The lowest general minimum wage currently in force is that of the Saskatchewan ($11.45/hour), the highest is that of Alberta ($15.00/hour).[85] Some provinces allow lower wages to be paid to liquor servers and other tip earners, and/or to inexperienced employees
See also
- Basic income in Canada
- Poverty by country
- Campaign 2000
Notes
References
- "The Daily — Canadian Income Survey, 2017". Retrieved 13 February 2020.
- "Persons living below Canada's official poverty line (Market Basket Measure), 2013 to 2017". Retrieved 13 February 2020.
- "Canadian Income Survey, 2018". The Daily. 24 February 2020. Retrieved 25 February 2020.
- "Statistics Canada says 3.2M living in poverty". The Star. Ottawa. 24 February 2020. Retrieved 25 February 2020.
- How does Canada compare? (PDF), Society at a Glance 2019, Organisation for Economic Co-operation and Development (OECD), 27 March 2019, retrieved 25 February 2020
- "Low Income in Canada: 2000-2006 Using the Market Basket Measure - October 2008". Human Resources and Skills Development Canada. Archived from the original on 22 June 2009.
- "Standing Committee on Human Resources, Social Development and the Status of Persons with Disabilities". Archived from the original on 24 June 2009. Retrieved 17 April 2008.
- Canada, Government of Canada, Statistics. "Measuring low income and Canada's Official Poverty Line". www.statcan.gc.ca. Retrieved 18 October 2018.
- "Persons living below Canada's official poverty line (Market Basket Measure), 2013 to 2017". 26 February 2019. Retrieved 25 February 2020.
- "Description for figure 2.1 — Low-income rates and unemployment rate, Canada, 1976 to 2009". Retrieved 14 February 2020.
- "Canada's Poverty Reduction Strategy – An Update - Canada.ca". Retrieved 14 February 2020.
- "Canada's First Poverty Reduction Strategy - Canada.ca". Retrieved 14 February 2020.
- Canada, Government of Canada, Statistics. "Measuring low income and Canada's Official Poverty Line". www.statcan.gc.ca. Retrieved 18 October 2018.
- Sarlo, Chris. "The Market Basket Measure of Poverty" (PDF). fraser.stg.devlin.ca. Archived from the original (PDF) on 27 March 2009. Retrieved 10 March 2009.
- "What do we Mean by Poverty?". Shillington.ca. 15 January 1999. Archived from the original on 1 February 2011. Retrieved 28 February 2011.
- "Market Basket Measure Report now available". Rhdcc.gc.ca. 7 March 2005. Archived from the original on 17 July 2011. Retrieved 28 February 2011.
- "Low Income Incidence / Financial Security / Indicators of Well-being in Canada". .hrsdc.gc.ca. Archived from the original on 6 July 2011. Retrieved 28 February 2011.
- "Canada reaches lowest poverty rate in history - Canada.ca". Retrieved 14 February 2020.
- Falvo, Nick (30 October 2019). "Ten things to know about poverty measurement in Canada". Retrieved 25 February 2020.
- "Ten things to know about income support for low-income households in Alberta - Behind the Numbers". Retrieved 25 February 2020.
- "Poverty Measure in Canada Analysis". CBC. Archived from the original on 2 January 2007. Retrieved 4 January 2007.
- "On poverty and low income". Statistics Canada. 1997. Archived from the original on 16 September 2007. Retrieved 2 December 2007.
- "What's behind a poverty line?". Canadian Council on Social Development. 9 June 2000. Archived from the original on 14 December 2007. Retrieved 2 December 2007.
- "Low Income Cut-offs for 2005 and Low Income Measures for 2004" (PDF). Statistics Canada. 2006. Archived from the original (PDF) on 20 March 2007. Retrieved 2 December 2007.
- "Persons in low income, by economic family type". 0.statcan.gc.ca. 27 June 2013. Archived from the original on 22 January 2016. Retrieved 12 October 2015.
- "Low income definitions". Statistics Canada. 2005. Archived from the original on 5 March 2007. Retrieved 2 December 2007.
- Shields, John; Kelly, Philip; Park, Stella; Prier, Nathan; Fang, Tony (2011). "Profiling Immigrant Poverty in Canada: A 2006 Census Statistical Portrait". Canadian Review of Social Policy (CRSP) (65/66): 93–111. Retrieved 26 February 2020.
- "Population below poverty line". The World Factbook (2008). CIA. 20 March 2008. Retrieved 25 February 2020.
- "LICOs - Absolute or relative poverty measure??". Canadiansocialresearch.net. 4 June 2008. Archived from the original on 17 July 2011. Retrieved 28 February 2011.
- "Low-income Indicators (4), Individual Low-income Status (6), Age (8) and Sex (3) for the Population in Private Households of Canada, Provinces and Territories, Census Divisions and Census Subdivisions, 2016 Census". Statistics Canada. Archived from the original on 11 May 2020. Retrieved 11 May 2020.
- "Income Inequality and Redistribution in Canada: 1976 to 2004". Statistics Canada. 11 May 2007. Archived from the original on 2 December 2007. Retrieved 2 December 2007.
- "Income Inequality in Canada". Retrieved 14 February 2020.
- "Income inequality, Gini coefficient, 0 = complete equality; 1 = complete inequality, 2018 or latest available". Retrieved 14 February 2020.
- Shillington, Richard (September 2011). "Poverty: A short history" (PDF). Manotick, Ontario: Tristat Resources. Archived from the original (PDF) on 27 October 2011. Retrieved 25 February 2020.
- Sager, Eric W. (17 May 2016). Belshaw, John Douglas (ed.). Poverty, 1867–1945. University of Victoria. Canadian History: Post-Confederation. ISBN 978-1-989623-12-1. Retrieved 25 February 2020.
- Leslie, John F. (2002), "The Indian Act: An Historical Perspective", Canadian Parliamentary Review, 25 (2), retrieved 12 September 2014
- Clegg 1982.
- Constitution Act Archived 10 August 2014 at the Wayback Machine
- "Summary of the Final Report of The Royal Commission on Aboriginal Peoples" (pdf). CTV Canada. 1996. Retrieved 25 February 2020.
- Baskerville, Peter A.; Sager, Eric W. (1998). Unwilling Idlers: The Urban Unemployed and Their Families in Late Victorian. University of Toronto Press. pp. 294. ISBN 0802081444. Retrieved 25 February 2020.
- Brown, Craig (1 October 2012). Illustrated History of Canada. McGill-Queen's Press - MQUP. ISBN 9780773540897. Retrieved 9 May 2018 – via Google Books.
- Struthers, James (1 May 1983). No fault of their own: Unemployment and the Canadian welfare state, 1914-1941. University of Toronto. ISBN 9780802065025.
- Raymond B. Blake (2009). From Rights to Needs: A History of Family Allowances in Canada, 1929–92. UBC Press. p. 33. ISBN 9780774858687.
- Raymond B. Blake (2009). From Rights to Needs: A History of Family Allowances in Canada, 1929–92. UBC Press. p. 33. ISBN 9780774858687.
- Neatby, H. Blair (1976). William Lyon Mackenzie King, 1932–1939: The Prism of Unity. Volume 3. University of Toronto Press. ASIN B000GPCV06., Ch. 2
- Ann McAfee. "Housing and Housing Policy". The Canadian Encyclopedia.
- Anabaptist/Mennonite Faith and Economics. 1994. ISBN 9780819193506.
- "1952-1967 Reducing poverty: The History of Canada's Public Pensions". Canadian Museum of History. Retrieved 25 February 2020.
- "Archived copy". Archived from the original on 24 September 2009. Retrieved 29 March 2009.CS1 maint: archived copy as title (link)
- Foundations of the Welfare State, 2nd Edition by Pat Thane, published 1996
- Ross, David P.; Scott, Katherine; Smith, Peter (2000), The Canadian Fact Book on Poverty
- Reducing Poverty 1952-1967 (PDF), Canadian Museum of History, p. 15, retrieved 25 February 2020
- "Social Security". The Canadian Encyclopedia. Archived from the original on 12 August 2012. Retrieved 12 August 2012.
- The Canadian economy: problems and policies by G. C. Ruggeri
- Drache, Daniel; Cameron, Duncan; Royal Commission on the Economic Union and Development Prospects for Canada (1985). The Other MacDonald Report: The Consensus on Canada's Future That the MacDonald Commission Left Out. James Lorimer & Company. p. 64. ISBN 978-0-88862-900-5.
- Canada, Canadian Human Rights Commission, Annual Report 2003 (Ottawa: Minister of Public Works and Government Services, 2003)
- Moy, Joyanna (1985). "Recent Trends in Unemployment and the Labor Force: 10 Countries" (PDF). Monthly Labor Review. 108 (8): 9–22. Retrieved 20 February 2020.
- Hammes, David; Wills, Douglas (2005). "Black Gold The End of Bretton Woods and the Oil-Price Shocks of the 1970s" (PDF). The Independent Review. 9 (4): 501–511. ISSN 1086-1653. JSTOR 24562081.
- MacEachen, Allan J. (28 October 1980), Budget 1980 (PDF), Ottawa, ON, retrieved 27 January 2015
- "Inflation calculation", Bank of Canada
- "Bank of Canada Interest Rate History", Canada Bubble
- “Uncertain Country.” Canada: A People’s History. CBC Television. Prod & Dir: Susan Dando. Aired: TVO: CICI, Toronto. January 10, 2005.
- Clarkson, Stephen (1988). "The Dauphin and the Doomed: John Turner and the Liberal Party's Debacle". In Penniman, Howard Rae (ed.). Canada at the Polls, 1984: A Study of the Federal General Elections. At the polls. Durham, NC: Duke University Press. pp. 98–99. ISBN 978-0-8223-0821-8. LCCN 87027252. Retrieved 28 November 2014.
- Phillips, Stephen (1999), The demise of universality: the politics of federal income security in Canada, 1978-1993
- Carroll, William K (July 1989). "Neoliberalism and the recomposition of Finance Capital in Canada". Capital and Class. 13 (2): 81–112. doi:10.1177/030981688903800106. ISSN 0309-8168. S2CID 154483294.
- Fiorentini, Riccardo (27 August 2014). "Neoliberal Policies, Income Distribution Inequality and the Financial Crisis". Forum for Social Economics. 44 (2): 115–132. doi:10.1080/07360932.2014.951376. ISSN 0736-0932. S2CID 154693538.
- A brief history of neoliberalism. Oxford University Press. 2007 [2005]. p. 247. ISBN 9780199283262. OCLC 952123825.
- Coulter, Kendra (January 2009). "Women, Poverty Policy, and the Production of Neoliberal Politics in Ontario, Canada". Journal of Women, Politics & Policy. 30 (1): 23–45. doi:10.1080/15544770802367788. ISSN 1554-477X.
- Kazemipur, Abdolmohammad; Halli, Shiva (1 March 2000). "The invisible barrier: Neighbourhood poverty and integration of immigrants in Canada". Journal of International Migration and Integration. 1 (1): 85–100. doi:10.1007/s12134-000-1009-1. ISSN 1874-6365. S2CID 145543834.
- Poverty by Postal Code: The Geography of Neighbourhood Poverty – 1981–2001 (PDF). United Way of Greater Toronto and The Canadian Council on Social Development (Report). University of Toronto. April 2004. p. 92. ISBN 0-921669-33-X. Retrieved 26 February 2020.
- Kazemipur, Abdolmohammad; Halli, Shiva S. (1997). "Plight of Immigrants: The Spatial Concentration of Poverty in Canada". Canadian Journal of Regional Science: 11–28.
- Hajnal, Zoltan L. (1995). "The Nature of Concentrated Urban Poverty in Canada and the United States". Canadian Journal of Sociology. 20 (4): 497–528. doi:10.2307/3341855. JSTOR 3341855.
- Growing unequal? Income distribution and poverty in OECD countries, Paris, France: Organisation for Economic Co-operation and Development (OECD), 2008
- "Child Poverty". Ottawa, ON: Conference Board of Canada. 2013. Archived from the original on 4 June 2013.
- Cohen and Klein, Marjorie and Seth (2011). "Poverty Reduction in British Columbia?: How "The Best Place on Earth" Keeps People Poorest". Canadian Review of Social Policy. 65: 58–75 – via ProQuest.
- Poverty, Canada Without. (2015). British Columbia Poverty Progress Profile. Canada Without Poverty. OCLC 945610602.
- Macdonald, David; Wilson, Daniel (June 2013). Poverty or Prosperity Indigenous Children in Canada (PDF) (Report). Canadian Centre for Policy Alternatives. Archived (PDF) from the original on 4 March 2016. Retrieved 19 June 2013.
- Macdonald, David (2016). Shameful neglect : indigenous child poverty in Canada. Wilson, Daniel,, Canadian Centre for Policy Alternatives. Ottawa, Ontario. ISBN 978-1-77125-284-3. OCLC 953638637.
- Canada, Employment and Social Development. "Poverty Reduction Strategy - Canada.ca". canada.ca. Retrieved 18 October 2018.
- "Persons in low income before tax, by prevalence in percent". Statistics Canada. 1 May 2007. Archived from the original on 21 December 2007. Retrieved 4 December 2007.
- "Persons in low income after tax, by prevalence in percent". Statistics Canada. 1 May 2007. Archived from the original on 23 November 2007. Retrieved 4 December 2007.
- "Government transfer payments to persons". Statistics Canada. 8 November 2007. Archived from the original on 4 November 2008. Retrieved 4 December 2007.
- Woolley, Frances. "Five Years of the Working Income Tax Benefit". Archived from the original on 6 November 2012. Retrieved 3 November 2012.
- "Making It A Little Easier For Low-Income Ontario Families" (Press release). Government of Ontario. 22 February 2008. Archived from the original on 21 June 2009. Retrieved 22 February 2008.
- "Minimum Wage by Province". retailcouncil.org Retail Council of Canada. October 2019. Retrieved 6 October 2019.
Further reading
- Coon, Garson George (1998). Examining beliefs about the causes of unemployment and poverty: An analysis of the causal models from the research literature (D.S.W. thesis). Wilfrid Laurier University.
- Jeffery, Heather Elizabeth (1999). The construction of homelessness as a social problem: Linking contributing factors, mediating factors and interventive strategies (M.S.W. thesis). Wilfrid Laurier University.
- Morrison, Susan M. (1992). Mothers and Other Making Change: Empowerment through self-help and social action (M.A. thesis). Wilfrid Laurier University.
- Roberts, Alison J. Rice (2001). A qualitative study of presently and formerly homeless female adolescents (Ontario) (M.A. thesis). Wilfrid Laurier University.
- Raphael, Dennis (2011), Poverty in Canada: Implications for Health and Quality of Life, 2nd edition, Canadian Scholars' Press, ISBN 978-1551303949
- Snyder, Linda L. (2000). Women's employment initiatives as a means of addressing poverty: A comparative study of Canadian and Chilean examples (D.S.W. thesis). Wilfrid Laurier University.
External links
- Stats & Facts, Canadian Council on Social Development
- http://www.urbancentre.utoronto.ca/policyarchive/11policyarchivehousing.html#
- https://www.statcan.gc.ca/eng/consultation/mbm
| Provinces |
|
|---|---|
| Territories |
|
| |
| History |
| ||||
|---|---|---|---|---|---|
| Provinces and territories |
| ||||
| Government | |||||
| Politics | |||||
| Geography |
| ||||
| Economy | |||||
| Society | |||||
| Demographics |
| ||||
| Culture | |||||
| Symbols | |||||
| Article overviews | |||||
| Research | |||||
| |||||