Languages of Canada
A multitude of languages are used in Canada. According to the 2016 census, English and French are the mother tongues of 56.0% and 21.4% of Canadians respectively.[2] In total 86.2% of Canadians have working knowledge of English while 29.8% have a working knowledge of French.[3] Under the Official Languages Act of 1969, both English and French have official federal status throughout Canada, in respect of all government services, including the courts, and all federal legislation is enacted bilingually. New Brunswick is the only Canadian province that has both English and French as its official languages to the same extent, with constitutional entrenchment. Quebec's official language is French,[4] although, in that province, the Constitution requires that all legislation be enacted in both French and English, and court proceedings may be conducted in either language. Similar constitutional protections are in place in Manitoba, where English is the official language.
Canada's Official Languages Commissioner (the federal government official charged with monitoring the two languages) has stated, "[I]n the same way that race is at the core of what it means to be American and at the core of an American experience and class is at the core of British experience, I think that language is at the core of Canadian experience."[5] To assist in more accurately monitoring the two official languages, Canada's census collects a number of demolinguistic descriptors not enumerated in the censuses of most other countries, including home language, mother tongue, first official language and language of work.
Canada's linguistic diversity extends beyond the two official languages. "In Canada, 4.7 million people (14.2% of the population) reported speaking a language other than English or French most often at home and 1.9 million people (5.8%) reported speaking such a language on a regular basis as a second language (in addition to their main home language, English or French). In all, 20.0% of Canada's population reported speaking a language other than English or French at home. For roughly 6.4 million people, the other language was an immigrant language, spoken most often or on a regular basis at home, alone or together with English or French whereas for more than 213,000 people, the other language was an Aboriginal language. Finally, the number of people reporting sign languages as the languages spoken at home was nearly 25,000 people (15,000 most often and 9,800 on a regular basis)."[nb 1]
Canada is also home to many indigenous languages. Taken together, these are spoken by less than one percent of the population. About 0.6% Canadians (or 200,725 people) report an Indigenous language as their mother tongue.[nb 2]
Geographic distribution
The following table details the population of each province and territory, with summary national totals, by mother tongue as reported in the Canada 2016 Census.
| Province/territory | Total population | English | % | French | % | Other languages | % | Official language(s) |
|---|---|---|---|---|---|---|---|---|
| Ontario | 13,312,870 | 9,255,660 | 69.52% | 568,345 | 4.27% | 3,865,780 | 29.04% | English[8] |
| Quebec | 8,066,555 | 718,985 | 8.91% | 6,377,080 | 79.06% | 1,173,345 | 14.54% | French[4] |
| British Columbia | 4,598,415 | 3,271,425 | 71.14% | 71,705 | 1.56% | 1,360,815 | 29.59% | English (de facto) |
| Alberta | 4,026,650 | 3,080,875 | 76.51% | 86,705 | 2.15% | 952,785 | 23.66% | English |
| Manitoba | 1,261,615 | 931,410 | 73.83% | 46,055 | 3.65% | 316,120 | 25.06% | English |
| Saskatchewan | 1,083,240 | 910,865 | 84.09% | 17,735 | 1.64% | 173,475 | 16.01% | English |
| Nova Scotia | 912,300 | 838,055 | 91.86% | 33,345 | 3.66% | 49,165 | 5.39% | English (de facto) |
| New Brunswick | 736,280 | 481,690 | 65.42% | 238,865 | 32.44% | 25,165 | 3.42% | English, French |
| Newfoundland and Labrador | 515,680 | 501,350 | 97.22% | 3,020 | 0.59% | 13,035 | 2.53% | English (de facto) |
| Prince Edward Island | 141,020 | 128,975 | 91.46% | 5,395 | 3.83% | 7,670 | 5.44% | English (de facto) |
| Northwest Territories | 41,380 | 32,545 | 78.65% | 1,365 | 3.30% | 8,295 | 20.05% | Chipewyan, Cree, English, French, Gwich’in, Inuinnaqtun, Inuktitut, Inuvialuktun, North Slavey, South Slavey, Tłįchǫ[9] |
| Yukon | 35,555 | 29,765 | 83.72% | 1,815 | 5.10% | 4,665 | 13.12% | English, French |
| Nunavut | 35,695 | 11,745 | 32.90% | 640 | 1.79% | 24,050 | 67.38% | Inuit Language (Inuktitut, Inuinnaqtun), English, French[10] |
| Canada | 34,767,255 | 20,193,340 | 58.08% | 7,452,075 | 21.43% | 7,974,375 | 22.94% | English, French |
The two official languages
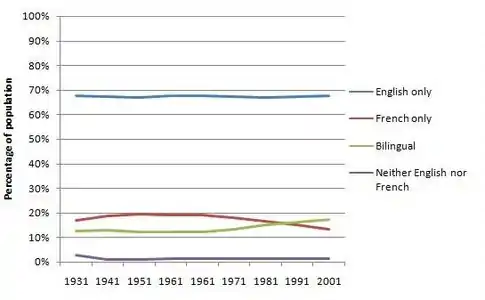
Home language: rates of language use 1971–2006
The percentage of the population speaking English, French or both languages most often at home has declined since 1986; the decline has been greatest for French. The proportion of the population who speak neither English nor French in the home has increased. Geographically, this trend remains constant, as usage of English and French have declined in both English and French speaking regions of the country, but French has declined more rapidly both inside and outside of Quebec. The table below shows the percentage of the total Canadian population who speak Canada's official languages most often at home from 1971 to 2006.[12] Note that there are nuances between "language most spoken at home", "mother-language" and "first official language": data is collected for all three, which together provide a more detailed and complete picture of language-use in Canada.
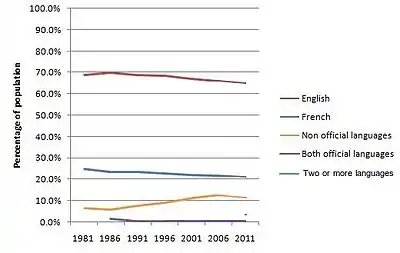
Use of English
In 2011, just under 21.5 million Canadians, representing 65% of the population, spoke English most of the time at home, while 58% declared it their mother language.[11] English is the major language everywhere in Canada except Quebec and Nunavut, and most Canadians (85%) can speak English.[14] While English is not the preferred language in Quebec, 36.1% of Québécois can speak English.[15] Nationally, Francophones are five times more likely to speak English than Anglophones are to speak French – 44% and 9% respectively.[16] Only 3.2% of Canada's English-speaking population resides in Quebec—mostly in Montreal.[nb 3]
In 2011, 28.4 million Canadians had knowledge of English while only 21.6 million Canadians spoke it most often at home.[18]
Use of French
In 2011, just over 7.1 million Canadians spoke French most often at home, this was a rise of 4.2%, although the proportion of people in Canada who spoke French "most often" at home fell slightly from 21.7% to 21.5% . Of these, about 6.1 million or 85% resided in Quebec.[19] Outside Quebec, the largest French-speaking populations are found in New Brunswick (which is home to 3.1% of Canada's Francophones) and Ontario (4.2%, residing primarily in the eastern and northeastern parts of the province and in Toronto and Ottawa). Overall, 22% of people in Canada declare French to be their mother language, while one in three Canadians speak French and 70% are unilingual Anglophones.[nb 4] Smaller indigenous French-speaking communities exist in some other provinces.[20] For example, a vestigial community exists on Newfoundland's Port au Port Peninsula; a remnant of the "French Shore" along the island's west coast.
The percentage of the population who speak French both by mother tongue and home language has decreased over the past three decades. Whereas the number of those who speak English at home is higher than the number of people whose mother tongue is English, the opposite is true for Francophones. There are fewer people who speak French at home, than learned French after birth.[21]
Ethnic diversity is growing in French Canada but still lags behind the English-speaking parts of the country. In 2006, 91.5% of Quebecers considered themselves to be of either "French" or "Canadian" origin. As a result of the growth in immigration, since the 1970s, from countries in which French is a widely used language, 3.4% of Quebecers indicated that they were of Haitian, Belgian, Swiss, Lebanese or Moroccan origin.[22] Other groups of non-francophone immigrants (Irish Catholics, Italian, Portuguese, etc.) have also assimilated into French over the generations. The Irish, who started arriving in large numbers in Quebec in the 1830s, were the first such group, which explains why it has been possible for Quebec to have had five premiers of Irish ethnic origin: John Jones Ross (1884–87), Edmund James Flynn (1896–97), Daniel Johnson Sr. (1966–68), Pierre-Marc Johnson (1985), and Daniel Johnson Jr. (1994).
In 1991, due to linguistic assimilation of Francophones outside Quebec, over one million Canadians who claimed English as their mother tongue were of French ethnic origin (1991 Census).
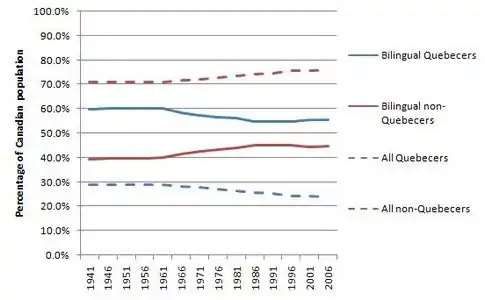
Bilingualism and multilingualism versus English–French bilingualism
 Ability of Canadians to speak English and French 1931–2001.<ref name='knowledge'>
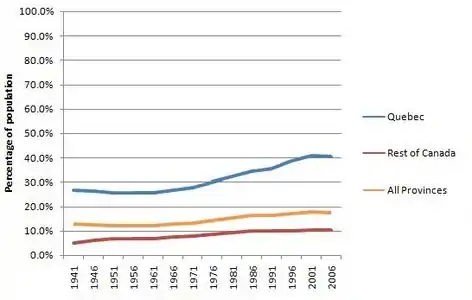 Rate of bilingualism (French and English) in Quebec and the rest of Canada, 1941–2006.<ref>
According to the 2011 census, 98.2% of Canadian residents have knowledge of one or both of the country's two official languages,[14] Between 2006 and 2011, the number of persons who reported being able to conduct a conversation in both of Canada's official languages increased by nearly 350,000 to 5.8 million. The bilingualism rate of the Canadian population edged up from 17.4% in 2006 to 17.5% in 2011.[6] This growth of English-French bilingualism in Canada was mainly due to the increased number of Quebecers who reported being able to conduct a conversation in English and French.[6]
Bilingualism with regard to nonofficial languages also increased, most individuals speaking English plus an immigrant language such as Punjabi or Mandarin.[23]
Geographic distribution of English–French bilingualism
 Geographical distribution of bilingual Canadians as compared to total Canadian population 1941–2006. (sources in table below)
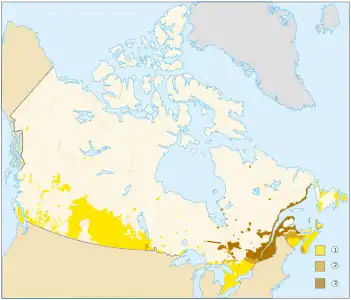 The Bilingual Belt. In most of Canada, either English or French is predominant. Only in the intermittent "belt" stretching between northern Ontario and northern New Brunswick, and in a few other isolated pockets, do the two languages mix on a regular basis.EnglishEnglish and French (Bilingual Belt)FrenchSparsely populated areas (< 0.4 persons per km2)
| Year | # Bilingual Canadians | % Quebec | % Rest of Canada | Total # Canadians | % Quebec | % Rest of Canada |
|---|---|---|---|---|---|---|
| 1941[24][25] | 1,472,858 | 59.9% | 39.5% | 11,506,700 | 29.0% | 71.0% |
| 1951[26] | 1,727,400 | 60.1% | 39.9% | 14,009,400 | 28.9% | 71.1% |
| 1961[27] | 2,231,200 | 60.0% | 40.0% | 18,238,200 | 28.8% | 71.2% |
| 1971[28] | 2,900,150 | 57.4% | 42.6% | 21,568,310 | 27.9% | 72.1% |
| 1981[29] | 3,681,955 | 56.1% | 43.9% | 24,083,495 | 26.4% | 73.6% |
| 1986[30] | 4,056,155 | 54.9% | 45.1% | 25,022,005 | 25.8% | 74.2% |
| 1991[31] | 4,398,655 | 54.9% | 45.1% | 26,994,045 | 25.2% | 74.8% |
| 1996[32] | 4,841,320 | 55.0% | 45.0% | 28,528,120 | 24.2% | 75.8% |
| 2001[33] | 5,231,575 | 55.6% | 44.0% | 29,639,030 | 24.0% | 76.0% |
| 2006[34] | 5,448,850 | 55.4% | 44.6% | 31,241,030 | 23.8% | 76.2% |
| 2016[35] | 6,251,485 | 57.9% | 42.1% | 34,767,255 | 23.2% | 76.8% |
According to the 2011 census, 94.3% of Quebecers have knowledge of French, and 47.2% have knowledge of English.[14] Bilingualism (of the two official languages) is largely limited to Quebec itself, and to a strip of territory sometimes referred to as the "bilingual belt", that stretches east from Quebec into northern New Brunswick and west into parts of Ottawa and northeastern Ontario. 85% of bilingual Canadians live within Quebec, Ontario and New Brunswick.[14] A majority of all bilingual Canadians, (57.4%) are themselves Quebecers,[14] and a high percentage of the bilingual population in the rest of Canada resides in close proximity to the Quebec border.
Similarly, the rate of bilingualism in Quebec has risen higher, and more quickly than in the rest of Canada. In Quebec, the rate of bilingualism has increased from 26% of the population being able to speak English and French in 1951 to 42.5% in 2011.[14] As of 2011, in the rest of Canada (excluding Quebec) the rate of bilingualism was 7.5%.[14]
| Province/territory | % of population | Total number | Ref. |
|---|---|---|---|
| Quebec | 44.5% | 3,586,410 | [36] |
| New Brunswick | 34% | 249,950 | [37] |
| Northwest Territories | 14% | 4,900 | [38] |
| Prince Edward Island | 13% | 17,840 | [39] |
| Ontario | 11.2% | 1,490,390 | [40] |
| Nova Scotia | 10.5% | 95,380 | [41] |
| Yukon | 10.3% | 4,275 | [42] |
| Manitoba | 9% | 108,460 | [43] |
| Alberta | 7% | 264,720 | [44] |
| British Columbia | 7% | 314,925 | [45] |
| Saskatchewan | 5% | 51,560 | [46] |
| Newfoundland and Labrador | 5% | 25,940 | [47] |
| Nunavut | 4.3% | 1,525 | [48] |
| Canada—Total | 17.9% | 6,216,065 | [36] |
English–French bilingualism rates
English–French bilingualism is highest among members of local linguistic minorities. It is very uncommon for Canadians to be capable of speaking only the minority official language of their region (French outside of Quebec or English in Quebec). Only 1.5% of Canadians are able to speak only the minority official language, and of these most (90%) live in the bilingual belt.[49]
As the table below shows, rates of bilingualism are much higher among individuals who belong to the linguistic minority group for their region of Canada, than among members of the local linguistic majority. For example, within Quebec around 37% of bilingual Canadians are Francophones, whereas Francophones only represent 4.5% of the population outside of Quebec.[50]
| Anglophones | Francophones | Allophones | |
|---|---|---|---|
| Quebec | 66.1% | 36.6% | 50.4% |
| Rest of Canada | 7.1% | 85.1% | 5.7% |
Official language minority communities
French-speaking Canadians from outside of Quebec and English-speaking Quebecers are, together, the official language minority communities. These communities are:
| Jurisdiction | Community |
|---|---|
| Anglo-Quebecers | |
| Franco-Ontarians | |
| Franco-Manitobans | |
| Fransaskois | |
| Franco-Albertans | |
| Franco-Colombians | |
| Franco-Yukonnais | |
| Franco-Ténois | |
| Franco-Nunavois | |
| Franco-Terreneuviens | |
| Acadiens | |
| Brayons |
French outside Quebec
The language continuity index represents the relationship between the number of people who speak French most often at home and the number for whom French is their mother tongue. A continuity index of less than one indicates that French has more losses than gains – that more people with French as a mother tongue speak another language at home. Outside of Quebec, New Brunswick has the highest French language continuity ratio. British Columbia and Saskatchewan have the lowest French language continuity ratio and thus the lowest retention of French. From 1971 to 2011, the overall ratio for French language continuity outside of Quebec declined from 0.73 to 0.45. Declines were the greatest for Manitoba, Saskatchewan, and Newfoundland.
| Province/Territory | 1971 | 1981 | 1991 | 1996 | 2001 | 2006 | 2011 |
|---|---|---|---|---|---|---|---|
| New Brunswick | 0.92 | 0.93 | 0.93 | 0.92 | 0.91 | 0.91 | 0.89 |
| Quebec | - | - | 1.01 | 1.01 | 1.02 | 1.03 | 1.03 |
| Nunavut | - | - | - | - | 0.54 | 0.57 | 0.58 |
| Canada | - | - | 0.96 | 0.96 | 0.96 | 0.97 | 0.97 |
| Ontario | 0.73 | 0.72 | 0.63 | 0.61 | 0.60 | 0.60 | 0.57 |
| Nova Scotia | 0.69 | 0.69 | 0.59 | 0.57 | 0.56 | 0.53 | 0.51 |
| Prince Edward Island | 0.60 | 0.64 | 0.53 | 0.53 | 0.48 | 0.49 | 0.47 |
| Manitoba | 0.65 | 0.60 | 0.49 | 0.47 | 0.46 | 0.45 | 0.42 |
| Yukon | 0.30 | 0.45 | 0.43 | 0.46 | 0.46 | 0.49 | 0.57 |
| Northwest Territories | 0.50 | 0.51 | 0.47 | 0.43 | 0.39 | 0.46 | 0.51 |
| Newfoundland and Labrador | 0.63 | 0.72 | 0.47 | 0.42 | 0.42 | 0.36 | 0.46 |
| Alberta | 0.49 | 0.49 | 0.36 | 0.32 | 0.33 | 0.33 | 0.36 |
| Saskatchewan | 0.50 | 0.41 | 0.33 | 0.29 | 0.26 | 0.26 | 0.26 |
| British Columbia | 0.30 | 0.35 | 0.28 | 0.29 | 0.29 | 0.30 | 0.29 |
Non-official languages that are unique to Canada
Indigenous languages
Canada is home to a rich variety of indigenous languages that are spoken nowhere else. There are 12 Indigenous language groups in Canada, made up of more than 65 distinct languages and dialects, including many sign languages.[54] Of these, only Cree, Inuktitut, and Ojibway have a large enough population of fluent speakers to be considered viable to survive in the long term.[55] Prior to colonization, multilingualism was common among indigenous bands, which were often temporary and nomadic. However, the reserve system has created more permanent stationary bands, which have generally selected only one of their various ancestral languages to try to preserve in the face of increasing Anglicization.[56]
Two of Canada's territories give official status to native languages. In Nunavut, Inuktitut and Inuinnaqtun, known collectively as the Inuit Language, are official languages alongside the national languages of English and French, and Inuktitut is a common vehicular language in territorial government.[57][58] In the Northwest Territories, the Official Languages Act declares that there are eleven different languages: Chipewyan, Cree, English, French, Gwich’in, Inuinnaqtun, Inuktitut, Inuvialuktun, North Slavey, South Slavey, and Tłįchǫ.[9] Besides English and French, these languages are not vehicular in government; official status entitles citizens to receive services in them on request and to deal with the government in them.[55]
According to the 2011 census, less than one percent of Canadians (213,485) reported an Indigenous language as their mother tongue, and less than one percent of Canadians (132,920) reported an Indigenous language as their home language.[59]
Given the destruction of Indigenous state structures, academics usually classify Indigenous peoples of Canada by region into "culture areas", or by their Indigenous language family.[60]
- Arctic cultural area – (Eskimo–Aleut languages)
- Subarctic culture area – (Na-Dene languages – Algic languages)
- Eastern Woodlands (Northeast) cultural area – (Algic languages and Iroquoian languages)
- Plains cultural area – (Siouan–Catawban languages)
- Northwest Plateau cultural area – (Salishan languages)
- Northwest Coast cultural area – (Haida language, Tsimshianic languages and Wakashan languages)
| Indigenous languages | No. of speakers | Mother tongue | Home language |
|---|---|---|---|
| Cree | 99,950 | 78,855 | 47,190 |
| Inuktitut | 35,690 | 32,010 | 25,290 |
| Ojibwe | 32,460 | 11,115 | 11,115 |
| Montagnais-Naskapi (Innu) | 11,815 | 10,970 | 9,720 |
| Dene Suline | 11,130 | 9,750 | 7,490 |
| Oji-Cree (Anishinini) | 12,605 | 8,480 | 8,480 |
| Mi'kmaq | 8,750 | 7,365 | 3,985 |
| Siouan languages (Dakota/Sioux) | 6,495 | 5,585 | 3,780 |
| Atikamekw | 5,645 | 5,245 | 4,745 |
| Blackfoot | 4,915 | 3,085 | 3,085 |
| Tłįchǫ or Dogrib | 2,645 | 2,015 | 1,110 |
| Algonquin | 2,685 | 1,920 | 385 |
| Carrier | 2,495 | 1,560 | 605 |
| Gitksan | 1,575 | 1,175 | 320 |
| Chilcotin | 1,400 | 1,070 | 435 |
| North Slave (Hare) | 1,235 | 650 | 650 |
| South Slave | 2,315 | 600 | 600 |
| Malecite | 790 | 535 | 140 |
| Chipewyan | 770 | 525 | 125 |
| Inuinnaqtun | 580 | 370 | 70 |
| Kutchin-Gwich’in (Loucheaux) | 570 | 355 | 25 |
| Mohawk | 615 | 290 | 20 |
| Shuswap | 1,650 | 250 | 250 |
| Nisga'a | 1,090 | 250 | 250 |
| Tlingit | 175 | 0 | 0 |
| Atgangmuurngniq | 47[61] | Unknown | Unknown |
Glottolog 4.1 (2019) counted 9 independent indigenous language families and/or isolates in Canada.[62]
Pidgins, mixed languages, & trade languages
In Canada, as elsewhere in the world of European colonization, the frontier of European exploration and settlement tended to be a linguistically diverse and fluid place, as cultures using different languages met and interacted. The need for a common means of communication between the indigenous inhabitants and new arrivals for the purposes of trade and (in some cases) intermarriage led to the development of hybrid languages. These languages tended to be highly localized, were often spoken by only a small number of individuals who were frequently capable of speaking another language, and often persisted only briefly, before being wiped out by the arrival of a large population of permanent settlers, speaking either English or French.
Michif
Michif (also known as Mitchif, Mechif, Michif-Cree, Métif, Métchif, and French Cree) is a mixed language which evolved within the Prairie Métis community. It is based on elements of Cree, Ojibwa, Assiniboine, and French. Michif is today spoken by less than 1,000 individuals in Saskatchewan, Manitoba and North Dakota. At its peak, around 1900, Michif was understood by perhaps three times this number.
Basque pidgin
Algonquian–Basque pidgin is a pidgin that developed in the 16th century from Basque in coastal areas along the Gulf of Saint Lawrence and the Strait of Belle Isle as the result of contact between Basque whalers and local Algonquian peoples.[63]
Chinook Jargon
In British Columbia, Yukon and throughout the Pacific Northwest a pidgin language known as the Chinook Jargon emerged in the early 19th century which was a combination of Chinookan, Nootka, Chehalis, French and English, with a smattering of words from other languages including Hawaiian and Spanish.[64] Certain words and expressions remain current in local use, such as skookum, tyee, and saltchuck, while a few have become part of worldwide English ("high mucketymuck" or "high muckamuck" for a high-ranking and perhaps self-important official).
Sign languages
.png.webp)
Alongside the numerous and varied oral languages, Canada also boasts several sign languages. Currently, Canada is home to some five or more sign languages (that number rising with the probability that Plains Sign Talk is actually a language family with several languages under its umbrella), belonging to four distinct language families, those being: French Sign Language language family, BANZSL family and two isolates (Inuiuuk and Plains Sign Talk).
As with all sign languages around the world that developed naturally, these are natural, human languages distinct from any oral language. As such, American Sign Language (unlike Signed English) is no more a derivation of English than Russian is,[65] all being distinct languages from one another. Some languages present here were trade pidgins which were used first as a system of communication across national and linguistic boundaries of First Nations, however, they have since developed into mature languages as children learned them as a first language.
The sign languages of Canada share extremely limited rights within the country in large due to the general population's misinformation on the subject. Ontario is the only province or territory to formally make legal any sign language, enabling the use of American Sign Language, Quebec Sign Language (LSQ) and "First Nation Sign Language" (which could refer to Plains Sign Talk or any other language) in only the domains of education, legislation and judiciary proceedings.[66] The only other language afforded any other rights is Inuiuuk which sees interpretation in the Legislative Assembly of Nunavut.[67] There have been efforts to make LSQ an official language of Quebec, but all efforts have failed.[68]
American Sign Language
The most spoken sign language in Canada, American Sign Language or ASL can be found across the country in mostly anglophone regions. The ties with Anglophone Canada are not due to ASL and English's similarity, they have to do with cultural similarities and linguistic history (as several ASL words are borrowed from English). As such, ASL can be found in areas where English is not the primary language, such as Montreal or Nunavut. ASL is part of the French Sign Language family, originating on the East Coast of the United States from a mix of Langue des signes françaises (LSF) and other local languages.
Quebec Sign Language
Alongside ASL, Quebec Sign Language or LSQ (Langue des signes québécoise) is the second most spoken sign language in the country. Centred mainly around and within Quebec, LSQ can also be found in Ontario, New Brunswick and various other parts of the country, generally around francophone communities due to historical ties to the French language. Although approximately 10% of the population of Quebec is deaf or hard-of-hearing, it is estimated that only 50,000 to 60,000 children use LSQ as their native language. LSQ is part of the Francosign family with ASL. As such, both languages are mutually intelligible.
Maritime Sign Language
Maritime Sign Language is a BANZSL language. It was used as the language of education for Deaf populations in Nova Scotia, New Brunswick, and Prince Edward Island before ASL became available in the mid-20th century. It is still remembered by some elderly people but is moribund. The language, living alongside ASL, has produced a unique dialect of ASL in The Maritimes due to mixing of the languages. The exact number of speakers is unknown.
Inuit Sign Language
Inuit Sign Language, also known as Inuiuuk (Inuktitut syllabics ᐃᓄᐃᐆᒃ), is a critically endangered language with some 50 speakers remaining. It is a language isolate and has only be found by researchers in Nunavut, however, there are theories it extends across the Arctic Circle.[61] Little is known about its history, but efforts are being made to document and revitalize the language.[69]
Hand Talk
Originally a trade pidgin, Plains Sign Talk, also known as Plains Standard or Prairie Sign Language, became a full language after children began to learn the language as a first language across many Nations. From "HANDS" and "TO TALK TO," Hand Talk was used as a lingua franca across linguistic and national boundaries[70] across the continent and the language stretched across the provinces down through Mexico.[71] As Plains Sign Talk was so widespread and was a spectrum of dialects and accents, it probably hosted several languages under its umbrella. One is potentially Navajo Sign Language which is in use by a sole Navajo clan.[72]
Plateau Sign Language
Another trade pidgin that may have become a separate language, Plateau Sign Language replaced Plains Sign Talk in the Columbia Plateau and surrounding regions of British Columbia, Washington, Oregon, and Idaho. It is now extinct.
Canadian Gaelic
Canadian Gaelic was spoken by many immigrants who settled in Glengarry County (Ontario) and the Maritimes — predominantly in New Brunswick's Restigouche River valley, central and southeastern Prince Edward Island, and across the whole of northern Nova Scotia — particularly Cape Breton. While the Canadian Gaelic dialect has mostly disappeared, regional pockets persist. These are mostly centred on families deeply committed to their Celtic traditions. Nova Scotia currently has 500–1,000 fluent speakers, mostly in northwestern Cape Breton. There have been attempts in Nova Scotia to institute Gaelic immersion on the model of French immersion. As well, formal post-secondary studies in Gaelic language and culture are available through St. Francis Xavier University, Saint Mary's University, and Cape Breton University
In 1890, a private member's bill was tabled in the Canadian Senate, calling for Gaelic to be made Canada's third official language. However, the bill was defeated 42–7.
Franglais and Chiac
A portmanteau language which is said to combine English and French syntax, grammar and lexicons to form a unique interlanguage, is sometimes ascribed to mandatory basic French education in the Canadian anglophone school systems. While many Canadians are barely conversant in French they will often borrow French words into their sentences. Simple words and phrases like "c'est quoi ça?" (what is that?) or words like "arrête" (stop) can alternate with their English counterparts. This phenomenon is more common in the eastern half of the country where there is a greater density of Francophone populations. Franglais can also refer to the supposed degradation of the French language thanks to the overwhelming impact Canadian English has on the country's Francophone inhabitants, though many linguists would argue that while English vocabulary can be freely borrowed as a stylistic device, the grammar of French has been resistant to influences from English[73] and the same conservatism holds true in Canadian English grammar,[74] even in Quebec City.
One interesting example of is Chiac, popularly a combination of Acadian French and Canadian English, but actually an unmistakable variety of French, which is native to the Maritimes (particularly New Brunswick which has a large Acadian population).
Ottawa Valley Twang
Ottawa Valley Twang is the accent, sometimes referred to as a dialect of English, that is spoken in the Ottawa Valley, in Ontario.[75] The Ottawa Valley is considered to be a linguistic enclave within Ontario.[76]
Newfoundland English
The initial European settlers to Newfoundland were fishermen from the various coastal villages of the English West Country of Cornwall, Devon, Dorset, Somerset, Bristol, and Wiltshire beginning in the 1500s (previously they visited in summer and returned). This set the basic speech patterns for those settlers who fanned out into isolated coves and bays along the island's 6,000 mi (9,700 km) of coastline to take advantage of the scattered off-shore fishing areas. Labrador, today the greater part of "Newfoundland", was then sparsely settled. The West Country dialects continued to be spoken in isolated coves and fjords of the island thus preserving varied dialects of what is today referred to as Newfoundland English.
It was not until the 1700s that social disruptions in Ireland sent thousands of Irish from the southeastern counties of Waterford, Wexford, Kilkenny, and Cork and to the Avalon peninsula in the eastern part of Newfoundland where significant Irish influence on the Newfoundland dialects may still be heard.
Some of the Irish immigrants to Newfoundland were native speakers of Irish making Newfoundland the only place outside Europe to have its own Irish dialect. Newfoundland was also the only place outside Europe to have its own distinct name in Irish: Talamh an Éisc, which means 'land of the fish'. The Irish language is now extinct in Newfoundland.
After 400 years, much of the dialectal differences between the isolated settlements has leveled out beginning in the 20th century when faster boats (using gas engines instead of oars or sails), and improved road connections provided easier social contact. As well, influences from mainland North America began to affect the local dialects beginning during WWII when US and Canadian servicemen were stationed in Newfoundland and accelerating after Newfoundland became a Canadian province in 1949. Lack of an official orthography, publications in dialect, speaker attrition and official disinterest in promoting the language has been contributing factors towards a decline of speakers of the older, traditional Newfoundland English in the original settlements.
Welsh language
Some Welsh is found in Newfoundland. In part, this is as a result of Welsh settlement since the 17th century. Also, there was an influx of about 1,000 Patagonian Welsh migrated to Canada from Argentina after the 1982 Falklands War. Welsh-Argentines are fluent in Spanish as well as English and Welsh.
Acadian French
Acadian French is a unique form of Canadian French which incorporates not only distinctly Canadian phrases but also nautical terms, English loanwords, linguistic features found only in older forms of French as well as ones found in the Maritimer English dialect.
Canadian Ukrainian
Canada is also home to Canadian Ukrainian, a distinct dialect of the Ukrainian language, spoken mostly in Western Canada by the descendants of first two waves of Ukrainian settlement in Canada who developed in a degree of isolation from their cousins in what was then Austria-Hungary, the Russian Empire, Poland, and the Soviet Union.
Doukhobor Russian
Canada's Doukhobor community, especially in Grand Forks and Castlegar, British Columbia, has kept its distinct dialect of Russian. It has a lot in common with South Russian dialects, showing some common features with Ukrainian. This dialect's versions are becoming extinct in their home regions of Georgia and Russia where the Doukhobors have split into smaller groups.
Bungee
The meagerly documented Bungi Creole (also known as Bungy, Bungie, Bungay, and as the Red River Dialect) is a dialect of English which evolved within the Prairie Métis community. It is influenced by Cree and Scots Gaelic. Bungee was spoken in the Red River area of Manitoba. In 1989, at the time of the only academic study ever undertaken on the language, only six speakers of Bungee were known to still be alive.
Official bilingualism
Language policy of the federal government

English and French have equal status in federal courts, Parliament of Canada, and in all federal institutions.
The public has the right, where there is sufficient demand, to receive federal government services in either English or French. Immigrants who are applying for Canadian citizenship must normally be able to speak either English or French.
The principles of bilingualism in Canada are protected in sections 16 to 23 of the Canadian Charter of Rights and Freedoms of 1982 which establishes that:
- French and English are equal to each other as federal official languages;
- Debate in Parliament may take place in either official language;
- Federal laws shall be printed in both official languages, with equal authority;
- Anyone may deal with any court established by Parliament, in either official language;
- Everyone has the right to receive services from the federal government in his or her choice of official language;
- Members of a minority language group of one of the official languages if learned and still understood (i.e., French speakers in a majority English-speaking province, or vice versa) or received primary school education in that language has the right to have their children receive a public education in their language, where numbers warrant.
Canada's Official Languages Act, first adopted in 1969 and updated in 1988, gives English and French equal status throughout federal institutions.
Language policies of Canada's provinces and territories
Officially bilingual or multilingual: New Brunswick and the three territories
New Brunswick and Canada's three territories have all given official status to more than one language. In the case of New Brunswick, this means perfect equality. In the other cases, the recognition sometimes amounts to a formal recognition of official languages, but limited services in official languages other than English.
The official languages are:
- New Brunswick: English and French. New Brunswick has been officially bilingual since the 1960s. The province's officially bilingual status has been entrenched in the Canadian Charter of Rights and Freedoms since the 1980s.
- Northwest Territories: Chipewyan, Cree, English, French, Gwich’in, Inuinnaqtun, Inuktitut, Inuvialuktun, North Slavey, Slavey language and Tłįchǫ or Dogrib.[9]
- Nunavut: English, Inuit Language (Inuktitut, Inuinnaqtun) and French.[10]
- Yukon: English and French.
Officially French-only: Quebec
Until 1969, Quebec was the only officially bilingual province in Canada and most public institutions functioned in both languages. English was also used in the legislature, government commissions and courts. With the adoption of the Charter of the French Language (also known as "Bill 101") by Quebec's National Assembly in August 1977, however, French became Quebec's sole official language. However, the Charter of the French Language enumerates a defined set of language rights for the English language and for Aboriginal languages, and government services are available, to certain citizens and in certain regions, in English. As well, a series of court decisions have forced the Quebec government to increase its English-language services beyond those provided for under the original terms of the Charter of the French Language. Regional institutions in the Nunavik region of northern Quebec offer services in Inuktitut and Cree.
De facto English only, or limited French-language services: the other eight provinces
Most provinces have laws that make either English or both English and French the official language(s) of the legislature and the courts but may also have separate policies in regards to education and the bureaucracy.
For example, in Alberta, English and French are both official languages of debate in the Legislative Assembly, but laws may be drafted solely in English and there is no legal requirement that they be translated into French. French can be used in some lower courts and education is offered in both languages, but the bureaucracy functions almost solely in English. Therefore, although Alberta is not officially an English-only province, English has a higher de facto status than French. Ontario and Manitoba are similar but allow for more services in French at the local level.
Speakers by mother tongue
| First language | Population (2016) | % of total population (2016) | Population (2011) | % of total population (2011) | Population (2006) | % of total population (2006) | Notes |
|---|---|---|---|---|---|---|---|
| Single language responses | 33,947,610 | 97.64% | 32,481,635 | 98.07% | 30,848,270 | 98.74% | |
| Official languages | 26,627,545 | 76.59% | 25,913,955 | 78.24% | 24,700,425 | 79.06% | |
| English | 19,460,855 | 55.97% | 18,858,980 | 56.94% | 17,882,775 | 57.24% | |
| French | 7,166,700 | 20.61% | 7,054,975 | 21.3% | 6,817,650 | 21.82% | |
| Non-official languages | 7,321,070 | 21.06% | 6,567,680 | 19.83% | 6,147,840 | 19.68% | |
| Combined Chinese Responses | 1,227,680 | 3.53% | n/a | n/a | n/a | n/a | Combined responses of Mandarin, Cantonese, Chinese n.o.s. and Min Nan |
| Mandarin (Standard Chinese) | 592,035 | 1.7% | 248,705 | 0.75% | 170,950 | 0.55% | |
| Cantonese | 565,275 | 1.63% | 372,460 | 1.12% | 361,450 | 1.16% | |
| Punjabi | 501,680 | 1.44% | 430,705 | 1.3% | 367,505 | 1.18% | |
| Spanish | 458,850 | 1.32% | 410,670 | 1.24% | 345,345 | 1.11% | |
| Tagalog (Filipino) | 431,385 | 1.24% | 327,445 | 0.99% | 235,615 | 0.75% | |
| Arabic | 419,895 | 1.21% | 327,870 | 0.99% | 261,640 | 0.84% | |
| German | 384,040 | 1.1% | 409,200 | 1.24% | 450,570 | 1.44% | |
| Italian | 375,645 | 1.08% | 407,485 | 1.23% | 455,040 | 1.46% | |
| Hindustani | 321,465 | 0.92% | 263,345 | 0.8% | 224,045 | 0.72% | Combined responses of Hindi and Urdu |
| Portuguese | 221,535 | 0.64% | 211,335 | 0.64% | 219,275 | 0.7% | |
| Persian (Farsi) | 214,200 | 0.62% | 170,045 | 0.51% | 134,080 | 0.43% | |
| Urdu | 210,820 | 0.61% | 172,800 | 0.52% | 145,805 | 0.47% | |
| Indian Tamil | 189,405 | 0.54% | n/a | n/a | n/a | n/a | Combined responses of Tamil, Malayalam, Telugu and Kannada. |
| Russian | 188,255 | 0.54% | 164,330 | 0.5% | 133,580 | 0.43% | |
| Polish | 181,705 | 0.52% | 191,645 | 0.58% | 211,175 | 0.68% | |
| Vietnamese | 156,430 | 0.45% | 144,880 | 0.44% | 141,625 | 0.45% | |
| Korean | 153,425 | 0.44% | 137,925 | 0.42% | 125,570 | 0.4% | |
| Tamil | 140,720 | 0.4% | 131,265 | 0.4% | 115,880 | 0.37% | Most of the Canadian Tamils live in Toronto. |
| Hindi | 110,645 | 0.32% | 90,545 | 0.27% | 78,240 | 0.25% | |
| Gujarati | 108,775 | 0.31% | 91,450 | 0.28% | 81,465 | 0.26% | |
| Greek | 106,520 | 0.31% | 108,925 | 0.33% | 117,285 | 0.38% | |
| Ukrainian | 102,485 | 0.29% | 111,540 | 0.34% | 134,500 | 0.43% | |
| Dutch | 99,015 | 0.28% | 110,490 | 0.33% | 128,900 | 0.41% | |
| Romanian | 96,660 | 0.28% | 90,300 | 0.27% | 78,495 | 0.25% | |
| Bengali | 73,125 | 0.21% | 59,370 | 0.18% | 45,685 | 0.15% | |
| Creoles | 72,130 | 0.21% | 61,725 | 0.19% | 53,515 | 0.17% | |
| Cree, n.o.s.[nb 5] | 64,045 | 0.18% | 77,900 | 0.24% | 78,855 | 0.25% | In the 2006 Census, this language was referred to simply as 'Cree'. |
| Hungarian | 61,235 | 0.18% | 67,920 | 0.21% | 73,335 | 0.23% | The majority of Hungarian speakers in Canada live in Ontario. A community of Hungarian speakers is found within a part of Windsor, Ontario. |
| Berber languages (Kabyle) | n/a | n/a | 57,855 | 0.17% | 25,578 | 0.08% | |
| Serbian | 57,345 | 0.16% | 56,420 | 0.17% | 51,665 | 0.17% | |
| Croatian | 48,200 | 0.14% | 49,730 | 0.15% | 55,330 | 0.18% | |
| Japanese | 43,640 | 0.13% | 39,985 | 0.12% | 40,200 | 0.13% | |
| Chinese, n.o.s.[nb 5] | 38,575 | 0.11% | 425,210 | 1.28% | 456,705 | 1.46% | |
| Somali | 36,760 | 0.11% | 31,380 | 0.09% | 27,320 | 0.09% | |
| Inuktitut | 35,215 | 0.1% | 33,500 | 0.1% | 32,015 | 0.1% | In the 2006 Census, this language was referred to as 'Inuktitut, n.i.e.'.[nb 6] |
| Armenian | 33,455 | 0.1% | 29,795 | 0.09% | 30,130 | 0.1% | |
| Turkish | 32,815 | 0.09% | 29,640 | 0.09% | 24,745 | 0.08% | |
| Min Nan (Chaochow, Teochow, Fukien, Taiwanese) | 31,795 | 0.09% | n/a | n/a | n/a | n/a | |
| Malayalam | 28,570 | 0.08% | 16,080 | 0.05% | 11,925 | 0.04% | |
| Albanian | 26,895 | 0.08% | 23,820 | 0.07% | n/a | n/a | |
| Ilocano | 26,345 | 0.08% | 17,915 | 0.05% | 13,450 | 0.04% | |
| Amharic | 22,465 | 0.06% | 18,020 | 0.05% | 14,555 | 0.05% | |
| Czech | 22,295 | 0.06% | 23,585 | 0.07% | 24,450 | 0.08% | |
| Khmer (Cambodian) | 20,130 | 0.06% | 19,440 | 0.06% | 19,105 | 0.06% | |
| Bulgarian | 20,020 | 0.06% | 19,050 | 0.06% | 16,790 | 0.05% | |
| Hebrew | 19,530 | 0.06% | 18,450 | 0.06% | 17,635 | 0.06% | |
| Niger–Congo languages, n.i.e.[nb 6] | 19,140 | 0.06% | 14,075 | 0.04% | n/a | n/a | |
| Nepali | 18,275 | 0.05% | 8,480 | 0.03% | n/a | n/a | |
| Ojibway | 17,885 | 0.05% | 17,625 | 0.05% | 24,190 | 0.08% | |
| Slovak | 17,585 | 0.05% | 17,580 | 0.05% | 18,820 | 0.06% | |
| Pashto | 16,910 | 0.05% | 12,465 | 0.04% | 9,025 | 0.03% | |
| Macedonian | 16,770 | 0.05% | 17,245 | 0.05% | 18,435 | 0.06% | |
| Tigrigna | 16,650 | 0.05% | 10,220 | 0.03% | 7,105 | 0.02% | |
| Sinhala | 16,335 | 0.05% | 14,185 | 0.04% | 10,180 | 0.03% | |
| Bisayan languages | n/a | n/a | 16,240 | 0.05% | 11,240 | 0.04% | |
| Telugu | 15,655 | 0.05% | 9,315 | 0.03% | 6,625 | 0.02% | |
| Finnish | 15,295 | 0.04% | 17,415 | 0.05% | 21,030 | 0.07% | |
| Yiddish | 13,555 | 0.04% | 15,205 | 0.05% | 16,295 | 0.05% | |
| Akan (Twi) | 13,460 | 0.04% | 12,680 | 0.04% | 12,780 | 0.04% | |
| Swahili | 13,375 | 0.04% | 10,090 | 0.03% | 7,935 | 0.03% | |
| Wu (Shanghainese) | 12,920 | 0.04% | n/a | n/a | n/a | n/a | |
| Oji-Cree | 12,855 | 0.04% | 9,835 | 0.03% | 11,690 | 0.04% | |
| Lao | 12,670 | 0.04% | 12,970 | 0.04% | 13,940 | 0.04% | |
| Danish | 12,630 | 0.04% | 14,145 | 0.04% | 18,735 | 0.06% | |
| Malay | 12,275 | 0.04% | 10,910 | 0.03% | 9,490 | 0.03% | |
| Bosnian | 12,210 | 0.04% | 11,685 | 0.04% | 12,790 | 0.04% | |
| Sindhi | 11,860 | 0.03% | 11,330 | 0.03% | 10,355 | 0.03% | |
| Kurdish | 11,705 | 0.03% | 9,805 | 0.03% | 7,660 | 0.02% | |
| Hakka | 10,910 | 0.03% | 5,115 | 0.02% | n/a | n/a | |
| Dene | 10,700 | 0.03% | 11,215 | 0.03% | 9,745 | 0.03% | |
| Afrikaans | 10,260 | 0.03% | 8,770 | 0.03% | n/a | n/a | |
| Montagnais (Innu) | 10,230 | 0.03% | 10,785 | 0.03% | 10,975 | 0.04% | In the 2006 Census, this language was referred to as 'Montagnais-Naskapi'. |
| Slovenian | 9,785 | 0.03% | 10,775 | 0.03% | 13,135 | 0.04% | |
| Taiwanese | n/a | n/a | 9,635 | 0.03% | 9,620 | 0.03% | |
| Serbo-Croatian | 9,555 | 0.03% | 10,155 | 0.03% | 12,510 | 0.04% | |
| African languages, n.i.e.[nb 6] | n/a | n/a | 9,125 | 0.03% | n/a | n/a | |
| Thai | 9,255 | 0.03% | 7,935 | 0.02% | n/a | n/a | |
| Marathi | 8,295 | 0.02% | 5,830 | 0.02% | n/a | n/a | |
| Bantu languages, n.i.e.[nb 6] | n/a | n/a | 7,150 | 0.02% | n/a | n/a | |
| Lithuanian | 7,075 | 0.02% | 7,245 | 0.02% | 8,335 | 0.03% | |
| Swedish | 6,840 | 0.02% | 7,350 | 0.02% | 8,220 | 0.03% | |
| Mi'kmaq | 6,690 | 0.02% | 7,635 | 0.02% | 7,365 | 0.02% | |
| Tibetan | 6,165 | 0.02% | n/a | n/a | n/a | n/a | |
| Atikamekw | 6,150 | 0.02% | 5,820 | 0.02% | 5,250 | 0.02% | |
| Canadian Gaelic | n/a | n/a | 6,015 | 0.02% | 6,015 | 0.02% | |
| Fukien (Fuzhou dialect) | n/a | n/a | 5,925 | 0.02% | n/a | n/a | |
| Rundi (Kirundi) | 5,845 | 0.02% | 3,975 | 0.01% | n/a | n/a | |
| Maltese | 5,565 | 0.02% | 6,220 | 0.02% | 6,405 | 0.02% | |
| Estonian | 5,445 | 0.02% | 6,385 | 0.02% | 8,240 | 0.03% | |
| Latvian | 5,455 | 0.02% | 6,200 | 0.02% | 7,000 | 0.02% | |
| Kinyarwanda (Rwanda) | 5,250 | 0.02% | 3,895 | 0.01% | n/a | n/a | |
| Indo-Iranian languages, n.i.e.[nb 6] | 5,180 | 0.01% | 5,255 | 0.02% | n/a | n/a | |
| Oromo | 4,960 | 0.01% | 11,140 | 0.03% | n/a | n/a | |
| Norwegian | 4,615 | 0.01% | 5,800 | 0.02% | 7,225 | 0.02% | |
| Tibetan languages | n/a | n/a | 4,640 | 0.01% | n/a | n/a | |
| Sino-Tibetan languages, n.i.e.[nb 6] | n/a | n/a | 4,360 | 0.01% | n/a | n/a | |
| Sign languages, n.i.e.[nb 6] | 4,125 | 0.01% | 3,815 | 0.01% | n/a | n/a | |
| Vlaams (Flemish) | 3,895 | 0.01% | 4,690 | 0.01% | 5,660 | 0.02% | |
| Lingala | 3,810 | 0.01% | 3,085 | 0.01% | n/a | n/a | |
| Burmese | 3,585 | 0.01% | 2,985 | 0.01% | n/a | n/a | |
| Stoney | 3,025 | 0.01% | 3,050 | 0.01% | n/a | n/a | |
| Shanghainese | n/a | n/a | 2,920 | 0.01% | n/a | n/a | |
| Blackfoot | 2,815 | <0.01% | n/a | n/a | 3,085 | 0.01% | |
| Slavic languages, n.i.e.[nb 6] | 2,420 | 0.01% | 3,630 | 0.01% | n/a | n/a | |
| Semitic languages, n.i.e.[nb 6] | 2,155 | 0.01% | 16,970 | 0.05% | n/a | n/a | |
| Frisian | 2,095 | <0.01% | n/a | n/a | 2,890 | 0.01% | |
| Dogrib (Tlicho) | 1,645 | <0.01% | n/a | n/a | 2,020 | 0.01% | |
| Tibeto-Burman languages, n.i.e.[nb 6] | 1,405 | <0.01% | n/a | n/a | n/a | n/a | |
| Siouan languages (Dakota/Sioux) | 1,265 | <0.01% | n/a | n/a | 5,585 | 0.02% | |
| Algonquin | 1,260 | <0.01% | n/a | n/a | 1,920 | 0.01% | |
| Scottish Gaelic | 1,095 | <0.01% | n/a | n/a | n/a | n/a | |
| Welsh | 1,075 | <0.01% | n/a | n/a | n/a | n/a | |
| Carrier | 1,030 | <0.01% | n/a | n/a | 1,560 | <0.01% | |
| Inuinnaqtun (Inuvialuktun) | 1,020 | <0.01% | n/a | n/a | 365 | <0.01% | |
| Mohawk | 985 | <0.01% | n/a | n/a | 290 | <0.01% | |
| South Slavey | 950 | <0.01% | n/a | n/a | 1,605 | 0.01% | |
| Gitxsan (Gitksan) | 880 | <0.01% | n/a | n/a | 1,180 | <0.01% | |
| North Slave (Hare) | 765 | <0.01% | n/a | n/a | 1,065 | <0.01% | |
| Chilcotin | 655 | <0.01% | n/a | n/a | 1,070 | <0.01% | |
| Celtic languages, n.i.e.[nb 6] | 530 | <0.01% | n/a | n/a | n/a | n/a | |
| Chipewyan | n/a | n/a | n/a | n/a | 525 | <0.01% | |
| Michif | 465 | <0.01% | n/a | n/a | n/a | n/a | |
| Shuswap (Secwepemctsin) | 445 | <0.01% | n/a | n/a | 935 | <0.01% | |
| Nisga'a | 400 | <0.01% | n/a | n/a | 680 | <0.01% | |
| Malecite | 300 | <0.01% | n/a | n/a | 535 | <0.01% | |
| Kutchin-Gwich’in (Loucheux) | 260 | <0.01% | n/a | n/a | 360 | <0.01% | |
| Tlingit | 95 | <0.01% | n/a | n/a | 80 | <0.01% | |
| Other languages | n/a | n/a | 77,890 | 0.2% | 172,650 | 0.55% | |
| Multiple language responses | 818,640 | 2.35% | 639,540 | 1.9% | 392,760 | 1.26% | |
| English and French | 165,335 | 0.48% | 144,685 | 0.4% | 98,630 | 0.32% | |
| English and a non-official language | 533,260 | 1.53% | 396,330 | 1.2% | 240,005 | 0.77% | |
| French and a non-official language | 86,145 | 0.25% | 74,430 | 0.2% | 43,335 | 0.14% | |
| English, French, and a non-official language | 33,900 | 0.1% | 24,095 | 0.07% | 10,790 | 0.03% | |
| Total[77][78][79] | 34,767,250 | 100% | 33,121,175 | 100% | 31,241,030 | 100% |
See also
Notes
- Nearly 148,000 people reported speaking both a language other than English or French most often and a second language other than English or French on a regular basis at home. The term "immigrant languages" refers to languages (other than English, French and Aboriginal languages) whose presence in Canada is originally due to immigration. The document entitled Aboriginal languages in Canada, Catalogue no. 98‑314‑X2011003, in the Census in Brief series, provides more detailed information on this subject.[6]
- 200,725 Canadians report an Aboriginal language as their mother tongue.[7]
- 18,858,908 Canadians identify their mother tongue as English. 599,230 Québécois identify their mother tongue as English and of that 309,885 live in Montreal.[17]
- Of the 33,121,175 Canadians only 9,960,590 report to having knowledge of the French language.[14]
- n.o.s. – not otherwise specified
- n.i.e. – not included elsewhere
References
- The percentage figures cited in this chart are the top languages spoken as a home language in Canada, shown as a percentage of total single responses. Source: Statistics Canada, 2006 Census Profile of Federal Electoral Districts (2003 Representation Order): Language, Mobility and Migration and Immigration and Citizenship. Ottawa, 2007, pp. 6–10. Data available online at: "Detailed Language Spoken Most Often at Home". 2006 Census of Canada: Topic-based tabulations. Statistics Canada. April 8, 2008. Retrieved January 15, 2010.
- Government of Canada, Statistics Canada (2017-08-02). "Language Highlight Tables, 2016 Census - Mother tongue by age (Total), % distribution (2016) for the population excluding institutional residents of Canada, provinces and territories, 2016 Census – 100% Data". www12.statcan.gc.ca. Retrieved 2019-12-18.
- Government of Canada, Statistics Canada (2017-08-02). "Language Highlight Tables, 2016 Census - Knowledge of official languages by age (Total), % distribution (2016) for the population excluding institutional residents of Canada, provinces and territories, 2016 Census – 100% Data". www12.statcan.gc.ca. Retrieved 2019-12-18.
- Office Québécois de la langue française. "Status of the French language". Government of Quebec. Retrieved November 10, 2010.
- Official Languages Commissioner Graham Fraser is quoted in The Hill Times, August 31, 2009, p. 14.
- "Linguistic Characteristics of Canadians". Retrieved May 18, 2020.
- "2011 Census of Canada: Topic-based tabulations – Mother Tongue - Detailed Aboriginal Languages (85), Languages Spoken Most Often at Home - Detailed Aboriginal Languages (85), Other Languages Spoken Regularly at Home - Aboriginal Languages (12), Age Groups (13A), Sex (3) and Area of Residence (6) for the Population Excluding Institutional Residents of Canada, Provinces and Territories, 2011 Census". Retrieved May 18, 2020.
- https://www.ontario.ca/page/about-ontario
- "Official Languages". Northwest Territories Education, Culture and Employment. Government of the Northwest Territories. Retrieved 19 July 2014.
- Consolidation of (S.Nu. 2008, c.10) (NIF) Official Languages Act and Consolidation of Inuit Language Protection Act
- "Population by language spoken most often and regularly at home, age groups (total), for Canada, provinces and territories". Retrieved May 18, 2020.
- Given the large discrepancies in the data for both official languages and neither language in 1971 and 1981, it is reasonable to assume that the manner in which the data collected for these years was different from for 1986–2006
- 1981: Statistics Canada, 1981, Population by Selected Mother Tongues and Sex, Showing Official Language and Home Language, for Canada and Provinces, Urban and Rural, (table 2), 1981 Census.
1986: Statistics Canada, 1986, Population by Selected Mother Tongues and Sex, Showing Official Language and Home Language, for Canada and Provinces, Urban and Rural, (table 2), 1986 Census.
1991: Statistics Canada, 1991, 2B Profile, 1991 – Provinces and Territories in Canada (table), 1991 (2b) detailed questionnaire, Provinces to Municipalities (database), using E-Stat (distributor), (accessed 10.05.26).
1996: Statistics Canada, Mother Tongue, Home Languages, Official and Non-official languages, 1996 – Provinces and Territories in Canada (table), 1996 Census of Population (Provinces, Census Divisions, Municipalities) (database), Using E-Stat (distributor), (accessed 10.05.26).
2001: Statistics Canada, Languages, Mobility and Migration, 2001 – Provinces and Territories in Canada (table), 2001 Census of Population (Provinces, Census Divisions, Municipalities) (Database), Using E-STAT (Distributor). (accessed 10.05.26).
2006: Statistics Canada, Cumulative Profile, 2006 – Provinces and Territories in Canada (table), 2006 Census of Population (Provinces, Census Divisions, Municipalities) (database), Using E-STAT (distributor), . Retrieved 10.05.26. - "Population by knowledge of official languages, age groups (total), 2011 counts, for Canada, provinces and territories". Retrieved May 18, 2020.
- "La dynamique des langues en quelques chiffres : Tableaux". Archived from the original on 2016-12-07. Retrieved 2014-03-17.
- Marmen, Louise and Corbeil, Jean-Pierre, "New Canadian Perspectives, Languages in Canada 2001 Census," Library and Archives Canada Cataloguing in Publication, Statistics Canada Cat. No. Ch3-2/8-2004, (Canadian Heritage, 2004), pg. 60.
- 1931–1991: Statistics Canada, The 1997 Canada Year Book, "3.14 Official Language Knowledge," Catalogue No. 11-402XPE/1997.
1996: Statistics Canada. Population by Knowledge of Official Languages (20% sample data), (table), 1996 Census of Population (Provinces, Census Divisions, Municipalities) (database), Using E-STAT (distributor). (accessed: June 28, 2010).
2001: Statistics Canada. Languages, Mobility and Migration, 2001 – Provinces and Territories in Canada (table), 2001 Census of Population (Provinces, Census Divisions, Municipalities) (database), Using E-STAT (distributor). (accessed: June 28, 2010)
2006: Statistics Canada. Languages, Mobility and Migration, 2006 – Provinces and Territories in Canada (table), 2006 Census of Population (Provinces, Census Divisions, Municipalities) (database), Using E-STAT (distributor). (accessed: June 28, 2010). - "French and the francophonie in Canada". Retrieved May 18, 2020.
- "Census Program". Retrieved May 18, 2020.
- Statistics Canada, The Evolving Linguistic Portrait, 2006 Census, Catalogue no. 97-555-XIE, Ottawa, December 2007, pp. 15–16.
- Statistics Canada, Place of birth for the immigrant population by period of immigration, 2006 counts and percentage distribution, for Canada, provinces and territories – 20% sample data, 2006 Census of Population . Archived May 24, 2012, at the Wayback Machine
- Bilingualism growing, but not in French and English
- Dominion Bureau of Statistics, "Table II. Percentage Distribution of the Population Classified According to Sex, by Official Language, For Canada and the Provinces, 1941," Eighth Census of Canada, 1941.
- Series A2:Population of Canada, by province, census dates, 1851 to 1976 (retrieved, July 19, 2010).
- Dominion Bureau of Statistics, "Table 54. Population by a) official language and sex, and b) mother tongue and sex, for provinces and territories, 1951," Ninth Census of Canada.
- Statistics Canada, "Table 64. Population by a) official language and sex, and b) mother tongue and sex, for provinces and territories, 1961," 1961 Census of Canada, Catalogue:92-549, Vol: I – Part: 2.
- Statistics Canada, "Table 26. Population by A) Official Language, B) Language Most Often Spoken at Home, and Sex, For Canada and Provinces, 1971," 1971 Census of Canada, Catalogue 92-726 Vol: 1-Part:3.
- Statistics Canada, "Table 3. Population by Selected Mother Tongues, age groups and sex, Showing Official Language and Home Language for Canada and Provinces, Urban and Rural, 1981," 1981 Census of Canada, Catalogue 92–910 (Volume 1).
- Statistics Canada, "Table 7. Population by Official Languages and Sex, for Canada, Provinces and Territories, 1986 Census – 20% Sample Data," 1986 Census, Catalogue 93–103.
- Statistics Canada, "Table 1A. Population by Knowledge of Official Languages and Sex, for Canada, Provinces and Territories, 1991 – 20% Sample Data," 1991 Census, Catalogue 93–318.
- Statistics Canada, "Table 1. Selected Characteristics for Census Subdivisions, 1996 Census – 100% Data and 20% Sample Data," 1996 Census, Catalogue 95-186-XPB.
- Statistics Canada, Languages, Mobility and Migration, 2001 – Provinces and Territories in Canada (table), 2001 Census of Population (Provinces, Census Divisions, Municipalities) (Database), Using E-STAT (Distributor). (accessed 10.05.26).
- Statistics Canada, Cumulative Profile, 2006 – Provinces and Territories in Canada (table), 2006 Census of Population (Provinces, Census Divisions, Municipalities) (database), Using E-STAT (distributor), , retrieved 10.05.26.
- "Knowledge of official languages by age (Total), 2016 counts for the population excluding institutional residents of Canada, provinces and territories, 2016 Census – 100% Data". Statistics Canada. August 2, 2017.
- "Fast figures on Canada's official languages (2016)". www.clo-ocol.gc.ca. Office of the Commissioner of Official Languages. 4 July 2019. Retrieved 12 August 2020.
- "Infographic: The French presence in New Brunswick". www.clo-ocol.gc.ca. Office of the Commissioner of Official Languages. 13 September 2018. Retrieved 12 August 2020.
- "Infographic: The French presence in Northwest Territories". www.clo-ocol.gc.ca. Office of the Commissioner of Official Languages. 13 September 2018. Retrieved 12 August 2020.
- "Infographic: The French presence in Prince Edward Island". www.clo-ocol.gc.ca. Office of the Commissioner of Official Languages. 13 September 2018. Retrieved 12 August 2020.
- "Infographic: The French presence in Ontario". www.clo-ocol.gc.ca. Office of the Commissioner of Official Languages. 13 September 2018. Retrieved 12 August 2020.
- "Infographic: The French presence in Nova Scotia". www.clo-ocol.gc.ca. Office of the Commissioner of Official Languages. 13 September 2018. Retrieved 12 August 2020.
- "Infographic: The French presence in Yukon". www.clo-ocol.gc.ca. Office of the Commissioner of Official Languages. 13 September 2018. Retrieved 12 August 2020.
- "Infographic: The French presence in Manitoba". www.clo-ocol.gc.ca. Office of the Commissioner of Official Languages. 13 September 2018. Retrieved 12 August 2020.
- "Infographic: The French presence in Alberta". www.clo-ocol.gc.ca. Office of the Commissioner of Official Languages. 13 September 2018. Retrieved 12 August 2020.
- "Infographic: The French presence in British Columbia". www.clo-ocol.gc.ca. Office of the Commissioner of Official Languages. 13 September 2018. Retrieved 12 August 2020.
- "Infographic: The French presence in Saskatchewan". www.clo-ocol.gc.ca. Office of the Commissioner of Official Languages. 13 September 2018. Retrieved 12 August 2020.
- "Infographic: The French presence in Newfoundland and Labrador". www.clo-ocol.gc.ca. Office of the Commissioner of Official Languages. 13 September 2018. Retrieved 12 August 2020.
- "Infographic: The French presence in Nunavut". www.clo-ocol.gc.ca. Office of the Commissioner of Official Languages. 13 September 2018. Retrieved 12 August 2020.
- Statistics Canada. "Cumulative Profile, 2006 – Canada (308 electoral districts)" (table), 2006 Census of Population (Federal Electoral Districts, 2003 Representation Order) (database), using E-STAT (distributor). (accessed: June 28, 2010).
- O'Keefe, Michael, "Francophone Minorities: Assimilation and Community Vitality, second edition", New Canadian Percpectives, Canadian Heritage, (Cat. no. CH3-2/2001), 2001.
- Bilingualism Rate in Canada, Site for Language Management in Canada Archived February 13, 2009, at the Wayback Machine (SLMC).
- (PDF). Oct 3, 2003 https://web.archive.org/web/20031003191239/http://www.stat.gouv.qc.ca/donstat/econm_finnc/conjn_econm/TSC/pdf/CHAP3.PDF. Archived from the original (PDF) on 2003-10-03. Retrieved May 18, 2020. Missing or empty
|title=(help) - O'Keefe, Michael, "Francophone Minorities: Assimilation and Community Vitality, second edition", New Canadian Perspectives, Canadian Heritage, (Cat. no. CH3-2/2001), 2001, pg. 55.
- "Aboriginal languages". Statistics Canada. Retrieved 2009-10-05.
- Gordon, Raymond G Jr. (2005). Ethnologue: Languages of the world (Web Version online by SIL International, formerly known as the Summer Institute of Linguistics) (15 ed.). Dallas, TX: SIL International. ISBN 1-55671-159-X. Retrieved 2009-11-16. Since 2015 demands have been made to recognize all Aboriginal languages as official languages in Canada.
- McLead, Neal. (2000). "Plains Cree Identity: Borderlands, Ambiguous Genealogies and Narrative Irony" (PDF). The Canadian Journal of Native Studies. Dallas, TX: SIL International. XX (2). Archived from the original (PDF) on 2014-10-14. Retrieved 2013-04-18.
- "What are the Official Languages of Nunavut". Office of the Languages Commissioner of Nunavut. Archived from the original on 2017-08-08. Retrieved 2017-08-14.
- "Official Languages Act, SNu 2008, c 10". Retrieved May 18, 2020.
- "Population by Aboriginal mother tongue, Aboriginal language spoken most often at home and Aboriginal language spoken on a regular basis at home, for Canada, provinces and territories". Retrieved May 18, 2020.
- Handbook of the North American Indians. National Museum of Natural History. Smithsonian Institution. 2008. p. 1. ISBN 978-0-16-004574-5. Retrieved 2010-08-11.
- Schuit, Joke; Baker, Anne; Pfau, Roland. "Inuit Sign Language: a contribution to sign language typology". Universiteit van Amsterdam. Archived from the original on 2 November 2015. Retrieved 1 August 2015.
- Hammarström, Harald; Forkel, Robert; Haspelmath, Martin, eds. (2019). "Glottolog". 4.1. Jena: Max Planck Institute for the Science of Human History.
- Bakker, Peter (1989). "'The Language of the Coast Tribes is Half Basque': A Basque-American Indian Pidgin in Use between Europeans and Native Americans in North America, ca. 1540-ca. 1640". Anthropological Linguistics. 31 (3/4): 117–147. JSTOR 30027995.
- Mike Cleven. "Chinook Jargon website". Cayoosh.net. Archived from the original on 2011-05-14. Retrieved 2011-01-18.
- Lewis, M. Paul (2013). Simons, Gary F.; Fennig, Charles D. (eds.). "American Sign Language". Ethnologue: Languages of the World, Seventeenth edition. SIL International.
- Province of Ontario (2007). "Bill 213: An Act to recognize sign language as an official language in Ontario".
- "Inuit sign language makes debut in Nunavut legislature". CBC. 17 September 2008. Retrieved 1 August 2015.
- Assemblée Nationale du Québec (2013). "Projet de loi n°14 : Loi modifiant la Charte de la langue française, la Charte des droits et libertés de la personne et d'autres dispositions législatives".
- "Signs of changing times: Deaf Nunavummiut working to improve quality of life". Northern News Services Online. 27 February 2013. Archived from the original on 2016-01-07. Retrieved 23 August 2015.
- Davis, Jeffrey. 2006. "A historical linguistic account of sign language among North American Indian groups." In Multilingualism and Sign Languages: From the Great Plains to Australia; Sociolinguistics of the Deaf community, C. Lucas (ed.), Vol. 12, pp. 3–35. Washington, DC: Gallaudet University Press
- Hand Talk: American Indian Sign Language Archived 2014-08-06 at the Wayback Machine.
- Samuel J. Supalla (1992) The Book of Name Signs, p. 22
- Poplack, Shana (1988) Conséquences linguistiques du contact de langues: un modèle d’analyse variationniste. Langage et société 43: 23–48.
- Poplack, Shana, Walker, James & Malcolmson, Rebecca. 2006. An English "like no other"?: Language contact and change in Quebec. Canadian Journal of Linguistics. 185–213.
- Ottawa Valley facts Archived September 27, 2012, at the Wayback Machine at Canadian Geographic.ca
- Ronowicz, Eddie; Colin Yallop (2006). English: One Language, Different Cultures. Continuum International Publishing Group. p. 145. ISBN 978-0-8264-7079-9.
- "Census Profile, 2016 Census – Canada". Statistics Canada. August 2, 2017.
- "Census Profile". Retrieved May 18, 2020.
- Topic-based tabulations|Detailed Mother Tongue (103), Knowledge of Official Languages, 2006 Census of Canada Archived July 1, 2013, at the Wayback Machine
Further reading
- Boberg, Charles (2010). The English Language in Canada: Status, History and Comparative Analysis. Cambridge University Press. ISBN 978-0-511-78981-6.
- Edwards, John R (1998). Language in Canada. Cambridge University Press. ISBN 0-521-56328-3.
- Kosel, Jochen (2009). The Language Situation in Canada with Special Regard to Quebec. RWTH Aachen University. ISBN 978-3-640-65926-5.
- Geological Survey of Canada; William Fraser Tolmie; George Mercer Dawson (1884). Comparative vocabularies of the Indian tribes of British Columbia: with a map illustrating distribution. Dawson Bros. Retrieved 25 August 2012.
External links
| Wikimedia Commons has media related to Languages of Canada. |
- Ethnologue report for Canada
- The evolution of language populations in Canada, by mother tongue, from 1901 to 2016 (Statistics Canada)
- The Atlas of Canada – Mother tongue English
- The Atlas of Canada – Mother tongue French
- The Atlas of Canada – English-French Bilingualism
- 2006 Census: Aboriginal data
- Linguistic maps of Canada with 50 indigenous languages
- Language Portal of Canada
| Ethnic ancestry |
| ||||||||||||||||||||||||||||||||||||||||||||||||
|---|---|---|---|---|---|---|---|---|---|---|---|---|---|---|---|---|---|---|---|---|---|---|---|---|---|---|---|---|---|---|---|---|---|---|---|---|---|---|---|---|---|---|---|---|---|---|---|---|---|
| Demographics |
| ||||||||||||||||||||||||||||||||||||||||||||||||
| Culture and society | |||||||||||||||||||||||||||||||||||||||||||||||||
| List of Canadians |
| ||||||||||||||||||||||||||||||||||||||||||||||||
| |||||||||||||||||||||||||||||||||||||||||||||||||
Click on a coloured area to see an article about English in that country or region Countries.png.webp) English speaking countries | |||||||||||||||||||||||||||||||||||||||
| |||||||||||||||||||||||||||||||||||||||