Saluda County, South Carolina
Saluda County is a county in the U.S. state of South Carolina. As of the 2010 census, the population was 19,875.[1] Its county seat is Saluda.[2] The county was formed from northern and eastern portions of Edgefield County.[3]
Saluda County | |
|---|---|
 | |
 Location within the U.S. state of South Carolina | |
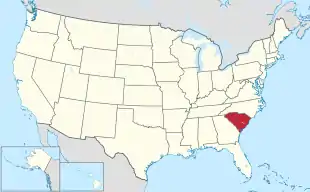 South Carolina's location within the U.S. | |
| Coordinates: 34°01′N 81°44′W | |
| Country | |
| State | |
| Founded | 1896 |
| Named for | Saluda River |
| Seat | Saluda |
| Largest town | Saluda |
| Area | |
| • Total | 462 sq mi (1,200 km2) |
| • Land | 453 sq mi (1,170 km2) |
| • Water | 9.0 sq mi (23 km2) 2.0%% |
| Population (2010) | |
| • Total | 19,875 |
| • Estimate (2018) | 20,544 |
| • Density | 43/sq mi (17/km2) |
| Time zone | UTC−5 (Eastern) |
| • Summer (DST) | UTC−4 (EDT) |
| Congressional district | 3rd |
| Website | www |
Saluda County is part of the Columbia, SC Metropolitan Area.
Geography
According to the U.S. Census Bureau, the county has a total area of 462 square miles (1,200 km2), of which 453 square miles (1,170 km2) is land and 9.0 square miles (23 km2) (2.0%) is water.[4] Saluda County is largely in the Saluda River basin with a small portion of western Saluda in the Savannah River basin.
Adjacent Counties
- Newberry County - north
- Lexington County - east
- Aiken County - south
- Edgefield County - southwest
- Greenwood County - northwest
- McCormick County - west
National protected area
- Sumter National Forest (part)
Demographics
| Historical population | |||
|---|---|---|---|
| Census | Pop. | %± | |
| 1900 | 18,966 | — | |
| 1910 | 20,943 | 10.4% | |
| 1920 | 22,088 | 5.5% | |
| 1930 | 18,148 | −17.8% | |
| 1940 | 17,192 | −5.3% | |
| 1950 | 15,924 | −7.4% | |
| 1960 | 14,554 | −8.6% | |
| 1970 | 14,528 | −0.2% | |
| 1980 | 16,150 | 11.2% | |
| 1990 | 16,357 | 1.3% | |
| 2000 | 19,181 | 17.3% | |
| 2010 | 19,875 | 3.6% | |
| 2018 (est.) | 20,544 | [5] | 3.4% |
| U.S. Decennial Census[6] 1790-1960[7] 1900-1990[8] 1990-2000[9] 2010-2013[1] | |||
2000 census
As of the census[10] of 2000, there were 19,181 people, 7,127 households, and 5,295 families living in the county. The population density was 42 people per square mile (16/km2). There were 8,543 housing units at an average density of 19 per square mile (7/km2). The racial makeup of the county was 65.80% White, 29.99% Black or African American, 0.23% Native American, 0.04% Asian, 0.01% Pacific Islander, 3.29% from other races, and 0.64% from two or more races. 7.30% of the population were Hispanic or Latino of any race.
There were 7,127 households, out of which 31.80% had children under the age of 18 living with them, 54.20% were married couples living together, 14.50% had a female householder with no husband present, and 25.70% were non-families. 22.50% of all households were made up of individuals, and 10.40% had someone living alone who was 65 years of age or older. The average household size was 2.65 and the average family size was 3.07.
In the county, the population was spread out, with 24.90% under the age of 18, 9.20% from 18 to 24, 27.60% from 25 to 44, 23.80% from 45 to 64, and 14.50% who were 65 years of age or older. The median age was 37 years. For every 100 females there were 98.60 males. For every 100 females age 18 and over, there were 95.30 males.
The median income for a household in the county was $35,774, and the median income for a family was $41,603. Males had a median income of $29,221 versus $21,395 for females. The per capita income for the county was $16,328. About 12.00% of families and 15.60% of the population were below the poverty line, including 21.40% of those under age 18 and 16.30% of those age 65 or over.
2010 census
As of the 2010 United States Census, there were 19,875 people, 7,527 households, and 5,393 families living in the county.[11] The population density was 43.9 inhabitants per square mile (16.9/km2). There were 9,289 housing units at an average density of 20.5 per square mile (7.9/km2).[12] The racial makeup of the county was 61.1% white, 26.3% black or African American, 0.4% American Indian, 0.3% Pacific islander, 0.2% Asian, 10.3% from other races, and 1.4% from two or more races. Those of Hispanic or Latino origin made up 14.4% of the population.[11] In terms of ancestry, 17.8% were American, 14.7% were German, 8.6% were English, and 8.2% were Irish.[13]
Of the 7,527 households, 32.5% had children under the age of 18 living with them, 50.6% were married couples living together, 15.0% had a female householder with no husband present, 28.4% were non-families, and 24.2% of all households were made up of individuals. The average household size was 2.61 and the average family size was 3.05. The median age was 39.6 years.[11]
The median income for a household in the county was $40,508 and the median income for a family was $45,173. Males had a median income of $31,264 versus $28,344 for females. The per capita income for the county was $18,717. About 11.7% of families and 15.1% of the population were below the poverty line, including 19.4% of those under age 18 and 15.0% of those age 65 or over.[14]
Communities
Towns
- Batesburg-Leesville (partly in Lexington County)
- Monetta (partly in Aiken County)
- Ridge Spring
- Saluda (county seat)
- Ward
Politics
| Year | Republican | Democratic | Third parties |
|---|---|---|---|
| 2016 | 64.5% 5,526 | 32.9% 2,813 | 2.6% 225 |
| 2012 | 60.0% 5,135 | 38.9% 3,328 | 1.2% 101 |
| 2008 | 60.3% 5,191 | 38.6% 3,323 | 1.0% 89 |
| 2004 | 59.9% 4,537 | 39.6% 3,001 | 0.5% 40 |
| 2000 | 59.5% 4,098 | 38.9% 2,682 | 1.6% 111 |
| 1996 | 49.6% 2,825 | 43.6% 2,486 | 6.8% 389 |
| 1992 | 47.8% 2,968 | 38.5% 2,393 | 13.7% 848 |
| 1988 | 61.6% 3,225 | 37.9% 1,984 | 0.4% 23 |
| 1984 | 63.9% 3,515 | 35.7% 1,962 | 0.4% 24 |
| 1980 | 47.4% 2,450 | 51.3% 2,651 | 1.3% 68 |
| 1976 | 43.1% 2,085 | 56.1% 2,715 | 0.8% 39 |
| 1972 | 73.9% 3,095 | 24.4% 1,022 | 1.8% 74 |
| 1968 | 30.5% 1,466 | 25.0% 1,200 | 44.5% 2,136 |
| 1964 | 64.2% 2,524 | 35.8% 1,409 | |
| 1960 | 48.4% 1,268 | 51.6% 1,353 | |
| 1956 | 14.9% 341 | 47.2% 1,080 | 37.8% 865 |
| 1952 | 46.7% 1,396 | 53.3% 1,592 | |
| 1948 | 0.8% 15 | 9.8% 187 | 89.5% 1,712 |
| 1944 | 1.3% 14 | 85.6% 924 | 13.2% 142 |
| 1940 | 1.3% 15 | 98.7% 1,115 | |
| 1936 | 0.8% 10 | 99.3% 1,324 | |
| 1932 | 0.5% 7 | 99.5% 1,307 | |
| 1928 | 0.6% 5 | 99.4% 796 | |
| 1924 | 0.3% 3 | 99.6% 1,094 | 0.2% 2 |
| 1920 | 0.3% 3 | 99.6% 1,111 | 0.2% 2 |
| 1916 | 0.1% 1 | 99.5% 1,227 | 0.4% 5 |
| 1912 | 0.0% 0 | 98.0% 850 | 2.0% 17 |
| 1904 | 0.7% 7 | 99.3% 938 | |
| 1900 | 0.6% 7 | 99.5% 1,269 |
Notable people
- William B. Travis, A Texas Lt. Colonel leading defense in The Battle of the Alamo.
References
- "State & County QuickFacts". United States Census Bureau. Retrieved November 25, 2013.
- "Find a County". National Association of Counties. Retrieved 2011-06-07.
- "South Carolina: Individual County Chronologies". South Carolina Atlas of Historical County Boundaries. The Newberry Library. 2009. Retrieved March 21, 2015.
- "2010 Census Gazetteer Files". United States Census Bureau. August 22, 2012. Retrieved March 19, 2015.
- "Population and Housing Unit Estimates". Retrieved July 30, 2019.
- "U.S. Decennial Census". United States Census Bureau. Retrieved March 19, 2015.
- "Historical Census Browser". University of Virginia Library. Retrieved March 19, 2015.
- Forstall, Richard L., ed. (March 27, 1995). "Population of Counties by Decennial Census: 1900 to 1990". United States Census Bureau. Retrieved March 19, 2015.
- "Census 2000 PHC-T-4. Ranking Tables for Counties: 1990 and 2000" (PDF). United States Census Bureau. April 2, 2001. Retrieved March 19, 2015.
- "U.S. Census website". United States Census Bureau. Retrieved 2011-05-14.
- "DP-1 Profile of General Population and Housing Characteristics: 2010 Demographic Profile Data". United States Census Bureau. Archived from the original on 2020-02-13. Retrieved 2016-03-11.
- "Population, Housing Units, Area, and Density: 2010 - County". United States Census Bureau. Archived from the original on 2020-02-13. Retrieved 2016-03-11.
- "DP02 SELECTED SOCIAL CHARACTERISTICS IN THE UNITED STATES – 2006-2010 American Community Survey 5-Year Estimates". United States Census Bureau. Archived from the original on 2020-02-13. Retrieved 2016-03-11.
- "DP03 SELECTED ECONOMIC CHARACTERISTICS – 2006-2010 American Community Survey 5-Year Estimates". United States Census Bureau. Archived from the original on 2020-02-13. Retrieved 2016-03-11.
- "Saluda County Historical Scoiety: Voices from Old Mount Willing". Archived from the original on 2009-02-23.
- "Mount Willing Populated Place Profile / Saluda County, South Carolina Data". southcarolina.hometownlocator.com.
- Leip, David. "Dave Leip's Atlas of U.S. Presidential Elections". uselectionatlas.org.
External links
- Saluda County Official Website
- Saluda County Chamber of Commerce
- Saluda County Historical Society
 Geographic data related to Saluda County, South Carolina at OpenStreetMap
Places adjacent to Saluda County, South Carolina | ||||||||||
|---|---|---|---|---|---|---|---|---|---|---|
| ||||||||||
Municipalities and communities of Saluda County, South Carolina, United States | ||
|---|---|---|
| Towns | Map of South Carolina highlighting Saluda County | |
| Ghost towns | ||
| Unincorporated communities | ||
| Footnotes | ‡This populated place also has portions in an adjacent county or counties | |
| ||
| Authority control |
|---|