Orangeburg County, South Carolina
Orangeburg County is a county located in the U.S. state of South Carolina. As of the 2010 census, the population was 92,501.[1] Its county seat is Orangeburg.[2] The county was created in 1769.[3]
Orangeburg County | |
|---|---|
 | |
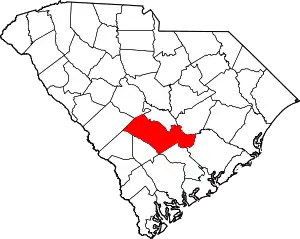 Location within the U.S. state of South Carolina | |
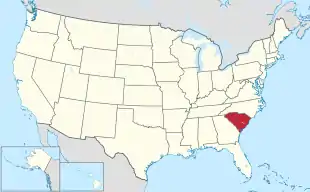 South Carolina's location within the U.S. | |
| Coordinates: 33°26′N 80°48′W | |
| Country | |
| State | |
| Founded | 1769 |
| Named for | William III of England aka "William of Orange" |
| Seat | Orangeburg |
| Largest city | Orangeburg |
| Area | |
| • Total | 1,128 sq mi (2,920 km2) |
| • Land | 1,106 sq mi (2,860 km2) |
| • Water | 22 sq mi (60 km2) 1.9%% |
| Population (2010) | |
| • Total | 92,501 |
| • Estimate (2018) | 86,934 |
| • Density | 82/sq mi (32/km2) |
| Time zone | UTC−5 (Eastern) |
| • Summer (DST) | UTC−4 (EDT) |
| Congressional districts | 2nd, 6th |
| Website | www |
Orangeburg County comprises the Orangeburg, SC Micropolitan Statistical Area, which is also included in the Columbia-Orangeburg-Newberry, SC Combined Statistical Area. It is located in the Midlands region of South Carolina.
It is the home of South Carolina State University, the only public four-year HBCU in the state of South Carolina. It is also home to Claflin University, the oldest historically black college or university (HBCU) in the state.
History
The district was occupied for thousands of years by succeeding cultures of indigenous peoples. By the time of European encounter, Siouan-speaking tribes, such as the Pee Dee, Cheraw and Catawba, inhabited the Piedmont area above the fall line.
The Orangeburg Judicial District was chartered by European Americans in 1769 from a mostly unorganized upland area between the Congaree and Savannah rivers. A county, initially of the same name but later called Orange, was organized within the district but deorganized in 1791, after the American Revolutionary War.
The southwest portion bordering on the Savannah River, about half of Orangeburg District, was separated and organized as Barnwell District in 1800. In 1804 the northern third of the district was separated to form the new Lexington District, which gained another, smaller portion of Orangeburg District in 1832.
During the nineteenth century, the districts and counties were developed chiefly as cotton plantations for short-staple cotton. This development followed the invention of the cotton gin in the late eighteenth century, which made the processing of short-staple cotton profitable. The county became a center of labor by black slaves on the plantations, who were transported from coastal areas and the Upper South to cultivate and process cotton. Those brought from the coastal areas were likely of the Gullah culture and language. The enslaved African Americans greatly outnumbered the white planters and non-slaveholding whites. Reflecting the patterns of nineteenth-century settlement, the area is still chiefly agricultural and majority-African American in population.
In 1868, under the revised state constitution during the Reconstruction era, South Carolina districts were organized as counties. Resident voters were enabled to elect their state representatives rather than having them chosen by the state legislature, as was done previously. Election of representatives by the state legislature had kept the districts dominated by the elite owners of major plantations in the Low Country and elsewhere. The changes in rules expanded participation in the franchise by more male residents. Emancipation of slaves after the war under newly ratified federal constitutional amendments resulted in freedmen voting. Using voter intimidation, white Democrats took control of the state legislature by the end of the century; they passed state electoral laws and a new constitution that essentially disfranchised most blacks, a situation that lasted until after the federal legislation of the 1965 Voting Rights Act.
A small western portion of Orangeburg County was annexed in 1871 to the newly formed Aiken County during the Reconstruction era.
In 1908 the northern portion of the County along the Congaree River was separated and included in the newly formed Calhoun County, with its seat at Saint Matthews. In 1910 a small western portion of Berkeley County, around Holly Hill and Eutawville, was annexed to Orangeburg County, thus bringing the county to its present size.
Geography

According to the U.S. Census Bureau, the county has a total area of 1,128 square miles (2,920 km2), of which 1,106 square miles (2,860 km2) is land and 22 square miles (57 km2) (1.9%) is water.[4] It is the second-largest county in South Carolina by land area and fifth-largest by land area.
- Region within the state
Orangeburg county is a fairly big county, covering 1,128 square miles, it is about 60 miles from the western part of the county to the eastern part of the county. Orangeburg county lies within 3 "regions" of South Carolina. The western part of the county lies in the "CSRA" (Central Savannah River Area). The middle part of Orangeburg county is included in the "Midlands" Region. The eastern and south eastern part of the county are located in the "Lowcountry" region of the state.
Adjacent counties
- Calhoun County - north
- Clarendon County - northeast
- Dorchester County - southeast
- Berkeley County - southeast
- Bamberg County - south
- Colleton County - south
- Aiken County - west
- Barnwell County - west
- Lexington County - northwest
Demographics
| Historical population | |||
|---|---|---|---|
| Census | Pop. | %± | |
| 1790 | 18,513 | — | |
| 1800 | 15,766 | −14.8% | |
| 1810 | 13,229 | −16.1% | |
| 1820 | 15,653 | 18.3% | |
| 1830 | 18,453 | 17.9% | |
| 1840 | 18,519 | 0.4% | |
| 1850 | 23,582 | 27.3% | |
| 1860 | 24,896 | 5.6% | |
| 1870 | 16,865 | −32.3% | |
| 1880 | 41,395 | 145.4% | |
| 1890 | 49,393 | 19.3% | |
| 1900 | 59,663 | 20.8% | |
| 1910 | 55,893 | −6.3% | |
| 1920 | 64,907 | 16.1% | |
| 1930 | 63,864 | −1.6% | |
| 1940 | 63,707 | −0.2% | |
| 1950 | 68,726 | 7.9% | |
| 1960 | 68,559 | −0.2% | |
| 1970 | 69,789 | 1.8% | |
| 1980 | 82,276 | 17.9% | |
| 1990 | 84,803 | 3.1% | |
| 2000 | 91,582 | 8.0% | |
| 2010 | 92,501 | 1.0% | |
| 2018 (est.) | 86,934 | [5] | −6.0% |
| U.S. Decennial Census[6] 1790-1960[7] 1900-1990[8] 1990-2000[9] 2010-2013[1] | |||
2000 census
At the 2000 census there were 91,582 people, 34,118 households, and 23,882 families in the county. The population density was 83 people per square mile (32/km2). There were 39,304 housing units at an average density of 36 per square mile (14/km2). The racial makeup of the county was 60.86% Black or African American, 37.17% White, 0.46% Native American, 0.43% Asian, 0.02% Pacific Islander, 0.36% from other races, and 0.70% from two or more races. 0.96% of the population were Hispanic or Latino of any race.[10] Of the 34,118 households 32.00% had children under the age of 18 living with them, 45.10% were married couples living together, 20.30% had a female householder with no husband present, and 30.00% were non-families. 26.00% of households were one person and 10.30% were one person aged 65 or older. The average household size was 2.58 and the average family size was 3.11.
The age distribution was 26.00% under the age of 18, 11.90% from 18 to 24, 26.10% from 25 to 44, 22.80% from 45 to 64, and 13.20% 65 or older. The median age was 35 years. For every 100 females there were 87.00 males. For every 100 females age 18 and over, there were 81.60 males.
The median household income was $29,567 and the median family income was $36,165. Males had a median income of $29,331 versus $20,956 for females. The per capita income for the county was $15,057. About 17.00% of families and 21.40% of the population were below the poverty line, including 27.20% of those under age 18 and 22.30% of those age 65 or over.
2010 census
At the 2010 census, there were 92,501 people, 35,788 households, and 23,580 families in the county.[11] The population density was 83.6 inhabitants per square mile (32.3/km2). There were 42,504 housing units at an average density of 38.4 per square mile (14.8/km2).[12] The racial makeup of the county was 62.2% black or African American, 34.3% white, 0.8% Asian, 0.5% American Indian, 0.9% from other races, and 1.2% from two or more races. Those of Hispanic or Latino origin made up 1.9% of the population.[11] In terms of ancestry, 7.7% were American, and 5.1% were German.[13]
Of the 35,788 households, 32.5% had children under the age of 18 living with them, 38.1% were married couples living together, 22.5% had a female householder with no husband present, 34.1% were non-families, and 29.0% of households were made up of individuals. The average household size was 2.49 and the average family size was 3.06. The median age was 38.1 years.[11]
The median household income was $32,849 and the median family income was $40,332. Males had a median income of $35,934 versus $28,508 for females. The per capita income for the county was $17,579. About 21.1% of families and 25.8% of the population were below the poverty line, including 32.9% of those under age 18 and 19.1% of those age 65 or over.[14]
Native Americans
The Beaver Creek Indians and its splinter Pee Dee Indian Nation of Beaver Creek) traditionally came into the area from Virginia occupying land at Long Cane Creek. Some Beaver Creek members still live in this area. In 1998 the tribe established its government as a non-profit organization, known as the Beaver Creek Indians and achieved state recognition as a tribe on January 27, 2006.
The Pine Hill Indian Tribe resettled into the Pine Hill area of Orangeburg County after forced removal by the United States Government from their original land at the Congaree-Wateree River Basin in Richland County, identified in pre-colonial records as the center of Cofitachequi. Removal allowed the creation of Camp Jackson. Camp Jackson was deregulated and then reinstated as the military reservation now known as Fort Jackson, South Carolina. The Pine Hill Indian Tribe is acknowledged by the United States Government, recognized by the State of South Carolina, and is associated to the Treaty of New Echota signed by its ancestor John Fields.
Economy
Orangeburg County is one of the largest agricultural producing counties in South Carolina, with fertile, slightly rolling land. Major crops are cotton, soybeans, corn, turf grass and watermelons.
 Grain elevator in Orangeburg, SC
 Soybeans ready for harvest, with center pivot irrigation setup, Orangeburg County, South Carolina
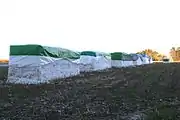 Harvested cotton in modules ready for pickup, Orangeburg County, SC
Transportation
Railroads
At least four railroad lines run through Orangeburg County; a former Southern Railway Line, and three CSX lines, the westernmost which was formerly a Seaboard Air Line Railroad line running along US 321.[15]
Politics
| Year | Republican | Democratic | Third parties |
|---|---|---|---|
| 2020 | 33.0% 13,603 | 66.2% 27,295 | 0.8% 307 |
| 2016 | 30.7% 11,931 | 67.6% 26,318 | 1.7% 661 |
| 2012 | 27.9% 12,022 | 71.4% 30,720 | 0.7% 299 |
| 2008 | 30.5% 12,115 | 68.6% 27,263 | 1.0% 376 |
| 2004 | 33.8% 12,695 | 65.8% 24,698 | 0.5% 171 |
| 2000 | 38.7% 12,657 | 60.5% 19,802 | 0.8% 275 |
| 1996 | 34.6% 10,494 | 61.4% 18,610 | 4.0% 1,211 |
| 1992 | 35.1% 11,328 | 57.2% 18,440 | 7.7% 2,466 |
| 1988 | 47.4% 13,281 | 52.3% 14,655 | 0.4% 113 |
| 1984 | 48.2% 14,286 | 51.0% 15,121 | 0.8% 229 |
| 1980 | 40.8% 11,313 | 58.3% 16,178 | 0.9% 242 |
| 1976 | 38.9% 8,794 | 60.4% 13,652 | 0.7% 158 |
| 1972 | 59.3% 11,711 | 38.8% 7,652 | 1.9% 382 |
| 1968 | 24.2% 5,144 | 42.2% 8,971 | 33.6% 7,144 |
| 1964 | 65.1% 10,456 | 34.9% 5,607 | |
| 1960 | 57.4% 5,233 | 42.6% 3,890 | |
| 1956 | 21.2% 1,467 | 36.3% 2,511 | 42.5% 2,943 |
| 1952 | 62.4% 4,695 | 37.6% 2,829 | |
| 1948 | 4.4% 164 | 11.6% 435 | 84.1% 3,164 |
| 1944 | 3.2% 87 | 90.6% 2,440 | 6.2% 166 |
| 1940 | 2.3% 56 | 97.7% 2,356 | |
| 1936 | 2.0% 59 | 98.0% 2,947 | |
| 1932 | 4.0% 111 | 95.9% 2,643 | 0.1% 3 |
| 1928 | 5.6% 92 | 94.4% 1,545 | |
| 1924 | 3.7% 67 | 95.6% 1,727 | 0.7% 13 |
| 1920 | 10.7% 304 | 89.2% 2,526 | 0.0% 1 |
| 1916 | 5.6% 159 | 93.3% 2,641 | 1.1% 31 |
| 1912 | 2.4% 40 | 92.0% 1,550 | 5.6% 95 |
| 1904 | 7.5% 238 | 92.5% 2,941 | |
| 1900 | 6.4% 167 | 93.6% 2,457 |
Communities
City
- Orangeburg (county seat)
Towns
Census-designated places
- Brookdale
- Edisto
- Wilkinson Heights
See also
References
- "State & County QuickFacts". United States Census Bureau. Archived from the original on June 6, 2011. Retrieved November 25, 2013.
- "Find a County". National Association of Counties. Archived from the original on May 3, 2015. Retrieved 2011-06-07.
- "South Carolina: Individual County Chronologies". South Carolina Atlas of Historical County Boundaries. The Newberry Library. 2009. Retrieved March 21, 2015.
- "2010 Census Gazetteer Files". United States Census Bureau. August 22, 2012. Retrieved March 18, 2015.
- "Population and Housing Unit Estimates". Retrieved July 30, 2019.
- "U.S. Decennial Census". United States Census Bureau. Retrieved March 18, 2015.
- "Historical Census Browser". University of Virginia Library. Retrieved March 18, 2015.
- Forstall, Richard L., ed. (March 27, 1995). "Population of Counties by Decennial Census: 1900 to 1990". United States Census Bureau. Retrieved March 18, 2015.
- "Census 2000 PHC-T-4. Ranking Tables for Counties: 1990 and 2000" (PDF). United States Census Bureau. April 2, 2001. Retrieved March 18, 2015.
- "U.S. Census website". United States Census Bureau. Retrieved 2011-05-14.
- "DP-1 Profile of General Population and Housing Characteristics: 2010 Demographic Profile Data". United States Census Bureau. Archived from the original on 2020-02-13. Retrieved 2016-03-11.
- "Population, Housing Units, Area, and Density: 2010 - County". United States Census Bureau. Archived from the original on 2020-02-13. Retrieved 2016-03-11.
- "DP02 SELECTED SOCIAL CHARACTERISTICS IN THE UNITED STATES – 2006-2010 American Community Survey 5-Year Estimates". United States Census Bureau. Archived from the original on 2020-02-13. Retrieved 2016-03-11.
- "DP03 SELECTED ECONOMIC CHARACTERISTICS – 2006-2010 American Community Survey 5-Year Estimates". United States Census Bureau. Archived from the original on 2020-02-13. Retrieved 2016-03-11.
- South Carolina - Railroads
- Leip, David. "Dave Leip's Atlas of U.S. Presidential Elections". uselectionatlas.org. Retrieved 2018-03-13.
External links
 Media related to Orangeburg County, South Carolina at Wikimedia Commons
Places adjacent to Orangeburg County, South Carolina | |
|---|---|
Municipalities and communities of Orangeburg County, South Carolina, United States | ||
|---|---|---|
| City | Map of South Carolina highlighting Orangeburg County | |
| Towns | ||
| CDPs | ||
| Unincorporated communities | ||
| ||
| Authority control |
|---|