Segger Microcontroller Systems
SEGGER Microcontroller, founded in 1992, is a private company active in the industry of Embedded Systems. It provides software libraries ( middleware ) plus programming and development tools. SEGGER produces debug probes, with accompanying debugger and performance analyzer software, plus communication and security software. The company is headquartered in Monheim am Rhein, Germany with US offices in Gardner, Massachusetts and Milpitas, California.
| Type | GmbH |
|---|---|
| Industry | Embedded software |
| Founded | 1992 |
| Headquarters | Monheim am Rhein, Germany Gardner, Massachusetts USA Milpitas, California USA |
| Products | Middleware components, JTAG development tools |
| Website | segger.com, segger-us.com |
RTOS embedded software
embedded Operating System (embOS), is a Real-time operating system, developed by the Company SEGGER Microcontroller. embOS is designed to be used as a foundation for the development of embedded real-time applications for a wide range of microcontrollers.
embOS features
embOS is an RTOS for all embedded applications. embOS is written from scratch by the SEGGER Microcontroller company using Ansi C and assembler. Other features are:
- unlimited amount of tasks (only limited by the amount of available memory)
- preemptive scheduling with up to 232 priorities
- Round Robin with adjustable time-slices for tasks with equal priority
- adjustable time resolution (default is 1ms)
- software timers
- low power and multi-core support
- safe communication among tasks using:
- task events with up to 32 events per task
- event objects
- resource and counting semaphores
- mailboxes
- queues
- full interrupt support
- API can be called from assembly, C and C++ code
In addition to embOS, embOS-MPU offers memory protection by using the hardware's memory protection unit as well as additional software mechanisms to prevent one task from affecting the entirety of the system.
embOSView
embOSView is a tool for analysis of the running target application on an embedded system using embOS. For communication, embOSView can use UART, memory read/write for Cortex-M and RX CPUs, DCC for ARM7/9 and Cortex-A CPUs as well as ethernet. Beside system variables and software tracing, embOSView also lists all tasks with following information:
- ID: Task ID, which is the address of the task control block
- Name: Name assigned during creation
- Status: Current state of task (ready, executing, delayed, reason for suspension)
- Data: Depends on status
- Timeout: Time of next activation
- Stack: Used stack size/max. stack size/stack location
- CPU Load: Percentage CPU load caused by task
- Run Count: Number of activations since reset
- Time Slice: Round robin time slice
Field of application
embOS is used in a variety of embedded systems in the fields of application like:
- Industrial Controls
- Internet of Things
- Networking
- Consumer electronics
- Safety critical devices
- Automotive
- Medical devices
- Avionic
It is supported by popular SSL/TLS libraries such as wolfSSL, thus maintaining embedded security standards across industries.
Supported devices
embOS supports all cores and compilers, e.g.:
ARM7/9/11, ARM Cortex-A/R/M, Altera NIOS2, AVR, AVR32, C16x, CR16C, ColdFire, H8, HCS12, M16C, M32C, MSP430, NIOS2, PIC18/24/32, PowerPC, R32C, R8C, 78K0, V850, RL78, RH850, RX100/200/600/700, RZ, SH2A, STM8, ST7, S08, 8051, Xtensa, ...
GCC, IAR, Keil MDK, Tasking, GreenHills, CodeWarrior, Renesas compiler CCRX, CCRL, ...
Other embedded software
SEGGER also provides software/middleware in the fields of connectivity, crypto & security, and the Internet of Things (IoT).
Hardware
J-Trace
J-Trace PRO is an advanced debug probe that can capture complete instruction traces over long periods of time thereby enabling the recording of infrequent, hard-to-reproduce bugs. It supports all popular debuggers and IDEs and can be used cross platform with Windows, Linux, and macOS.
J-Link
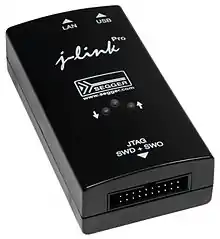
Segger is most noted for its JTAG / SWD emulators for ARM-based microcontrollers that have ARM7 / ARM9 / ARM11, Cortex M0 / M0+ / M1 / M3 / M4 / M7 / M23 / M33, Cortex R4 / R5 / R8, Cortex A5 / A7 / A8 / A9 / A12 / A15 / A17 cores, Renesas RX, and Microchip PIC32. This device is called the J-Link.[1] It is also repackaged and sold as an OEM item[2] by Analog Devices as the mIDASLink, Atmel as the SAM-ICE, Digi International as the Digi JTAG Link, and IAR Systems as the J-Link and the J-Link KS. This is the only JTAG emulator that can add Segger's patented flash breakpoint software to a debugger to enable the setting of multiple breakpoints in flash while running on an ARM device which is typically hindered by the limited availability of hardware breakpoints.[3] For enhanced emulation features Segger offers a trace emulator, J-Trace that works with the ARM ETM interface and enables engineers to trace back their code execution.
| Model* | Host USB | Host Ethernet | Host Wi-Fi | Target Connector | Trace Connector | Target Voltage | Target Max Interface Speed | Target Max Download Speed |
|---|---|---|---|---|---|---|---|---|
| J-Trace PRO Cortex | 3.0 SS | 1 Gbit/s | No | 20-pin 0.1" | 19-pin 0.05" | |||
| J-Trace PRO Cortex-M | 3.0 SS | 1 Gbit/s | No | 20-pin 0.1" | 19-pin 0.05" | |||
| J-Link PRO | 2.0 HS | 100 Mbit/s | No | 20-pin 0.1" | No | |||
| J-Link ULTRA+ | 2.0 HS | No | No | 20-pin 0.1" | No | |||
| J-Link WiFi | 2.0 HS | No | 802.11b/g/n | 20-pin 0.1" | No | |||
| J-Link PLUS | 2.0 HS | No | No | 20-pin 0.1" | No | |||
| J-Link BASE | 2.0 HS | No | No | 20-pin 0.1" | No | |||
| J-Link EDU | 2.0 HS | No | No | 20-pin 0.1" | No | |||
| J-Link EDU Mini | 2.0 FS | No | No | 9-pin 0.05" | No | 3.3V | 4 MHz | 0.2 MByte/s |
- Note: Additional models are J-Link LITE ARM, J-Link LITE CortexM, J-Link LITE RX, J-Link OB, J-Link OEM.[5]
- Note: PLUS / BASE / EDU models are physically the same hardware. The difference is license and software options, such as GDB Server, Flash Download, Unlimited Flash Breakpoints, J-Flash, RDI, RDDI. The EDU model can't be used for commercial software development.
- Note: Adapters and isolators are available to convert the 20-pin 0.1"/2.54mm male shrouded (box) header to another target board connector.[6]
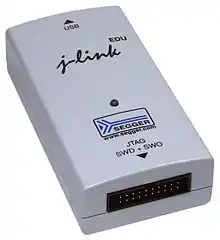 Segger J-Link EDU: JTAG / SWD debug probe for ARM microcontrollers with USB interface to host. Low price model for educational and hobbyist users.
Flasher
 Segger Flasher Portable: Portable programmer for internal and external flash memory of ARM, PowerPC, Renesas RX microcontrollers.
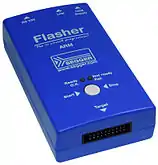 Segger Flasher ARM: Programmer for internal and external flash memory of ARM microcontrollers.
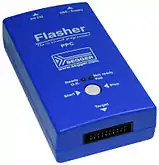 Segger Flasher PPC: Programmer for internal and external flash memory of PowerPC microcontrollers.
Software tools for embedded systems
SEGGER produces software tools for developers and engineers of embedded systems and Internet-of-Things environments, to develop, create, verify, test, and debug embedded applications, and target systems or devices.
Embedded Studio
Embedded Studio is a C/C++ IDE for embedded systems. It is specifically designed to provide users with everything needed for professional embedded C programming and development.
Embedded Studio includes compilers Clang and GCC, plus the in-house SEGGER Compiler, and has support for 3rd party debug probes via GDB protocol.
It can be used cross platform with Windows, Linux, and macOS.
SystemView
SystemView is a real-time recording and visualization tool for embedded systems that reveals the true runtime behavior of an application, going deeper than the system insights provided by debuggers. It is particularly effective when developing and working with complex embedded systems comprising multiple threads and interrupts.
SystemView can ensure a system performs as designed, can track down inefficiencies, and show unintended interactions and resource conflicts, with a focus on the details of every single system tick.
It provides continuous real-time recording of an embedded system, captures tasks, interrupts, timers, resources, API calls, and user events, and allows for live analysis and visualization of captured data.
SystemView records via J-Link and SEGGER RTT Technology, IP, or UART, works on any CPU, works with any RTOS and bare-metal systems, and is minimally system intrusive.
Ozone — J-Link debugger and performance analyzer
Ozone is a full-featured graphical debugger for embedded applications. With Ozone it is possible to debug any embedded application on C/C++ source and assembly level.
It can load applications built with any tool chain / IDE or debug the target's resident application without any source. It includes all well-known debug controls and information windows and makes use of J-Link and J-Trace debug probes.
See also
- Embedded system, Single-board microcontroller
- ARM architecture, List of ARM microprocessor cores
- JTAG, SWD
- GNU Debugger (GDB)
References
External links
| Wikimedia Commons has media related to Segger. |
