1936 United States presidential election in New Hampshire
The 1936 United States presidential election in New Hampshire was held on November 3, 1936 as part of the 1936 United States presidential election. The state voters chose four electors to the Electoral College, who voted for president and vice president.
| ||||||||||||||||||||||||||
| ||||||||||||||||||||||||||
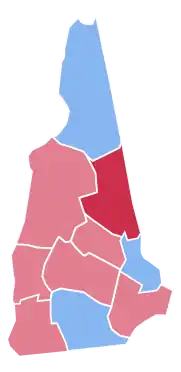 County Results
| ||||||||||||||||||||||||||
| ||||||||||||||||||||||||||
| Elections in New Hampshire |
|---|
 |
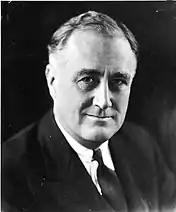
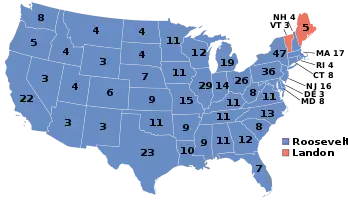
New Hampshire voted for Democratic Party candidate and incumbent President Franklin D. Roosevelt, who won the state by a narrow margin of 1.75%, after early reports showed Landon carrying the state.[1] With Roosevelt's victory in New Hampshire, he became the first Democratic candidate since President Woodrow Wilson in 1916 to carry the state. The state was also the closest in the election.
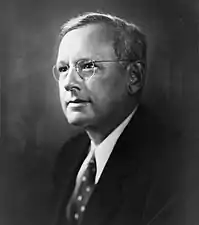
While Landon lost the state, the 47.98% of the popular vote made New Hampshire his third strongest state after neighboring Vermont and Maine, which were the only two states Landon won in the election.[2]
Results
| 1936 United States presidential election in New Hampshire[3] | ||||||||
|---|---|---|---|---|---|---|---|---|
| Party | Candidate | Running mate | Popular vote | Electoral vote | ||||
| Count | % | Count | % | |||||
| Democratic | Franklin Delano Roosevelt of New York | John Nance Garner of Texas | 108,460 | 49.73% | 4 | 100.00% | ||
| Republican | Alf Landon of Kansas | Frank Knox of Illinois | 104,642 | 47.98% | 0 | 0.00% | ||
| Union | William Lemke of North Dakota | Thomas C. O'Brien of Massachusetts | 4,819 | 2.21% | 0 | 0.00% | ||
| Communist | Earl Russell Browder of Kansas | James W. Ford of New York | 193 | 0.09% | 0 | 0.00% | ||
| Total | 218,114 | 100.00% | 4 | 100.00% | ||||
Results by county
| County | Franklin Delano Roosevelt Democratic |
Alfred Mossman Landon Republican |
William Frederick Lemke[4] Union |
Earl Russell Browder Communist |
Margin | Total votes cast[5] | |||||
|---|---|---|---|---|---|---|---|---|---|---|---|
| # | % | # | % | # | % | # | % | # | % | ||
| Belknap | 5,150 | 44.70% | 6,219 | 53.98% | 145 | 1.26% | 8 | 0.07% | -1,069 | -9.28% | 11,522 |
| Carroll | 2,769 | 33.26% | 5,521 | 66.32% | 32 | 0.38% | 3 | 0.04% | -2,752 | -33.06% | 8,325 |
| Cheshire | 6,322 | 43.38% | 8,052 | 55.25% | 183 | 1.26% | 17 | 0.12% | -1,730 | -11.87% | 14,574 |
| Coös | 8,737 | 55.67% | 6,737 | 42.93% | 196 | 1.25% | 24 | 0.15% | 2,000 | 12.74% | 15,694 |
| Grafton | 8,520 | 42.57% | 11,336 | 56.63% | 142 | 0.71% | 18 | 0.09% | -2,816 | -14.06% | 20,016 |
| Hillsborough | 34,992 | 57.20% | 23,293 | 38.07% | 2,841 | 4.64% | 54 | 0.09% | 11,699 | 19.13% | 61,180 |
| Merrimack | 13,645 | 48.18% | 14,456 | 51.05% | 194 | 0.69% | 24 | 0.08% | -811 | -2.87% | 28,319 |
| Rockingham | 12,207 | 43.21% | 15,466 | 54.75% | 559 | 1.98% | 17 | 0.06% | -3,259 | -11.54% | 28,249 |
| Strafford | 11,005 | 55.87% | 8,215 | 41.71% | 464 | 2.36% | 13 | 0.07% | 2,790 | 14.16% | 19,697 |
| Sullivan | 5,113 | 48.52% | 5,347 | 50.74% | 63 | 0.60% | 15 | 0.14% | -234 | -2.22% | 10,538 |
| Totals | 108,460 | 49.73% | 104,642 | 47.98% | 4,819 | 2.21% | 193 | 0.09% | 3,818 | 1.75% | 218,114 |
References
- ‘Roosevelt Goes in by Big Vote; Democratic Party Takes Electoral Vote of All but Two States – Congress Democratic; Democrats Elect Governors in Twenty-Three States, Republicans in Two’; Lawrence Daily Journal-World, November 4, 1936, p. 1
- "1936 Presidential Election Statistics". Dave Leip’s Atlas of U.S. Presidential Elections. Retrieved 2018-03-05.
- "1936 Presidential General Election Results - New Hampshire". U.S. Election Atlas. Retrieved 23 December 2013.
- Géoelections; 1936 Presidential Election Popular Vote (.xlsx file for €15 on request)
- Scammon, Richard M. (compiler); America at the Polls: A Handbook of Presidential Election Statistics 1920-1964; p. 294 ISBN 0405077114
