1936 United States presidential election in Minnesota
The 1936 United States presidential election in Minnesota took place on November 3, 1936 as part of the 1936 United States presidential election.
| |||||||||||||||||||||||||||||||||
| |||||||||||||||||||||||||||||||||
 County Results
| |||||||||||||||||||||||||||||||||
| |||||||||||||||||||||||||||||||||
| Elections in Minnesota |
|---|
 |
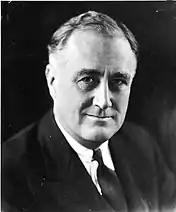
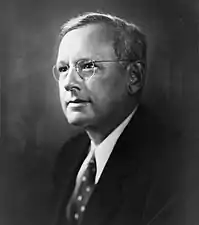
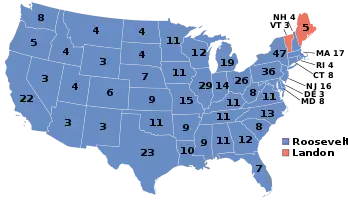
Minnesota was won by the Democratic candidate, incumbent President Franklin D. Roosevelt won the state over Kansas governor Alf Landon by a margin of 348,350 votes, or 30.83%—nearly doubling Landon's overall share of the state's vote. Nationally, Roosevelt was soundly re-elected, with 523 electoral votes and a landslide 24.26% lead over Landon in the popular vote. Landon carried only two states: Maine and Vermont, whilst in Minnesota Landon won just three counties: Otter Tail in the rural west, Carver in the exurban Twin Cities, and southeastern Fillmore County. Of these, only Fillmore has ever voted Democratic in a presidential election since,[1] doing so initially in Lyndon Johnson’s 1964 landslide, and in every election from 1992 to 2012.
Only five presidential nominees have ever won a greater percentage of the vote in Minnesota than Roosevelt did in 1936: Theodore Roosevelt in 1904 (74%), Warren G. Harding in 1920 (70.6%), Lyndon B. Johnson in 1964 (63.8%), Abraham Lincoln in 1860 (63.5%), and James A. Garfield in 1880 (62.3%)—every one of them going on to win the election nationally. As of the 2020 election, this is the last election in which either major party candidate exceeded 80% of the vote in any Minnesota county, with Roosevelt doing so in Lake County.
Results
| 1936 United States presidential election in Minnesota[2] | |||||
|---|---|---|---|---|---|
| Party | Candidate | Votes | Percentage | Electoral votes | |
| Democratic | Franklin D. Roosevelt (incumbent) | 698,811 | 61.84% | 11 | |
| Republican | Alf Landon | 350,461 | 31.01% | 0 | |
| Union | William Lemke | 74,296 | 6.58% | 0 | |
| Socialist | Norman Thomas | 2,872 | 0.25% | 0 | |
| Communist | Earl Browder | 2,574 | 0.23% | 0 | |
| Socialist Labor | John W. Aiken | 961 | 0.09% | 0 | |
| Totals | 1,129,975 | 100.00% | 11 | ||
Results by county
| County | Franklin Delano Roosevelt Democratic |
Alfred Mossman Landon Republican |
William Frederick Lemke[3] Union |
Various candidates Other parties |
Margin | Total votes cast[4] | |||||
|---|---|---|---|---|---|---|---|---|---|---|---|
| # | % | # | % | # | % | # | % | # | % | ||
| Aitkin | 3,806 | 57.57% | 2,466 | 37.30% | 229 | 3.46% | 110 | 1.66% | 1,340 | 20.27% | 6,611 |
| Anoka | 4,501 | 56.91% | 2,586 | 32.70% | 788 | 9.96% | 34 | 0.43% | 1,915 | 24.21% | 7,909 |
| Becker | 6,473 | 68.38% | 2,683 | 28.34% | 249 | 2.63% | 61 | 0.64% | 3,790 | 40.04% | 9,466 |
| Beltrami | 6,507 | 72.65% | 2,182 | 24.36% | 157 | 1.75% | 111 | 1.24% | 4,325 | 48.29% | 8,957 |
| Benton | 3,111 | 53.52% | 1,783 | 30.67% | 905 | 15.57% | 14 | 0.24% | 1,328 | 22.85% | 5,813 |
| Big Stone | 2,648 | 66.22% | 1,116 | 27.91% | 221 | 5.53% | 14 | 0.35% | 1,532 | 38.31% | 3,999 |
| Blue Earth | 8,255 | 55.89% | 5,550 | 37.58% | 921 | 6.24% | 43 | 0.29% | 2,705 | 18.32% | 14,769 |
| Brown | 6,637 | 64.64% | 2,679 | 26.09% | 899 | 8.76% | 52 | 0.51% | 3,958 | 38.55% | 10,267 |
| Carlton | 7,136 | 75.29% | 2,163 | 22.82% | 81 | 0.85% | 98 | 1.03% | 4,973 | 52.47% | 9,478 |
| Carver | 2,814 | 38.59% | 3,095 | 42.44% | 1,366 | 18.73% | 17 | 0.23% | -281 | -3.85% | 7,292 |
| Cass | 4,440 | 60.54% | 2,634 | 35.91% | 229 | 3.12% | 31 | 0.42% | 1,806 | 24.63% | 7,334 |
| Chippewa | 4,027 | 61.40% | 2,223 | 33.89% | 268 | 4.09% | 41 | 0.63% | 1,804 | 27.50% | 6,559 |
| Chisago | 3,360 | 55.26% | 2,462 | 40.49% | 229 | 3.77% | 29 | 0.48% | 898 | 14.77% | 6,080 |
| Clay | 6,282 | 65.29% | 2,880 | 29.93% | 416 | 4.32% | 43 | 0.45% | 3,402 | 35.36% | 9,621 |
| Clearwater | 3,208 | 75.34% | 939 | 22.05% | 92 | 2.16% | 19 | 0.45% | 2,269 | 53.29% | 4,258 |
| Cook | 793 | 65.86% | 387 | 32.14% | 18 | 1.50% | 6 | 0.50% | 406 | 33.72% | 1,204 |
| Cottonwood | 3,929 | 59.32% | 2,509 | 37.88% | 171 | 2.58% | 14 | 0.21% | 1,420 | 21.44% | 6,623 |
| Crow Wing | 6,561 | 61.47% | 3,611 | 33.83% | 431 | 4.04% | 70 | 0.66% | 2,950 | 27.64% | 10,673 |
| Dakota | 8,890 | 57.73% | 4,043 | 26.26% | 2,407 | 15.63% | 58 | 0.38% | 4,847 | 31.48% | 15,398 |
| Dodge | 2,812 | 54.73% | 2,138 | 41.61% | 176 | 3.43% | 12 | 0.23% | 674 | 13.12% | 5,138 |
| Douglas | 4,186 | 56.84% | 2,681 | 36.41% | 474 | 6.44% | 23 | 0.31% | 1,505 | 20.44% | 7,364 |
| Faribault | 5,603 | 56.90% | 3,773 | 38.32% | 451 | 4.58% | 20 | 0.20% | 1,830 | 18.58% | 9,847 |
| Fillmore | 4,764 | 45.79% | 5,054 | 48.58% | 559 | 5.37% | 27 | 0.26% | -290 | -2.79% | 10,404 |
| Freeborn | 7,378 | 59.96% | 4,653 | 37.81% | 245 | 1.99% | 29 | 0.24% | 2,725 | 22.15% | 12,305 |
| Goodhue | 8,257 | 57.50% | 5,682 | 39.57% | 364 | 2.53% | 58 | 0.40% | 2,575 | 17.93% | 14,361 |
| Grant | 2,358 | 57.87% | 1,566 | 38.43% | 121 | 2.97% | 30 | 0.74% | 792 | 19.44% | 4,075 |
| Hennepin | 144,289 | 58.78% | 81,206 | 33.08% | 18,468 | 7.52% | 1,517 | 0.62% | 63,083 | 25.70% | 245,480 |
| Houston | 3,156 | 51.74% | 2,701 | 44.28% | 221 | 3.62% | 22 | 0.36% | 455 | 7.46% | 6,100 |
| Hubbard | 2,312 | 56.92% | 1,618 | 39.83% | 106 | 2.61% | 26 | 0.64% | 694 | 17.09% | 4,062 |
| Isanti | 3,442 | 67.19% | 1,437 | 28.05% | 201 | 3.92% | 43 | 0.84% | 2,005 | 39.14% | 5,123 |
| Itasca | 8,896 | 69.41% | 3,592 | 28.03% | 190 | 1.48% | 139 | 1.08% | 5,304 | 41.38% | 12,817 |
| Jackson | 5,187 | 72.09% | 1,676 | 23.29% | 311 | 4.32% | 21 | 0.29% | 3,511 | 48.80% | 7,195 |
| Kanabec | 2,579 | 63.09% | 1,350 | 33.02% | 133 | 3.25% | 26 | 0.64% | 1,229 | 30.06% | 4,088 |
| Kandiyohi | 6,595 | 69.25% | 2,500 | 26.25% | 352 | 3.70% | 77 | 0.81% | 4,095 | 43.00% | 9,524 |
| Kittson | 3,127 | 73.25% | 1,080 | 25.30% | 31 | 0.73% | 31 | 0.73% | 2,047 | 47.95% | 4,269 |
| Koochiching | 5,065 | 77.77% | 1,316 | 20.21% | 84 | 1.29% | 48 | 0.74% | 3,749 | 57.56% | 6,513 |
| Lac qui Parle | 3,243 | 54.09% | 2,066 | 34.46% | 679 | 11.32% | 8 | 0.13% | 1,177 | 19.63% | 5,996 |
| Lake | 2,717 | 80.15% | 617 | 18.20% | 30 | 0.88% | 26 | 0.77% | 2,100 | 61.95% | 3,390 |
| Lake of the Woods | 1,566 | 76.32% | 385 | 18.76% | 73 | 3.56% | 28 | 1.36% | 1,181 | 57.55% | 2,052 |
| Le Sueur | 5,077 | 57.27% | 2,849 | 32.14% | 920 | 10.38% | 19 | 0.21% | 2,228 | 25.13% | 8,865 |
| Lincoln | 2,662 | 61.42% | 1,199 | 27.66% | 448 | 10.34% | 25 | 0.58% | 1,463 | 33.76% | 4,334 |
| Lyon | 5,163 | 61.29% | 2,551 | 30.28% | 695 | 8.25% | 15 | 0.18% | 2,612 | 31.01% | 8,424 |
| McLeod | 4,449 | 55.21% | 2,941 | 36.50% | 635 | 7.88% | 33 | 0.41% | 1,508 | 18.71% | 8,058 |
| Mahnomen | 2,025 | 76.88% | 474 | 18.00% | 120 | 4.56% | 15 | 0.57% | 1,551 | 58.88% | 2,634 |
| Marshall | 4,802 | 70.08% | 1,904 | 27.79% | 116 | 1.69% | 30 | 0.44% | 2,898 | 42.29% | 6,852 |
| Martin | 6,492 | 66.08% | 3,090 | 31.45% | 215 | 2.19% | 28 | 0.28% | 3,402 | 34.63% | 9,825 |
| Meeker | 4,242 | 56.25% | 2,479 | 32.87% | 797 | 10.57% | 24 | 0.32% | 1,763 | 23.38% | 7,542 |
| Mille Lacs | 3,767 | 60.56% | 2,091 | 33.62% | 333 | 5.35% | 29 | 0.47% | 1,676 | 26.95% | 6,220 |
| Morrison | 6,112 | 62.06% | 2,682 | 27.23% | 1,022 | 10.38% | 32 | 0.32% | 3,430 | 34.83% | 9,848 |
| Mower | 8,228 | 61.01% | 4,743 | 35.17% | 467 | 3.46% | 49 | 0.36% | 3,485 | 25.84% | 13,487 |
| Murray | 3,926 | 67.05% | 1,601 | 27.34% | 316 | 5.40% | 12 | 0.20% | 2,325 | 39.71% | 5,855 |
| Nicollet | 4,136 | 59.06% | 2,360 | 33.70% | 488 | 6.97% | 19 | 0.27% | 1,776 | 25.36% | 7,003 |
| Nobles | 4,919 | 60.94% | 2,601 | 32.22% | 531 | 6.58% | 21 | 0.26% | 2,318 | 28.72% | 8,072 |
| Norman | 3,778 | 68.67% | 1,570 | 28.54% | 89 | 1.62% | 65 | 1.18% | 2,208 | 40.13% | 5,502 |
| Olmsted | 8,958 | 60.04% | 5,316 | 35.63% | 583 | 3.91% | 62 | 0.42% | 3,642 | 24.41% | 14,919 |
| Otter Tail | 8,642 | 47.72% | 8,899 | 49.14% | 438 | 2.42% | 131 | 0.72% | -257 | -1.42% | 18,110 |
| Pennington | 3,736 | 72.47% | 1,258 | 24.40% | 100 | 1.94% | 61 | 1.18% | 2,478 | 48.07% | 5,155 |
| Pine | 5,797 | 67.11% | 2,452 | 28.39% | 309 | 3.58% | 80 | 0.93% | 3,345 | 38.72% | 8,638 |
| Pipestone | 3,026 | 58.53% | 1,881 | 36.38% | 250 | 4.84% | 13 | 0.25% | 1,145 | 22.15% | 5,170 |
| Polk | 11,337 | 73.44% | 3,751 | 24.30% | 245 | 1.59% | 104 | 0.67% | 7,586 | 49.14% | 15,437 |
| Pope | 3,200 | 61.05% | 1,869 | 35.65% | 159 | 3.03% | 14 | 0.27% | 1,331 | 25.39% | 5,242 |
| Ramsey | 86,286 | 66.00% | 30,553 | 23.37% | 13,200 | 10.10% | 689 | 0.53% | 55,733 | 42.63% | 130,728 |
| Red Lake | 2,057 | 77.53% | 487 | 18.36% | 89 | 3.35% | 20 | 0.75% | 1,570 | 59.18% | 2,653 |
| Redwood | 4,965 | 55.34% | 3,286 | 36.63% | 691 | 7.70% | 30 | 0.33% | 1,679 | 18.71% | 8,972 |
| Renville | 5,344 | 56.53% | 3,049 | 32.25% | 1,021 | 10.80% | 39 | 0.41% | 2,295 | 24.28% | 9,453 |
| Rice | 5,928 | 48.09% | 4,888 | 39.65% | 1,473 | 11.95% | 38 | 0.31% | 1,040 | 8.44% | 12,327 |
| Rock | 2,910 | 60.15% | 1,752 | 36.21% | 163 | 3.37% | 13 | 0.27% | 1,158 | 23.94% | 4,838 |
| Roseau | 3,761 | 71.42% | 1,326 | 25.18% | 124 | 2.35% | 55 | 1.04% | 2,435 | 46.24% | 5,266 |
| Saint Louis | 69,365 | 74.18% | 22,332 | 23.88% | 709 | 0.76% | 1,104 | 1.18% | 47,033 | 50.30% | 93,510 |
| Scott | 3,861 | 58.87% | 1,528 | 23.30% | 1,153 | 17.58% | 17 | 0.26% | 2,333 | 35.57% | 6,559 |
| Sherburne | 1,881 | 50.33% | 1,623 | 43.43% | 223 | 5.97% | 10 | 0.27% | 258 | 6.90% | 3,737 |
| Sibley | 4,140 | 61.47% | 2,184 | 32.43% | 388 | 5.76% | 23 | 0.34% | 1,956 | 29.04% | 6,735 |
| Stearns | 12,760 | 56.51% | 5,262 | 23.30% | 4,485 | 19.86% | 73 | 0.32% | 7,498 | 33.21% | 22,580 |
| Steele | 4,481 | 54.49% | 3,373 | 41.01% | 362 | 4.40% | 8 | 0.10% | 1,108 | 13.47% | 8,224 |
| Stevens | 2,352 | 59.42% | 1,431 | 36.15% | 167 | 4.22% | 8 | 0.20% | 921 | 23.27% | 3,958 |
| Swift | 3,749 | 62.63% | 1,618 | 27.03% | 610 | 10.19% | 9 | 0.15% | 2,131 | 35.60% | 5,986 |
| Todd | 5,627 | 56.26% | 3,780 | 37.79% | 575 | 5.75% | 20 | 0.20% | 1,847 | 18.47% | 10,002 |
| Traverse | 2,297 | 73.06% | 761 | 24.20% | 82 | 2.61% | 4 | 0.13% | 1,536 | 48.85% | 3,144 |
| Wabasha | 4,122 | 53.55% | 2,663 | 34.60% | 893 | 11.60% | 19 | 0.25% | 1,459 | 18.96% | 7,697 |
| Wadena | 2,605 | 56.03% | 1,898 | 40.83% | 117 | 2.52% | 29 | 0.62% | 707 | 15.21% | 4,649 |
| Waseca | 3,520 | 55.45% | 2,482 | 39.10% | 330 | 5.20% | 16 | 0.25% | 1,038 | 16.35% | 6,348 |
| Washington | 6,768 | 57.80% | 3,863 | 32.99% | 1,030 | 8.80% | 49 | 0.42% | 2,905 | 24.81% | 11,710 |
| Watonwan | 3,668 | 63.55% | 1,930 | 33.44% | 160 | 2.77% | 14 | 0.24% | 1,738 | 30.11% | 5,772 |
| Wilkin | 2,428 | 61.66% | 1,278 | 32.45% | 220 | 5.59% | 12 | 0.30% | 1,150 | 29.20% | 3,938 |
| Winona | 9,268 | 59.60% | 5,353 | 34.42% | 850 | 5.47% | 80 | 0.51% | 3,915 | 25.18% | 15,551 |
| Wright | 5,363 | 47.25% | 4,087 | 36.01% | 1,842 | 16.23% | 59 | 0.52% | 1,276 | 11.24% | 11,351 |
| Yellow Medicine | 3,921 | 58.71% | 2,029 | 30.38% | 717 | 10.74% | 12 | 0.18% | 1,892 | 28.33% | 6,679 |
| Totals | 698,811 | 61.84% | 350,459 | 31.01% | 74,296 | 6.58% | 6,407 | 0.57% | 348,352 | 30.83% | 1,129,973 |
References
- Sullivan, Robert David; ‘How the Red and Blue Map Evolved Over the Past Century’; America Magazine in The National Catholic Review; June 29, 2016
- "1936 Presidential Election Results, 1936". Dave Leip's U.S. Election Atlas. Retrieved 2016-10-05.
- Géoelections; 1936 Presidential Election Popular Vote (.xlsx file for €15 on request)
- Scammon, Richard M. (compiler); America at the Polls: A Handbook of Presidential Election Statistics 1920-1964; pp. 234-235 ISBN 0405077114


