1936 United States presidential election in Oregon
The 1936 United States presidential election in Oregon took place on November 3, 1936, as part of the 1936 United States presidential election. Voters chose five[2] representatives, or electors, to the Electoral College, who voted for president and vice president.
| |||||||||||||||||||||||||||||||||
All 5 Oregon votes to the Electoral College | |||||||||||||||||||||||||||||||||
|---|---|---|---|---|---|---|---|---|---|---|---|---|---|---|---|---|---|---|---|---|---|---|---|---|---|---|---|---|---|---|---|---|---|
| |||||||||||||||||||||||||||||||||
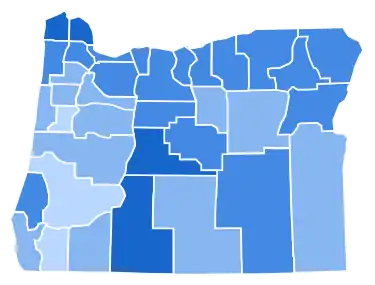 County Results
Roosevelt 40-50% 50-60% 60-70% 70-80%
| |||||||||||||||||||||||||||||||||
| |||||||||||||||||||||||||||||||||
| Elections in Oregon |
|---|
 |
Before the election, the primary focus was on power development in the water-rich and mountainous Pacific Northwest, especially the construction of major Federal dams[3] and whether power rates for all users should be uniform.[4] The Republican Party strongly supported private utilities, whilst Democrats generally supported at least some degree of public ownership and control of electric utilities.[5]
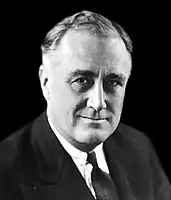
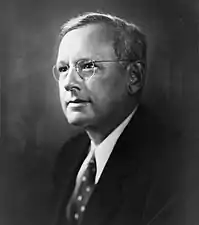
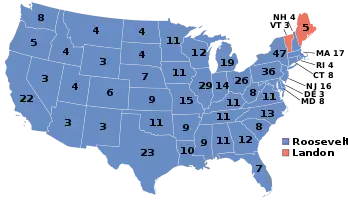
Oregon had been a virtually one-party Republican state outside a few Presidential and gubernatorial elections during the “System of 1896”; however, in 1932 under the influence of the Great Depression, Roosevelt had been the first Democrat since Horatio Seymour in 1868 to win a majority of the state's vote, although Woodrow Wilson won a plurality in 1912. In 1936, despite some popular reservations about public-owned power, the Beaver State was won in a landslide by incumbent President Franklin D. Roosevelt (D–New York), running with Vice President John Nance Garner, with 64.42% of the popular vote, against Governor Alf Landon (R–Kansas), running with Frank Knox, with 29.64% of the popular vote.[6][7]
FDR's 64.42% result is the best ever achieved by a Democrat in Oregon, and he remains the only Democrat to sweep all Oregon's counties in a presidential election. Additionally, the 1936 election remains the last in which a Democratic presidential candidate won Josephine County.[8]
Results
| Party | Candidate | Votes | % | |
|---|---|---|---|---|
| Democratic | Franklin D. Roosevelt (inc.) | 266,733 | 64.42% | |
| Republican | Alf Landon | 122,706 | 29.64% | |
| Independent | William Lemke | 21,831 | 5.27% | |
| Independent | Norman Thomas | 2,143 | 0.52% | |
| Independent | John W. Aiken | 504 | 0.12% | |
| Write-in | Earl Browder | 104 | 0.03% | |
| Write-in | D. Leigh Colvin | 4 | 0.00% | |
| Total votes | 414,021 | 100% | ||
Results by county
| County | Franklin Delano Roosevelt Democratic |
Alfred Mossman Landon Republican |
William Frederick Lemke[9] Independent |
Various candidates Other parties |
Margin | Total votes cast[10] | |||||
|---|---|---|---|---|---|---|---|---|---|---|---|
| # | % | # | % | # | % | # | % | # | % | ||
| Baker | 4,991 | 69.79% | 1,768 | 24.72% | 362 | 5.06% | 30 | 0.42% | 3,223 | 45.07% | 7,151 |
| Benton | 3,547 | 47.78% | 3,390 | 45.67% | 446 | 6.01% | 40 | 0.54% | 157 | 2.12% | 7,423 |
| Clackamas | 14,203 | 66.67% | 5,830 | 27.37% | 1,114 | 5.23% | 156 | 0.73% | 8,373 | 39.30% | 21,303 |
| Clatsop | 6,267 | 70.96% | 2,261 | 25.60% | 257 | 2.91% | 47 | 0.53% | 4,006 | 45.36% | 8,832 |
| Columbia | 5,587 | 71.62% | 1,815 | 23.27% | 356 | 4.56% | 43 | 0.55% | 3,772 | 48.35% | 7,801 |
| Coos | 7,167 | 67.42% | 2,576 | 24.23% | 834 | 7.85% | 53 | 0.50% | 4,591 | 43.19% | 10,630 |
| Crook | 1,086 | 61.99% | 589 | 33.62% | 71 | 4.05% | 6 | 0.34% | 497 | 28.37% | 1,752 |
| Curry | 913 | 54.35% | 497 | 29.58% | 247 | 14.70% | 23 | 1.37% | 416 | 24.76% | 1,680 |
| Deschutes | 4,278 | 72.71% | 1,299 | 22.08% | 257 | 4.37% | 50 | 0.85% | 2,979 | 50.63% | 5,884 |
| Douglas | 4,893 | 48.40% | 4,254 | 42.08% | 919 | 9.09% | 44 | 0.44% | 639 | 6.32% | 10,110 |
| Gilliam | 983 | 69.67% | 362 | 25.66% | 65 | 4.61% | 1 | 0.07% | 621 | 44.01% | 1,411 |
| Grant | 1,436 | 57.69% | 697 | 28.00% | 342 | 13.74% | 14 | 0.56% | 739 | 29.69% | 2,489 |
| Harney | 1,262 | 65.05% | 546 | 28.14% | 122 | 6.29% | 10 | 0.52% | 716 | 36.91% | 1,940 |
| Hood River | 2,759 | 65.77% | 1,249 | 29.77% | 155 | 3.69% | 32 | 0.76% | 1,510 | 36.00% | 4,195 |
| Jackson | 7,520 | 54.05% | 4,866 | 34.97% | 1,449 | 10.41% | 79 | 0.57% | 2,654 | 19.07% | 13,914 |
| Jefferson | 514 | 64.01% | 253 | 31.51% | 34 | 4.23% | 2 | 0.25% | 261 | 32.50% | 803 |
| Josephine | 2,840 | 47.69% | 1,992 | 33.45% | 1,067 | 17.92% | 56 | 0.94% | 848 | 14.24% | 5,955 |
| Klamath | 8,562 | 70.05% | 3,225 | 26.39% | 369 | 3.02% | 66 | 0.54% | 5,337 | 43.67% | 12,222 |
| Lake | 1,274 | 56.55% | 725 | 32.18% | 247 | 10.96% | 7 | 0.31% | 549 | 24.37% | 2,253 |
| Lane | 13,926 | 57.51% | 8,309 | 34.31% | 1,704 | 7.04% | 276 | 1.14% | 5,617 | 23.20% | 24,215 |
| Lincoln | 3,024 | 59.98% | 1,585 | 31.44% | 401 | 7.95% | 32 | 0.63% | 1,439 | 28.54% | 5,042 |
| Linn | 5,856 | 52.23% | 4,110 | 36.66% | 1,175 | 10.48% | 70 | 0.62% | 1,746 | 15.57% | 11,211 |
| Malheur | 2,630 | 59.64% | 1,385 | 31.41% | 365 | 8.28% | 30 | 0.68% | 1,245 | 28.23% | 4,410 |
| Marion | 15,536 | 59.59% | 8,595 | 32.97% | 1,710 | 6.56% | 230 | 0.88% | 6,941 | 26.62% | 26,071 |
| Morrow | 1,181 | 63.02% | 518 | 27.64% | 161 | 8.59% | 14 | 0.75% | 663 | 35.38% | 1,874 |
| Multnomah | 106,561 | 69.96% | 41,405 | 27.18% | 3,358 | 2.20% | 995 | 0.65% | 65,156 | 42.78% | 152,319 |
| Polk | 3,694 | 56.85% | 2,246 | 34.56% | 514 | 7.91% | 44 | 0.68% | 1,448 | 22.28% | 6,498 |
| Sherman | 823 | 67.85% | 337 | 27.78% | 50 | 4.12% | 3 | 0.25% | 486 | 40.07% | 1,213 |
| Tillamook | 2,781 | 60.68% | 1,380 | 30.11% | 399 | 8.71% | 23 | 0.50% | 1,401 | 30.57% | 4,583 |
| Umatilla | 5,753 | 61.13% | 2,943 | 31.27% | 676 | 7.18% | 39 | 0.41% | 2,810 | 29.86% | 9,411 |
| Union | 4,643 | 69.17% | 1,517 | 22.60% | 520 | 7.75% | 32 | 0.48% | 3,126 | 46.57% | 6,712 |
| Wallowa | 2,000 | 63.86% | 811 | 25.89% | 295 | 9.42% | 26 | 0.83% | 1,189 | 37.96% | 3,132 |
| Wasco | 3,573 | 68.92% | 1,278 | 24.65% | 318 | 6.13% | 15 | 0.29% | 2,295 | 44.27% | 5,184 |
| Washington | 8,641 | 63.48% | 4,148 | 30.47% | 721 | 5.30% | 102 | 0.75% | 4,493 | 33.01% | 13,612 |
| Wheeler | 663 | 55.71% | 502 | 42.18% | 22 | 1.85% | 3 | 0.25% | 161 | 13.53% | 1,190 |
| Yamhill | 5,366 | 55.92% | 3,443 | 35.88% | 729 | 7.60% | 58 | 0.60% | 1,923 | 20.04% | 9,596 |
| Totals | 266,733 | 64.55% | 122,706 | 29.69% | 21,102 | 5.11% | 2,693 | 0.65% | 144,027 | 34.85% | 413,234 |
References
- "United States Presidential election of 1936 - Encyclopædia Britannica". Retrieved December 25, 2018.
- "1936 Election for the Thirty-eighth Term (1937-41)". Retrieved December 25, 2018.
- Tollefson, Gene; BPA and the Struggle for Power at Cost, p. 185 Published 1987 by Bonneville Power Association
- Tollefson; BPA and the Struggle for Power at Cost, p. 127
- Blumm, Michael C.; ‘The Northwest's Hydroelectric Heritage: Prologue to the Pacific Northwest Electric Power Planning and Conservation Act’; Washington Law Review, volume 58|Issue 2 (April 1, 1983)
- "1936 Presidential General Election Results - Oregon". Retrieved December 25, 2018.
- "The American Presidency Project - Election of 1936". Retrieved December 25, 2018.
- Sullivan, Robert David; ‘How the Red and Blue Map Evolved Over the Past Century’; America Magazine in The National Catholic Review; June 29, 2016
- Géoelections; 1936 Presidential Election Popular Vote (.xlsx file for €15)
- Scammon, Richard M. (compiler); America at the Polls: A Handbook of Presidential Election Statistics 1920-1964; p. 372 ISBN 0405077114
