1936 United States presidential election in New Mexico
The 1936 United States presidential election in New Mexico took place on November 3, 1936. All contemporary forty-eight states were part of the 1936 United States presidential election. State voters chose three electors to represent them in the Electoral College, which voted for President and Vice President.
| ||||||||||||||||||||||||||
| ||||||||||||||||||||||||||
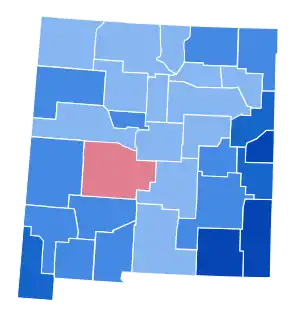 County Results
| ||||||||||||||||||||||||||
| Elections in New Mexico |
|---|
 |
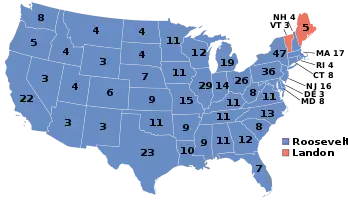
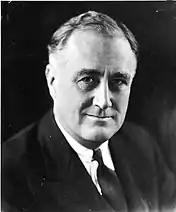
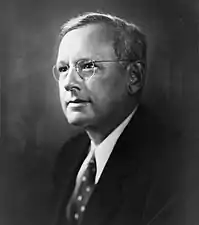
New Mexico was won by incumbent President Franklin D. Roosevelt in a 26-point landslide against Kansas Governor Alf Landon. Roosevelt won every county in the state bar Socorro County:[1] this is the last time a Democrat has ever carried Lincoln County, which is easily the longest run of voting Republican of any New Mexico county.[2]
Union Party candidate William Lemke made a small splash in New Mexico and elsewhere in the United States, winning 924 votes, 0.5 percent of the state’s total, substantially less than he won in many other states like Rhode Island, Oregon and his home state of North Dakota.[3]
Results
| Presidential candidate | Party | Home state | Popular vote | Electoral vote |
Running mate | |||
|---|---|---|---|---|---|---|---|---|
| Count | Percentage | Vice-presidential candidate | Home state | Electoral vote | ||||
| Franklin D. Roosevelt | Democratic | New York | 106,037 | 62.69% | 3 | John Nance Garner | Texas | 3 |
| Alf Landon | Republican | Kansas | 61,727 | 36.50% | 0 | Frank Knox | Illinois | 0 |
| William Lemke | Union | North Dakota | 924 | 0.55% | 0 | Thomas C. O'Brien | Massachusetts | 0 |
| Norman Thomas | Socialist | New York | 343 | 0.20% | 0 | George A. Nelson | Wisconsin | 0 |
| D. Leigh Colvin | Prohibition | New York | 62 | 0.04% | 0 | Claude A. Watson | California | 0 |
| Earl Browder | Communist | Kansas | 43 | 0.03% | 0 | James W. Ford | New York | 0 |
| Total | 169,176 | 100% | 3 | 3 | ||||
| Needed to win | 266 | 266 | ||||||
Results by county
| County | Franklin Delano Roosevelt[4] Democratic |
Alfred Mossman Landon[4] Republican |
William Frederick Lemke[5] Union |
Various candidates Other parties |
Margin | |||||
|---|---|---|---|---|---|---|---|---|---|---|
| % | # | % | # | % | # | % | # | % | # | |
| Lea | 86.95% | 3,905 | 12.22% | 549 | 0.40% | 18 | 0.42% | 19 | 74.73% | 3,356 |
| Curry | 80.89% | 4,689 | 17.65% | 1,023 | 0.64% | 37 | 0.83% | 48 | 63.24% | 3,666 |
| Eddy | 80.17% | 4,349 | 18.93% | 1,027 | 0.53% | 29 | 0.37% | 20 | 61.24% | 3,322 |
| Quay | 79.79% | 3,423 | 19.02% | 816 | 0.89% | 38 | 0.30% | 13 | 60.77% | 2,607 |
| Roosevelt | 76.55% | 2,951 | 17.56% | 677 | 5.01% | 193 | 0.88% | 34 | 58.99% | 2,274 |
| Hidalgo | 76.42% | 1,115 | 22.34% | 326 | 0.89% | 13 | 0.34% | 5 | 54.08% | 789 |
| De Baca | 69.18% | 1,010 | 30.41% | 444 | 0.07% | 1 | 0.34% | 5 | 38.77% | 566 |
| Doña Ana | 68.43% | 5,544 | 30.78% | 2,494 | 0.51% | 41 | 0.28% | 23 | 37.65% | 3,050 |
| Grant | 67.88% | 3,215 | 31.02% | 1,469 | 0.80% | 38 | 0.30% | 14 | 36.86% | 1,746 |
| Bernalillo | 67.78% | 15,305 | 31.47% | 7,107 | 0.47% | 106 | 0.28% | 64 | 36.31% | 8,198 |
| Luna | 63.37% | 1,500 | 34.05% | 806 | 2.20% | 52 | 0.38% | 9 | 29.32% | 694 |
| Catron | 64.08% | 1,456 | 35.12% | 798 | 0.40% | 9 | 0.40% | 9 | 28.96% | 658 |
| McKinley | 64.05% | 2,526 | 35.60% | 1,404 | 0.13% | 5 | 0.23% | 9 | 28.45% | 1,122 |
| Chaves | 62.62% | 4,394 | 35.70% | 2,505 | 1.20% | 84 | 0.48% | 34 | 26.92% | 1,889 |
| Colfax | 62.56% | 4,661 | 36.84% | 2,745 | 0.43% | 32 | 0.17% | 13 | 25.72% | 1,916 |
| Sierra | 61.94% | 1,587 | 37.12% | 951 | 0.62% | 16 | 0.31% | 8 | 24.82% | 636 |
| Union | 61.05% | 2,605 | 38.08% | 1,625 | 0.68% | 29 | 0.19% | 8 | 22.97% | 980 |
| Otero | 59.28% | 1,989 | 39.73% | 1,333 | 0.69% | 23 | 0.30% | 10 | 19.55% | 656 |
| Harding | 58.83% | 1,276 | 40.94% | 888 | 0.00% | 0 | 0.23% | 5 | 17.89% | 388 |
| San Miguel | 56.84% | 6,199 | 43.07% | 4,697 | 0.05% | 5 | 0.05% | 5 | 13.77% | 1,502 |
| Lincoln | 55.51% | 2,021 | 43.37% | 1,579 | 0.82% | 30 | 0.30% | 11 | 12.14% | 442 |
| Torrance | 55.50% | 2,346 | 43.60% | 1,843 | 0.64% | 27 | 0.26% | 11 | 11.90% | 503 |
| Santa Fe | 55.20% | 6,145 | 44.56% | 4,960 | 0.11% | 12 | 0.13% | 15 | 10.64% | 1,185 |
| Guadalupe | 55.14% | 2,187 | 44.76% | 1,775 | 0.08% | 3 | 0.03% | 1 | 10.38% | 412 |
| Sandoval | 53.72% | 2,094 | 46.18% | 1,800 | 0.05% | 2 | 0.05% | 2 | 7.54% | 294 |
| Rio Arriba | 53.29% | 4,691 | 46.50% | 4,093 | 0.12% | 11 | 0.08% | 7 | 6.79% | 598 |
| San Juan | 51.97% | 1,530 | 45.69% | 1,345 | 1.63% | 48 | 0.71% | 21 | 6.28% | 185 |
| Valencia | 53.03% | 3,336 | 46.75% | 2,941 | 0.06% | 4 | 0.16% | 10 | 6.28% | 395 |
| Mora | 52.06% | 2,460 | 47.81% | 2,259 | 0.08% | 4 | 0.04% | 2 | 4.25% | 201 |
| Taos | 51.03% | 3,051 | 48.80% | 2,918 | 0.12% | 7 | 0.05% | 3 | 2.23% | 133 |
| Socorro | 49.31% | 2,477 | 50.37% | 2,530 | 0.14% | 7 | 0.18% | 9 | -1.06% | -53 |
References
- The Political Graveyard: New Mexico counties: plurality winners, 1936
- Sullivan, Robert David; ‘How the Red and Blue Map Evolved Over the Past Century’; America Magazine in The National Catholic Review; June 29, 2016
- "Presidential Election of 1936". Presidential Elections. Retrieved 2016-12-10.
- Scammon, Richard M. (compiler); America at the Polls: A Handbook of Presidential Election Statistics 1920-1964; p. 307 ISBN 0405077114
- Géoelections; 1936 Presidential Election Popular Vote (.xlsx file for €15 on request)