Carroll County, New Hampshire
Carroll County is a county in the U.S. state of New Hampshire. As of the 2010 census, the population was 47,818,[1] making it the third-least populous county in New Hampshire. Its county seat is Ossipee.[2] The county was created in 1840 and organized at Ossipee from towns removed from Strafford County. It was named in honor of Charles Carroll of Carrollton,[3] who had died in 1832, the last surviving signer of the United States Declaration of Independence.
Carroll County | |
|---|---|
 | |
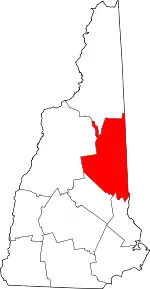 Location within the U.S. state of New Hampshire | |
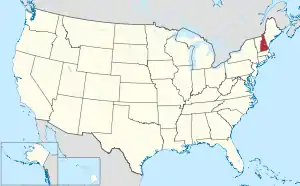 New Hampshire's location within the U.S. | |
| Coordinates: 43°49′21″N 71°10′54″W | |
| Country | |
| State | |
| Founded | 1840 |
| Named for | Charles Carroll of Carrollton |
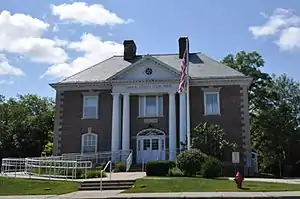
| Seat | Ossipee |
| Largest town | Conway |
| Area | |
| • Total | 993.5 sq mi (2,573 km2) |
| • Land | 931.9 sq mi (2,414 km2) |
| • Water | 61.6 sq mi (160 km2) 6.2% |
| Population (2010) | |
| • Total | 47,818 |
| • Estimate (2019) | 48,910 |
| • Density | 52.3/sq mi (20.2/km2) |
| Time zone | UTC−5 (Eastern) |
| • Summer (DST) | UTC−4 (EDT) |
| Congressional district | 1st |
| Website | www |
Geography
According to the U.S. Census Bureau, the county has a total area of 992 square miles (2,570 km2), of which 931 square miles (2,410 km2) is land and 61 square miles (160 km2) (6.2%) is water.[4] It is the third-largest county in New Hampshire by total area. Northern Carroll County is known for being mountainous. Several ski areas, including Cranmore Mountain, Attitash, King Pine, and Black Mountain, are located here.
Adjacent counties
- Coos County (north)
- Oxford County, Maine (northeast)
- York County, Maine (southeast)
- Strafford County (south)
- Belknap County (southwest)
- Grafton County (west)
National protected area
Demographics
| Historical population | |||
|---|---|---|---|
| Census | Pop. | %± | |
| 1850 | 20,157 | — | |
| 1860 | 20,465 | 1.5% | |
| 1870 | 17,332 | −15.3% | |
| 1880 | 18,224 | 5.1% | |
| 1890 | 18,124 | −0.5% | |
| 1900 | 16,895 | −6.8% | |
| 1910 | 16,316 | −3.4% | |
| 1920 | 15,017 | −8.0% | |
| 1930 | 14,277 | −4.9% | |
| 1940 | 15,589 | 9.2% | |
| 1950 | 15,868 | 1.8% | |
| 1960 | 15,829 | −0.2% | |
| 1970 | 18,548 | 17.2% | |
| 1980 | 27,931 | 50.6% | |
| 1990 | 35,410 | 26.8% | |
| 2000 | 43,666 | 23.3% | |
| 2010 | 47,818 | 9.5% | |
| 2019 (est.) | 48,910 | [5] | 2.3% |
| U.S. Decennial Census[6] 1790-1960[7] 1900-1990[8] 1990-2000[9] 2010-2018[1] | |||
2000 census
As of the census[10] of 2000, there were 43,666 people, 18,351 households, and 12,313 families living in the county. The population density was 18/km2 (47/sq mi). There were 34,750 housing units at an average density of 14/km2 (37/sq mi). The racial makeup of the county was 98.22% White, 0.17% Black or African American, 0.28% Native American, 0.38% Asian, 0.01% Pacific Islander, 0.17% from other races, and 0.77% from two or more races. 0.48% of the population were Hispanic or Latino of any race. 22.5% were of English, 15.6% Irish, 10.5% American, 9.7% French, 6.7% German, 5.8% Italian and 5.2% Scottish ancestry. 96.5% spoke English and 1.6% French as their first language.
There were 18,351 households, out of which 27.40% had children under the age of 18 living with them, 55.30% were married couples living together, 7.80% had a female householder with no husband present, and 32.90% were non-families. 26.60% of all households were made up of individuals, and 11.10% had someone living alone who was 65 years of age or older. The average household size was 2.35 and the average family size was 2.82.
In the county, the population was spread out, with 22.60% under the age of 18, 5.30% from 18 to 24, 26.50% from 25 to 44, 27.70% from 45 to 64, and 17.80% who were 65 years of age or older. The median age was 42 years. For every 100 females there were 96.60 males. For every 100 females age 18 and over, there were 94.20 males.
The median income for a household in the county was $39,990, and the median income for a family was $46,922. Males had a median income of $31,811 versus $23,922 for females. The per capita income for the county was $21,931. About 5.50% of families and 7.90% of the population were below the poverty line, including 10.00% of those under age 18 and 6.70% of those age 65 or over.
2010 census
As of the 2010 United States Census, there were 47,818 people, 21,052 households, and 13,569 families living in the county.[11] The population density was 51.4 inhabitants per square mile (19.8/km2). There were 39,813 housing units at an average density of 42.8 per square mile (16.5/km2).[12] The racial makeup of the county was 97.5% white, 0.6% Asian, 0.3% American Indian, 0.3% black or African American, 0.2% from other races, and 1.1% from two or more races. Those of Hispanic or Latino origin made up 1.0% of the population.[11] In terms of ancestry,[13]
The largest ancestry group in Carroll County are people of English ancestry, who make up 29.3% of people in the county. The second largest ancestry group in the county are people of Irish ancestry who make up 24.7%. The third largest group is people of French ancestry who make up 13.8% of people in the county.[14]
Of the 21,052 households, 24.2% had children under the age of 18 living with them, 52.2% were married couples living together, 8.1% had a female householder with no husband present, 35.5% were non-families, and 28.4% of all households were made up of individuals. The average household size was 2.25 and the average family size was 2.72. The median age was 48.3 years.[11]
The median income for a household in the county was $49,897 and the median income for a family was $60,086. Males had a median income of $41,634 versus $32,402 for females. The per capita income for the county was $28,411. About 6.1% of families and 9.6% of the population were below the poverty line, including 14.6% of those under age 18 and 5.5% of those age 65 or over.[15]
Politics and government
The county is historically Republican, but in 2008 Barack Obama received 52.39% of the county's vote.[16] This made him the first Democratic presidential nominee to win the county since 1912 and the first Democratic presidential nominee to win an absolute majority in the county since 1884. Joe Biden later repeated this feat in 2020. However, despite the recent Democratic trend, the county has not voted more Democratic than the nation since 1888 in terms of two-party vote.
The county is politically divided between the more conservative southern half, home to several seasonal communities along the north shore of Lake Winnipesaukee including Moultonborough, Tuftonboro, and Wolfeboro, and the more liberal northern half, with several ski towns and resort towns such as Bartlett and Conway. In both the 2012 Presidential and gubernatorial elections in New Hampshire, Democratic candidates easily won the northern half of the county, and Republican candidates easily won the southern half of the county.[17]
Carroll County is one of only twelve counties to have voted for Obama in 2008, Romney in 2012, Trump in 2016, and Biden in 2020, a pattern that was particularly evident elsewhere in the Mountain West.[lower-alpha 1]
| Year | Republican | Democratic | Third parties |
|---|---|---|---|
| 2020 | 48.5% 16,150 | 50.0% 16,649 | 1.5% 498 |
| 2016 | 49.4% 14,635 | 43.9% 12,987 | 6.7% 1,994 |
| 2012 | 49.7% 14,207 | 48.9% 13,977 | 1.5% 418 |
| 2008 | 46.1% 13,387 | 52.4% 15,221 | 1.5% 448 |
| 2004 | 51.8% 14,614 | 47.2% 13,319 | 1.0% 289 |
| 2000 | 52.8% 12,597 | 41.3% 9,852 | 6.0% 1,430 |
| 1996 | 44.2% 9,168 | 42.8% 8,881 | 13.1% 2,714 |
| 1992 | 40.2% 8,715 | 33.4% 7,258 | 26.4% 5,730 |
| 1988 | 70.8% 12,983 | 28.1% 5,153 | 1.1% 208 |
| 1984 | 75.4% 11,891 | 24.1% 3,806 | 0.4% 67 |
| 1980 | 67.3% 9,980 | 21.0% 3,119 | 11.7% 1,742 |
| 1976 | 70.2% 8,561 | 27.7% 3,374 | 2.2% 263 |
| 1972 | 77.0% 8,525 | 21.6% 2,395 | 1.4% 150 |
| 1968 | 72.9% 6,795 | 23.2% 2,163 | 3.9% 359 |
| 1964 | 55.0% 4,957 | 45.0% 4,058 | |
| 1960 | 79.6% 7,487 | 20.4% 1,918 | |
| 1956 | 85.4% 7,527 | 14.5% 1,281 | 0.1% 8 |
| 1952 | 82.6% 7,498 | 17.4% 1,578 | |
| 1948 | 76.1% 6,127 | 23.2% 1,869 | 0.7% 54 |
| 1944 | 68.1% 5,251 | 31.9% 2,461 | 0.0% 1 |
| 1940 | 66.3% 5,656 | 33.7% 2,870 | |
| 1936 | 66.3% 5,521 | 33.3% 2,769 | 0.4% 35 |
| 1932 | 64.6% 5,269 | 35.2% 2,873 | 0.2% 19 |
| 1928 | 77.4% 5,509 | 22.4% 1,592 | 0.2% 16 |
| 1924 | 65.4% 4,372 | 33.1% 2,213 | 1.5% 100 |
| 1920 | 64.7% 4,214 | 35.0% 2,279 | 0.3% 17 |
| 1916 | 52.6% 2,259 | 46.7% 2,003 | 0.8% 32 |
| 1912 | 34.5% 1,454 | 43.1% 1,820 | 22.4% 947 |
| 1908 | 60.7% 2,562 | 37.7% 1,591 | 1.5% 65 |
| 1904 | 59.8% 2,594 | 38.8% 1,683 | 1.4% 62 |
| 1900 | 57.3% 2,626 | 40.5% 1,859 | 2.2% 101 |
| 1896 | 65.9% 2,800 | 28.6% 1,214 | 5.6% 236 |
| 1892 | 48.8% 2,253 | 49.1% 2,267 | 2.1% 95 |
| 1888 | 47.4% 2,338 | 49.3% 2,434 | 3.3% 162 |
| 1884 | 47.0% 2,286 | 50.2% 2,443 | 2.9% 140 |
| 1880 | 47.5% 2,426 | 51.6% 2,639 | 0.9% 47 |
| 1876 | 44.9% 2,016 | 55.1% 2,474 | 0.1% 3 |
County Commission
The executive power of Carroll County's government is held by three county commissioners, each representing one of the three commissioner districts within the county.[19]
| Districts | Name | Hometown | Party |
|---|---|---|---|
| District 1 | Terry McCarthy (Clerk) | Conway, NH | Republican |
| District 2 | David Babson (Vice Chair) | Ossipee, NH | Republican |
| District 3 | Amanda Bevard (Chair) | Wolfeboro, NH | Republican |
In addition to the County Commission, there are five directly elected officials: they include County Attorney, Register of Deeds, County Sheriff, Register of Probate, and County Treasurer.[20]
| Office | Name |
|---|---|
| County Attorney | Michaela Andruzzi (D) |
| Register of Deeds | Lisa Scott (R) |
| County Sheriff | Domenic Richardi (R) |
| County Treasurer | Meg Lavender (R) |
Legislative branch
The legislative branch of Carroll County is made up of all of the members of the New Hampshire House of Representatives from the county. In total, as of August 2018 there are 15 members from 8 different districts.
| Affiliation | Members | Voting share | |
|---|---|---|---|
| Democratic Party | 8 | 53.3% | |
| Republican Party | 7 | 46.7% | |
| Total | 15 | 100% | |
Communities
Towns
Township
Census-designated places
Notes
- The other eleven are Butte County, California; Teton County, Idaho; Kendall County, Illinois; McLean County, Illinois; Tippecanoe County, Indiana; Kent County, Michigan; Leelanau County, Michigan; Rockingham County, New Hampshire; Marion County, Oregon; Grand County, Utah; and Albany County, Wyoming.
References
- "State & County QuickFacts". United States Census Bureau. Archived from the original on February 22, 2016. Retrieved September 24, 2013.
- "Find a County". National Association of Counties. Archived from the original on May 31, 2011. Retrieved June 7, 2011.
- Gannett, Henry (1905). The Origin of Certain Place Names in the United States. Govt. Print. Off. pp. 70.
- "2010 Census Gazetteer Files". United States Census Bureau. August 22, 2012. Archived from the original on 2014-12-27. Retrieved December 27, 2014.
- "Population and Housing Unit Estimates". Retrieved May 16, 2019.
- "U.S. Decennial Census". United States Census Bureau. Retrieved December 27, 2014.
- "Historical Census Browser". University of Virginia Library. Retrieved December 27, 2014.
- "Population of Counties by Decennial Census: 1900 to 1990". United States Census Bureau. Retrieved December 27, 2014.
- "Census 2000 PHC-T-4. Ranking Tables for Counties: 1990 and 2000" (PDF). United States Census Bureau. Retrieved December 27, 2014.
- "U.S. Census website". United States Census Bureau. Retrieved January 31, 2008.
- "DP-1 Profile of General Population and Housing Characteristics: 2010 Demographic Profile Data". United States Census Bureau. Archived from the original on 2020-02-13. Retrieved 2016-01-12.
- "Population, Housing Units, Area, and Density: 2010 - County". United States Census Bureau. Archived from the original on 2020-02-13. Retrieved 2016-01-12.
- "DP02 SELECTED SOCIAL CHARACTERISTICS IN THE UNITED STATES – 2006-2010 American Community Survey 5-Year Estimates". United States Census Bureau. Archived from the original on 2020-02-13. Retrieved 2016-01-12.
- "U.S. Census website". United States Census Bureau. Retrieved 2010-10-17.
- "DP03 SELECTED ECONOMIC CHARACTERISTICS – 2006-2010 American Community Survey 5-Year Estimates". United States Census Bureau. Archived from the original on 2020-02-13. Retrieved 2016-01-12.
- "David Leip's Presidential Election Database". uselectionatlas.org. Retrieved 10 April 2018.
- "President of the United States - 2012 General Election - NHSOS". sos.nh.gov. Retrieved 10 April 2018.
- Leip, David. "Dave Leip's Atlas of U.S. Presidential Elections". uselectionatlas.org. Retrieved 10 April 2018.
- http://sos.nh.gov/2016CountyGen.aspx?id=8589963680
- https://www.carrollcountynh.net/departments
External links
| Wikimedia Commons has media related to Carroll County, New Hampshire. |
- Carroll County official website
- National Register of Historic Places listing for Carroll Co., New Hampshire
Places adjacent to Carroll County, New Hampshire | ||||||||||
|---|---|---|---|---|---|---|---|---|---|---|
| ||||||||||
Municipalities and communities of Carroll County, New Hampshire, United States | ||
|---|---|---|
| Towns | Map of New Hampshire highlighting Carroll County | |
| Township | ||
| CDPs | ||
| Other villages | ||
| ||
| Authority control |
|---|