1968 United States presidential election in South Carolina
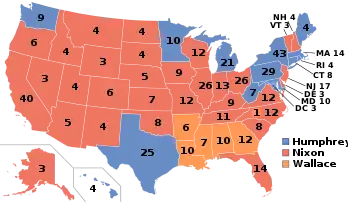
The 1968 United States presidential election in South Carolina took place on November 5, 1968. All 50 states and the District of Columbia were part of the 1968 United States presidential election. South Carolina voters chose 8 electors to the Electoral College, who voted for president and vice president.
| |||||||||||||||||||||||||||||||||
| |||||||||||||||||||||||||||||||||
 County Results
| |||||||||||||||||||||||||||||||||
| |||||||||||||||||||||||||||||||||
| Elections in South Carolina |
|---|
 |
Background
For six decades up to 1950 South Carolina was a one-party state dominated by the Democratic Party. The Republican Party had been moribund due to the disfranchisement of blacks and the complete absence of other support bases as the Palmetto State completely lacked upland or German refugee whites opposed to secession.[1] Between 1900 and 1948, no Republican presidential candidate ever obtained more than seven percent of the total presidential vote[2] – a vote which in 1924 reached as low as 6.6 percent of the total voting-age population[3] (or approximately 15 percent of the voting-age white population).
Following Harry S. Truman’s To Secure These Rights in 1947, the following year South Carolina’s small electorate overwhelmingly rejected him in favour of state Governor Strom Thurmond, who won 71 percent of the state’s limited electorate and every county except poor white industrial Anderson and Spartanburg.[4] During the 1950s, the state’s wealthier and more urbanized whites became extremely disenchanted with the national Democratic Party and to a lesser extent with the federal administration of Republican Dwight D. Eisenhower.[5] However, aided by the state’s abolition of its poll tax in 1950, the poor white upcountry provided enough support to national Democrats Adlai Stevenson II and John F. Kennedy to, aided by substantial majorities amongst the small but increasing number of blacks able to vote, keep the state in Democratic hands.
During the 1950s, wealthy textile mill owners in the upcountry developed a grassroots state Republican Party dedicated to the tenets of the John Birch Society. This group nominated the most conservative delegation at the party’s 1960 convention.[6] These wealthy businessmen would merge with hardline segregationists to draft Barry Goldwater for the Republican nomination in 1960 and join forces therein by 1964, when Thurmond, now a US Senator, switched his registration from Democratic to Republican to support Goldwater in his presidential campaign.[6] By sweeping the lowcountry and reducing Democratic majorities in the upcountry, Goldwater won the state by almost eighteen percent, whilst Thurmond was joined in his switch to the Republican Party by Congressman
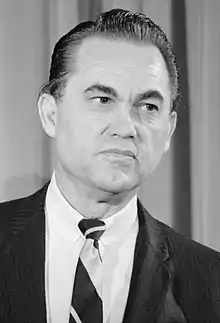
The Voting Rights Act of 1965 severely angered those poor whites who had remained loyal to the national Democratic Party. Their generally extreme social conservatism and hostility towards opportunities for blacks led poor white Deep Southerners to former Alabama Governor George Wallace who had attracted national attention for his support of segregation in his first term and entered Democratic Party primaries in 1964 with substantial success even in northern states.[7] Wallace would develop a powerful third-party presidential campaign after he left the governor’s office in 1967 amidst a sweeping rejection of the Democratic Party, and it was clear that discontent with racial liberalization was universal across white America.[8]
Vote
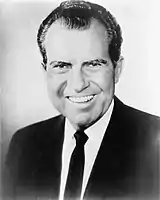
Although Nixon ignored the other Deep South states because he knew that he had no chance of competing with George Wallace, in South Carolina Senator Thurmond, believing Wallace could not win the election and that northeastern urban liberalism would continue to dominate if he endorsed Wallace, took the stump for Nixon in the Palmetto State.[9] The result was that Wallace support in South Carolina plumetted rapidly, although in early September the Alabama governor predicted he would carry the state,[10] an opinion backed up by early polling in mid-September.[11] Other polls, however, had the race very close between the three candidates.[12]
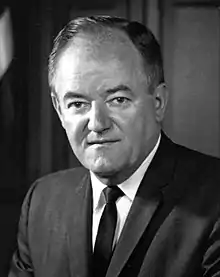
Nixon himself campaigned in the state, aided by Thurmond, at the end of September.[13] Polls remained close between the three candidates throughout October, but Nixon ultimately carried the state over Wallace by 5.79 percent, with Humphrey forced into third place. Extremely clear demographic and racial divides existed between the three candidates: Nixon carried wealthier whites, Wallace the poor whites, and Humphrey the newly enfranchised blacks, with Thurmond’s support helping Nixon to gain critical white landowner backing in the lowcountry.
Results
| 1968 United States presidential election in South Carolina[14][15] | |||||
|---|---|---|---|---|---|
| Party | Candidate | Votes | Percentage | Electoral votes | |
| Republican | Richard Nixon | 254,062 | 38.09% | 8 | |
| Independent | George Wallace | 215,430 | 32.30% | 0 | |
| Democratic | Hubert Humphrey | 197,486 | 29.61% | 0 | |
| Write-ins | Various candidates | 4 | 0.00% | 0 | |
| Totals | 666,978 | 100.00% | 8 | ||
| Voter turnout | - | ||||
Results by county
| County | Richard Milhous Nixon Republican |
Hubert Horatio Humphrey Democratic |
George Corley Wallace Independent |
Margin[lower-alpha 2] | Total votes cast | ||||
|---|---|---|---|---|---|---|---|---|---|
| # | % | # | % | # | % | # | % | ||
| Abbeville | 1,213 | 20.77% | 1,425 | 24.40% | 3,201 | 54.82% | -1,776[lower-alpha 3] | -30.42% | 5,839 |
| Aiken | 12,264 | 44.76% | 6,319 | 23.06% | 8,815 | 32.17% | 3,449 | 12.59% | 27,398 |
| Allendale | 997 | 29.72% | 1,538 | 45.84% | 820 | 24.44% | -541[lower-alpha 4] | -16.12% | 3,355 |
| Anderson | 5,661 | 24.33% | 5,218 | 22.43% | 12,384 | 53.23% | -6,723 | -28.90% | 23,263 |
| Bamberg | 1,327 | 27.70% | 1,845 | 38.52% | 1,618 | 33.78% | 227[lower-alpha 3] | 4.74% | 4,790 |
| Barnwell | 1,849 | 31.25% | 1,716 | 29.01% | 2,351 | 39.74% | -502 | -8.49% | 5,916 |
| Beaufort | 2,983 | 36.29% | 3,740 | 45.49% | 1,498 | 18.22% | -757[lower-alpha 4] | -9.20% | 8,221 |
| Berkeley | 4,021 | 28.89% | 5,089 | 36.56% | 4,808 | 34.55% | 281[lower-alpha 3] | 2.01% | 13,918 |
| Calhoun | 885 | 28.74% | 1,216 | 39.49% | 978 | 31.76% | 238[lower-alpha 3] | 7.73% | 3,079 |
| Charleston | 24,282 | 43.45% | 18,343 | 32.83% | 13,255 | 23.72% | 5,939[lower-alpha 4] | 10.62% | 55,880 |
| Cherokee | 2,853 | 27.19% | 1,998 | 19.04% | 5,642 | 53.77% | -2,789 | -26.58% | 10,493 |
| Chester | 2,862 | 33.71% | 2,865 | 33.75% | 2,762 | 32.54% | -3[lower-alpha 4] | -0.04% | 8,489 |
| Chesterfield | 2,564 | 25.47% | 3,180 | 31.59% | 4,324 | 42.95% | -1,144[lower-alpha 3] | -11.36% | 10,068 |
| Clarendon | 2,201 | 27.85% | 3,606 | 45.62% | 2,097 | 26.53% | -1,405[lower-alpha 4] | -17.77% | 7,904 |
| Colleton | 2,824 | 34.67% | 2,651 | 32.55% | 2,670 | 32.78% | 154 | 1.89% | 8,145 |
| Darlington | 4,947 | 35.38% | 3,803 | 27.20% | 5,231 | 37.42% | -284 | -2.04% | 13,981 |
| Dillon | 2,396 | 35.73% | 2,178 | 32.48% | 2,132 | 31.79% | 218[lower-alpha 4] | 3.25% | 6,706 |
| Dorchester | 3,354 | 31.21% | 3,855 | 35.87% | 3,539 | 32.93% | 316[lower-alpha 3] | 2.94% | 10,748 |
| Edgefield | 1,688 | 43.07% | 1,225 | 31.26% | 1,006 | 25.67% | 463[lower-alpha 4] | 11.81% | 3,919 |
| Fairfield | 1,619 | 27.14% | 3,011 | 50.47% | 1,336 | 22.39% | -1,392[lower-alpha 4] | -23.33% | 5,966 |
| Florence | 8,917 | 36.19% | 8,079 | 32.79% | 7,642 | 31.02% | 838[lower-alpha 4] | 3.40% | 24,638 |
| Georgetown | 3,269 | 32.62% | 4,110 | 41.01% | 2,642 | 26.36% | -841[lower-alpha 4] | -8.39% | 10,021 |
| Greenville | 31,652 | 52.91% | 12,928 | 21.61% | 15,241 | 25.48% | 16,411 | 27.43% | 59,821 |
| Greenwood | 4,891 | 33.37% | 3,741 | 25.52% | 6,024 | 41.10% | -1,133 | -7.73% | 14,658[lower-alpha 5] |
| Hampton | 1,671 | 31.95% | 2,107 | 40.29% | 1,452 | 27.76% | -436[lower-alpha 4] | -8.34% | 5,230 |
| Horry | 3,924 | 26.97% | 3,924 | 26.97% | 6,701 | 46.06% | -2,777 | -19.09% | 14,549 |
| Jasper | 633 | 20.31% | 1,402 | 44.99% | 1,081 | 34.69% | 321[lower-alpha 3] | 10.30% | 3,116 |
| Kershaw | 4,079 | 38.56% | 2,539 | 24.00% | 3,960 | 37.44% | 119 | 1.12% | 10,578 |
| Lancaster | 4,874 | 37.75% | 3,151 | 24.41% | 4,886 | 37.84% | -12 | -0.09% | 12,911 |
| Laurens | 4,813 | 39.75% | 3,016 | 24.91% | 4,279 | 35.34% | 534 | 4.41% | 12,108 |
| Lee | 1,219 | 22.23% | 2,151 | 39.23% | 2,113 | 38.54% | 38[lower-alpha 3] | 0.69% | 5,483 |
| Lexington | 12,204 | 48.49% | 4,058 | 16.12% | 8,907 | 35.39% | 3,297 | 13.10% | 25,169 |
| Marion | 2,512 | 36.85% | 2,821 | 41.38% | 1,484 | 21.77% | -309[lower-alpha 4] | -4.53% | 6,817 |
| Marlboro | 2,024 | 31.34% | 2,294 | 35.52% | 2,140 | 33.14% | 154[lower-alpha 3] | 2.38% | 6,458 |
| McCormick | 466 | 21.08% | 988 | 44.69% | 757 | 34.24% | 231[lower-alpha 3] | 10.45% | 2,211 |
| Newberry | 4,538 | 42.35% | 2,444 | 22.81% | 3,734 | 34.85% | 804 | 7.50% | 10,716 |
| Oconee | 2,618 | 27.94% | 2,009 | 21.44% | 4,742 | 50.61% | -2,124 | -22.67% | 9,369 |
| Orangeburg | 5,144 | 24.20% | 8,971 | 42.20% | 7,144 | 33.60% | 1,827[lower-alpha 3] | 8.60% | 21,259 |
| Pickens | 6,873 | 51.63% | 2,016 | 15.14% | 4,424 | 33.23% | 2,449 | 18.40% | 13,313 |
| Richland | 26,215 | 50.96% | 18,198 | 35.37% | 7,030 | 13.67% | 8,017[lower-alpha 4] | 15.59% | 51,445[lower-alpha 5] |
| Saluda | 1,466 | 30.53% | 1,200 | 24.99% | 2,136 | 44.48% | -670 | -13.95% | 4,802 |
| Spartanburg | 18,183 | 38.69% | 11,467 | 24.40% | 17,346 | 36.91% | 837 | 1.78% | 46,996 |
| Sumter | 5,451 | 33.43% | 6,103 | 37.42% | 4,754 | 29.15% | -652[lower-alpha 4] | -3.99% | 16,308 |
| Union | 3,011 | 30.50% | 2,271 | 23.00% | 4,590 | 46.50% | -1,579 | -16.00% | 9,872 |
| Williamsburg | 3,029 | 28.08% | 5,106 | 47.33% | 2,652 | 24.59% | -2,077[lower-alpha 4] | -19.25% | 10,787 |
| York | 7,596 | 37.48% | 5,571 | 27.49% | 7,102 | 35.04% | 494 | 2.44% | 20,269 |
| Totals | 254,062 | 38.09% | 197,486 | 29.61% | 215,430 | 32.30% | 38,632 | 5.79% | 666,982 |
Notes
- Although he was born in California and he served as a U.S. Senator from California, in 1968 Richard Nixon's official state of residence was New York, because he moved there to practice law after his defeat in the 1962 California gubernatorial election. During his first term as president, Nixon re-established his residency in California. Consequently, most reliable reference books list Nixon's home state as New York in the 1968 election and his home state as California in the 1972 (and 1960) election.
- Because Nixon finished first and Wallace second in South Carolina as a whole, all margins given are Nixon vote minus Wallace vote and Nixon percentage minus Wallace percentage unless state for the county in question.
- In this county where Nixon ran third behind both Humphrey and Wallace, margin given is Humphrey vote minus Wallace vote and percentage margin Humphrey percentage minus Wallace percentage.
- In this county where Wallace ran third behind both Nixon and Humphrey, margin given is Nixon vote minus Humphrey vote and percentage margin Nixon percentage minus Humphrey percentage.
- Two write-in votes were recorded from this county.
References
- Phillips, Kevin P.; The Emerging Republican Majority, pp. 208, 210 ISBN 9780691163246
- Mickey, Robert; Paths Out of Dixie: The Democratization of Authoritarian Enclaves in America's Deep South, 1944-1972, p. 440 ISBN 0691149631
- Mickey; Paths Out of Dixie, p. 27
- Frederikson, Kari; The Dixiecrat Revolt and the End of the Solid South, 1932-1968, p. 185 ISBN 9780807875445
- Graham, Cole Blease and Moore, William V.; South Carolina Politics and Government, pp. 79, 81 ISBN 9780803270435
- Mickey, Paths out of Dixie, p. 234
- Phillips; The Emerging Republican Majority, p. 396
- Phillips; The Emerging Republican Majority, p. 254
- Perlstein, Rick; Nixonland: The Rise of a President and the Fracturing of America, pp. 344-345 ISBN 9780743243025
- Rouse, Mike; ‘Wallace IS Appealing for Vote of the “Doves” as Well as Others’; Danville Register, September 3, 1968, p. 12
- ‘Four Polls Place Nixon in Lead’; Marshfield News-Herald, September 16, 1968, p. 3
- ‘Face-to-Face: Humphrey Desires Debate with Nixon’; Cumberland Evening-Times, September 16, 1968, p. 3
- ‘Nixon Proposes Anti-Crime Council’; The Waco News-Tribune, September 30, 1968, p. 5
- "1968 Presidential General Election Results – South Carolina". Dave Leip's Atlas of U.S. Presidential Elections. Retrieved 2016-08-25.
- Woolley, John; Peters, Gehard. "1968 Presidential Election". The American Presidency Project. University of California, Santa Barbara. Retrieved 26 August 2016.