1968 United States presidential election in Indiana
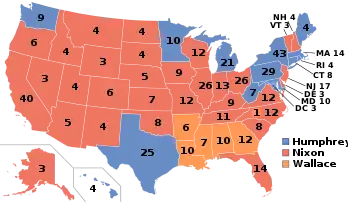
The 1968 United States presidential election in Indiana was held on November 5th, 1968. State voters chose 13 representatives, or electors to the Electoral College, who voted for President and Vice-President.
| |||||||||||||||||||||||||||||||||
| |||||||||||||||||||||||||||||||||
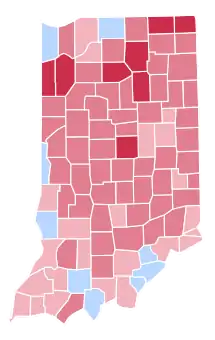 County Results
| |||||||||||||||||||||||||||||||||
| |||||||||||||||||||||||||||||||||
| Elections in Indiana |
|---|
 |
Background
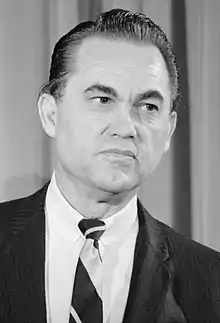
Indiana had been a traditionally Republican state that had turned away from Barry Goldwater in 1964 due to powerful hostility to Goldwater’s leanings from its Yankee and Appalachia-influenced Northern and Southern regions,[1] despite having been the centre of a Democratic primary challenge from segregationist Alabama Governor George Wallace that attracted considerable support in towns that would soon become part of the “Rust Belt”.[2] However, Wallace lost by worse than one-to-two against solitary opponent Matthew E. Welsh in Indiana[3] and unlike in Maryland his Indiana support was mostly among the middle classes.[4]
In the mid-term elections, the Republicans made major gains in Southern Indiana with its Appalachia influence[5] and in the significantly German central section, but did less well in the north of the state.
1968 saw Indiana – for the second consecutive election – as the center of a major primary battle, this time involving Bobby Kennedy (who was to be assassinated by Sirhan Sirhan that June). Like his brother John, Bobby was interested in entering a primary in a highly Protestant and Southern-influenced state to test his strength.[6] as JFK had done in West Virginia. RFK would win the state, but his performance was regarded as disappointing especially in white urban areas where he was outpolled by Eugene McCarthy.[7]
Vote
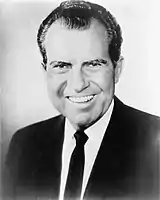
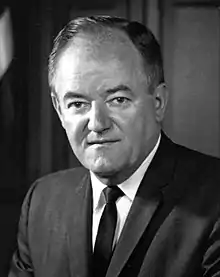
Nixon was able, as expected,[8] to restore Indiana’s Republican dominance, defeating Humphrey by 12.30 percentage points.[9] Wallace, in a state with considerable “Southern” influence,[10] had some late October polls place him even with Humphrey at around 20%,[11] but the former Alabama Governor would lose almost half of this by polling day. Wallace gained his most substantial support in urban ethnic districts where resentment of blacks and recent race riots had become substantial over the previous two years,[12] but did not do so well elsewhere in the state since – like Goldwater – he was viewed as too aligned with the Deep South.
Results
| Presidential candidate | Party | Home state | Popular vote | Electoral vote |
Running mate | |||
|---|---|---|---|---|---|---|---|---|
| Count | Percentage | Vice-presidential candidate | Home state | Electoral vote | ||||
| Richard Nixon | Republican | New York | 1,067,885 | 50.29% | 13 | Spiro Agnew | Maryland | 13 |
| Hubert Humphrey | Democrat | Minnesota | 806,659 | 37.99% | 0 | Edmund Muskie | Maine | 0 |
| George Wallace | George Wallace Party | Alabama | 243,108 | 11.45% | 0 | S. Marvin Griffin | Georgia | 0 |
| Earle Harold Munn | Prohibition | Michigan | 4,616 | 0.22% | 0 | Rolland Fisher | Kansas | 0 |
| Fred Halstead | Socialist Workers | California | 1,293 | 0.06% | 0 | Paul Boutelle | New York | 0 |
| Dick Gregory | Write-in | Illinois | 36 | 0.00% | 0 | — | — | 0 |
| Total | 2,123,597 | 100% | 13 | 13 | ||||
| Needed to win | 270 | 270 | ||||||
Results by county
| County | Richard Milhous Nixon Republican |
Hubert Horatio Humphrey Democratic |
George Corley Wallace George Wallace Party |
Various candidates Other parties |
Margin | Total votes cast | |||||
|---|---|---|---|---|---|---|---|---|---|---|---|
| # | % | # | % | # | % | # | % | # | % | ||
| Adams | 5,774 | 51.28% | 4,667 | 41.45% | 762 | 6.77% | 56 | 0.50% | 1,107 | 9.83% | 11,259 |
| Allen | 59,211 | 54.34% | 40,411 | 37.09% | 9,121 | 8.37% | 211 | 0.19% | 18,800 | 17.25% | 108,954 |
| Bartholomew | 13,628 | 55.80% | 8,268 | 33.85% | 2,438 | 9.98% | 90 | 0.37% | 5,360 | 21.95% | 24,424 |
| Benton | 3,326 | 59.54% | 1,854 | 33.19% | 400 | 7.16% | 6 | 0.11% | 1,472 | 26.35% | 5,586 |
| Blackford | 3,052 | 46.92% | 2,898 | 44.56% | 534 | 8.21% | 20 | 0.31% | 154 | 2.37% | 6,504 |
| Boone | 7,905 | 58.96% | 4,118 | 30.72% | 1,346 | 10.04% | 38 | 0.28% | 3,787 | 28.25% | 13,407 |
| Brown | 1,881 | 49.41% | 1,327 | 34.86% | 587 | 15.42% | 12 | 0.32% | 554 | 14.55% | 3,807 |
| Carroll | 4,796 | 56.19% | 2,816 | 32.99% | 918 | 10.76% | 5 | 0.06% | 1,980 | 23.20% | 8,535 |
| Cass | 9,441 | 51.54% | 7,142 | 38.99% | 1,678 | 9.16% | 57 | 0.31% | 2,299 | 12.55% | 18,318 |
| Clark | 10,305 | 38.33% | 11,493 | 42.75% | 4,982 | 18.53% | 106 | 0.39% | -1,188 | -4.42% | 26,886 |
| Clay | 5,743 | 50.83% | 3,956 | 35.02% | 1,569 | 13.89% | 30 | 0.27% | 1,787 | 15.82% | 11,298 |
| Clinton | 7,929 | 53.91% | 5,714 | 38.85% | 1,033 | 7.02% | 31 | 0.21% | 2,215 | 15.06% | 14,707 |
| Crawford | 2,132 | 49.81% | 1,536 | 35.89% | 589 | 13.76% | 23 | 0.54% | 596 | 13.93% | 4,280 |
| Daviess | 7,036 | 56.77% | 4,071 | 32.85% | 1,274 | 10.28% | 12 | 0.10% | 2,965 | 23.92% | 12,393 |
| Dearborn | 6,208 | 48.65% | 4,842 | 37.95% | 1,704 | 13.35% | 6 | 0.05% | 1,366 | 10.71% | 12,760 |
| Decatur | 5,474 | 55.67% | 3,602 | 36.63% | 731 | 7.43% | 26 | 0.26% | 1,872 | 19.04% | 9,833 |
| DeKalb | 7,650 | 56.93% | 4,790 | 35.65% | 931 | 6.93% | 67 | 0.50% | 2,860 | 21.28% | 13,438 |
| Delaware | 23,554 | 47.56% | 19,532 | 39.44% | 6,349 | 12.82% | 88 | 0.18% | 4,022 | 8.12% | 49,523 |
| Dubois | 5,865 | 43.24% | 6,725 | 49.58% | 958 | 7.06% | 15 | 0.11% | -860 | -6.34% | 13,563 |
| Elkhart | 24,484 | 57.90% | 14,222 | 33.63% | 3,440 | 8.13% | 143 | 0.34% | 10,262 | 24.27% | 42,289 |
| Fayette | 5,286 | 46.92% | 4,549 | 40.38% | 1,413 | 12.54% | 18 | 0.16% | 737 | 6.54% | 11,266 |
| Floyd | 9,714 | 40.99% | 10,671 | 45.02% | 3,266 | 13.78% | 50 | 0.21% | -957 | -4.04% | 23,701 |
| Fountain | 5,110 | 53.02% | 3,237 | 33.59% | 1,280 | 13.28% | 10 | 0.10% | 1,873 | 19.44% | 9,637 |
| Franklin | 3,468 | 52.28% | 2,386 | 35.97% | 775 | 11.68% | 5 | 0.08% | 1,082 | 16.31% | 6,634 |
| Fulton | 5,145 | 60.72% | 2,561 | 30.22% | 757 | 8.93% | 11 | 0.13% | 2,584 | 30.49% | 8,474 |
| Gibson | 7,645 | 47.91% | 6,777 | 42.47% | 1,497 | 9.38% | 38 | 0.24% | 868 | 5.44% | 15,957 |
| Grant | 16,170 | 52.46% | 10,938 | 35.48% | 3,602 | 11.68% | 116 | 0.38% | 5,232 | 16.97% | 30,826 |
| Greene | 6,525 | 48.37% | 5,493 | 40.72% | 1,419 | 10.52% | 54 | 0.40% | 1,032 | 7.65% | 13,491 |
| Hamilton | 14,250 | 67.63% | 4,586 | 21.77% | 2,202 | 10.45% | 31 | 0.15% | 9,664 | 45.87% | 21,069 |
| Hancock | 7,516 | 56.23% | 3,902 | 29.19% | 1,896 | 14.19% | 52 | 0.39% | 3,614 | 27.04% | 13,366 |
| Harrison | 4,410 | 45.32% | 3,725 | 38.28% | 1,557 | 16.00% | 39 | 0.40% | 685 | 7.04% | 9,731 |
| Hendricks | 12,597 | 59.89% | 5,155 | 24.51% | 3,231 | 15.36% | 49 | 0.23% | 7,442 | 35.38% | 21,032 |
| Henry | 11,626 | 52.61% | 8,045 | 36.41% | 2,366 | 10.71% | 60 | 0.27% | 3,581 | 16.21% | 22,097 |
| Howard | 15,905 | 50.39% | 11,026 | 34.93% | 4,507 | 14.28% | 128 | 0.41% | 4,879 | 15.46% | 31,566 |
| Huntington | 9,002 | 54.48% | 6,238 | 37.75% | 1,250 | 7.57% | 33 | 0.20% | 2,764 | 16.73% | 16,523 |
| Jackson | 7,710 | 52.02% | 5,140 | 34.68% | 1,891 | 12.76% | 80 | 0.54% | 2,570 | 17.34% | 14,821 |
| Jasper | 4,996 | 60.54% | 2,201 | 26.67% | 1,003 | 12.15% | 52 | 0.63% | 2,795 | 33.87% | 8,252 |
| Jay | 5,460 | 51.00% | 4,290 | 40.07% | 918 | 8.58% | 37 | 0.35% | 1,170 | 10.93% | 10,705 |
| Jefferson | 5,731 | 49.31% | 4,635 | 39.88% | 1,196 | 10.29% | 61 | 0.52% | 1,096 | 9.43% | 11,623 |
| Jennings | 4,416 | 51.11% | 2,996 | 34.68% | 1,214 | 14.05% | 14 | 0.16% | 1,420 | 16.44% | 8,640 |
| Johnson | 12,089 | 57.26% | 5,946 | 28.17% | 3,021 | 14.31% | 55 | 0.26% | 6,143 | 29.10% | 21,111 |
| Knox | 8,369 | 46.97% | 7,297 | 40.95% | 2,053 | 11.52% | 99 | 0.56% | 1,072 | 6.02% | 17,818 |
| Kosciusko | 12,633 | 63.98% | 5,342 | 27.06% | 1,700 | 8.61% | 69 | 0.35% | 7,291 | 36.93% | 19,744 |
| LaGrange | 3,328 | 61.54% | 1,691 | 31.27% | 380 | 7.03% | 9 | 0.17% | 1,637 | 30.27% | 5,408 |
| Lake | 77,911 | 36.48% | 99,897 | 46.77% | 35,099 | 16.43% | 667 | 0.31% | -21,986 | -10.29% | 213,574 |
| LaPorte | 20,295 | 49.76% | 15,780 | 38.69% | 4,587 | 11.25% | 121 | 0.30% | 4,515 | 11.07% | 40,783 |
| Lawrence | 8,830 | 54.35% | 5,349 | 32.92% | 1,995 | 12.28% | 74 | 0.46% | 3,481 | 21.42% | 16,248 |
| Madison | 28,726 | 48.39% | 23,886 | 40.23% | 6,613 | 11.14% | 143 | 0.24% | 4,840 | 8.15% | 59,368 |
| Marion | 162,503 | 52.26% | 115,715 | 37.22% | 32,043 | 10.31% | 661 | 0.21% | 46,788 | 15.05% | 310,922 |
| Marshall | 9,290 | 56.67% | 5,385 | 32.85% | 1,685 | 10.28% | 34 | 0.21% | 3,905 | 23.82% | 16,394 |
| Martin | 2,512 | 46.22% | 2,315 | 42.59% | 604 | 11.11% | 4 | 0.07% | 197 | 3.62% | 5,435 |
| Miami | 7,295 | 53.42% | 5,019 | 36.76% | 1,294 | 9.48% | 47 | 0.34% | 2,276 | 16.67% | 13,655 |
| Monroe | 13,752 | 50.78% | 10,789 | 39.84% | 2,361 | 8.72% | 178 | 0.66% | 2,963 | 10.94% | 27,080 |
| Montgomery | 9,085 | 59.87% | 4,752 | 31.31% | 1,309 | 8.63% | 29 | 0.19% | 4,333 | 28.55% | 15,175 |
| Morgan | 8,944 | 55.45% | 4,042 | 25.06% | 3,122 | 19.36% | 22 | 0.14% | 4,902 | 30.39% | 16,130 |
| Newton | 3,145 | 61.75% | 1,453 | 28.53% | 483 | 9.48% | 12 | 0.24% | 1,692 | 33.22% | 5,093 |
| Noble | 6,699 | 51.35% | 5,075 | 38.90% | 1,253 | 9.60% | 19 | 0.15% | 1,624 | 12.45% | 13,046 |
| Ohio | 1,053 | 46.04% | 991 | 43.33% | 243 | 10.63% | 0 | 0.00% | 62 | 2.71% | 2,287 |
| Orange | 4,666 | 54.82% | 2,918 | 34.28% | 915 | 10.75% | 13 | 0.15% | 1,748 | 20.54% | 8,512 |
| Owen | 2,898 | 51.58% | 1,932 | 34.39% | 776 | 13.81% | 12 | 0.21% | 966 | 17.19% | 5,618 |
| Parke | 3,738 | 52.47% | 2,472 | 34.70% | 907 | 12.73% | 7 | 0.10% | 1,266 | 17.77% | 7,124 |
| Perry | 4,211 | 46.23% | 4,343 | 47.68% | 547 | 6.01% | 7 | 0.08% | -132 | -1.45% | 9,108 |
| Pike | 3,087 | 45.38% | 2,953 | 43.41% | 745 | 10.95% | 17 | 0.25% | 134 | 1.97% | 6,802 |
| Porter | 17,328 | 53.18% | 8,914 | 27.36% | 6,126 | 18.80% | 214 | 0.66% | 8,414 | 25.82% | 32,582 |
| Posey | 5,045 | 49.70% | 3,889 | 38.32% | 1,204 | 11.86% | 12 | 0.12% | 1,156 | 11.39% | 10,150 |
| Pulaski | 3,361 | 54.80% | 2,071 | 33.77% | 681 | 11.10% | 20 | 0.33% | 1,290 | 21.03% | 6,133 |
| Putnam | 5,873 | 51.47% | 3,692 | 32.36% | 1,826 | 16.00% | 19 | 0.17% | 2,181 | 19.11% | 11,410 |
| Randolph | 7,238 | 57.14% | 3,962 | 31.28% | 1,431 | 11.30% | 36 | 0.28% | 3,276 | 25.86% | 12,667 |
| Ripley | 5,389 | 51.82% | 3,787 | 36.42% | 1,215 | 11.68% | 8 | 0.08% | 1,602 | 15.41% | 10,399 |
| Rush | 5,004 | 59.42% | 2,636 | 31.30% | 761 | 9.04% | 20 | 0.24% | 2,368 | 28.12% | 8,421 |
| Saint Joseph | 47,114 | 44.09% | 47,414 | 44.37% | 11,948 | 11.18% | 388 | 0.36% | -300 | -0.28% | 106,864 |
| Scott | 2,671 | 42.62% | 2,796 | 44.61% | 784 | 12.51% | 16 | 0.26% | -125 | -1.99% | 6,267 |
| Shelby | 8,574 | 52.84% | 5,417 | 33.38% | 2,205 | 13.59% | 30 | 0.18% | 3,157 | 19.46% | 16,226 |
| Spencer | 4,603 | 51.18% | 3,767 | 41.89% | 612 | 6.81% | 11 | 0.12% | 836 | 9.30% | 8,993 |
| Starke | 4,011 | 47.95% | 3,208 | 38.35% | 1,097 | 13.11% | 49 | 0.59% | 803 | 9.60% | 8,365 |
| Steuben | 4,762 | 62.51% | 2,268 | 29.77% | 577 | 7.57% | 11 | 0.14% | 2,494 | 32.74% | 7,618 |
| Sullivan | 4,266 | 43.20% | 4,453 | 45.10% | 1,135 | 11.49% | 20 | 0.20% | -187 | -1.89% | 9,874 |
| Switzerland | 1,515 | 44.07% | 1,466 | 42.64% | 452 | 13.15% | 5 | 0.15% | 49 | 1.43% | 3,438 |
| Tippecanoe | 24,352 | 59.44% | 14,528 | 35.46% | 2,000 | 4.88% | 88 | 0.21% | 9,824 | 23.98% | 40,968 |
| Tipton | 4,270 | 54.73% | 2,646 | 33.91% | 861 | 11.04% | 25 | 0.32% | 1,624 | 20.82% | 7,802 |
| Union | 1,691 | 56.01% | 920 | 30.47% | 404 | 13.38% | 4 | 0.13% | 771 | 25.54% | 3,019 |
| Vanderburgh | 38,231 | 49.28% | 31,326 | 40.38% | 7,737 | 9.97% | 283 | 0.36% | 6,905 | 8.90% | 77,577 |
| Vermillion | 3,607 | 41.76% | 3,845 | 44.52% | 1,175 | 13.60% | 10 | 0.12% | -238 | -2.76% | 8,637 |
| Vigo | 20,814 | 44.60% | 20,328 | 43.56% | 5,386 | 11.54% | 136 | 0.29% | 486 | 1.04% | 46,664 |
| Wabash | 8,611 | 61.07% | 4,598 | 32.61% | 836 | 5.93% | 56 | 0.40% | 4,013 | 28.46% | 14,101 |
| Warren | 2,475 | 57.00% | 1,375 | 31.67% | 483 | 11.12% | 9 | 0.21% | 1,100 | 25.33% | 4,342 |
| Warrick | 5,742 | 47.53% | 4,784 | 39.60% | 1,503 | 12.44% | 52 | 0.43% | 958 | 7.93% | 12,081 |
| Washington | 3,891 | 48.61% | 2,936 | 36.68% | 1,143 | 14.28% | 34 | 0.42% | 955 | 11.93% | 8,004 |
| Wayne | 17,335 | 53.66% | 10,686 | 33.08% | 4,240 | 13.12% | 47 | 0.15% | 6,649 | 20.58% | 32,308 |
| Wells | 5,361 | 53.07% | 3,827 | 37.89% | 882 | 8.73% | 31 | 0.31% | 1,534 | 15.19% | 10,101 |
| White | 5,932 | 57.56% | 3,395 | 32.95% | 965 | 9.36% | 13 | 0.13% | 2,537 | 24.62% | 10,305 |
| Whitley | 5,684 | 53.27% | 3,848 | 36.06% | 1,120 | 10.50% | 19 | 0.18% | 1,836 | 17.21% | 10,671 |
| Totals | 1,067,885 | 50.29% | 806,659 | 37.99% | 243,108 | 11.45% | 5,945 | 0.28% | 261,226 | 12.30% | 2,123,597 |
Notes
- Although he was born in California and he served as a U.S. Senator from California, in 1968 Richard Nixon’s official state of residence was New York, because he moved there to practice law after his defeat in the 1962 California gubernatorial election. During his first term as president, Nixon re-established his residency in California. Consequently, most reliable reference books list Nixon's home state as New York in the 1968 election and his home state as California in the 1972 (and 1960) election.
References
- Phillips, Kevin P.; The Emerging Republican Majority, pp. 363-364, 397 ISBN 9780691163246
- Welsh, Matthew E.; ‘Civil Rights and the Primary Election of 1964 in Indiana: The Wallace Challenge’; Indiana Magazine of History, vol. 75, no. 1 (March 1979), pp. 1-27
- Lesher, Stephan (1994). George Wallace: American Populist, p. 295 ISBN 0-201-62210-6
- Conway M. Margaret; 'The White Backlash Re-examined: Wallace and the 1964 Primaries'; Social Science Quarterly, vol. 49, no. 3: Black America (December, 1968), pp. 710-719
- Phillips, The Emerging Republican Majority, p. 366
- Boomhower, Ray E. Robert F. Kennedy and the 1968 Indiana Primary, pp. 6-7 ISBN 0253007755
- Cohen, Michael A.; American Maelstrom: The 1968 Election and Politics of Division, p. 130 ISBN 019977756X
- ‘Electoral Vote: Nixon 359, HHH 46’; Boston Globe, October 7, 1968, p. 24
- Leip, David. "1968 Presidential General Election Results – Indiana". Dave Leip’s Atlas of U.S. Presidential Elections. Retrieved 2017-04-25.
- Phillips, The Emerging Republican Majority, p. 344
- Mobley, Willard; ‘Nixon Has Edge In 26 States’; Boston Globe, October 20, 1968, p. 22
- Shaffer, William R. and Caputo, David A.; ‘Political Continuity in Indiana Presidential Elections: An Analysis Based on the Key-Munger Paradigm’; Midwest Journal of Political Science, vol. 16, no. 4 (November 1972), pp. 700-711
