1968 United States presidential election in North Carolina
The 1968 United States presidential election in North Carolina took place on November 5, 1968, and was part of the 1968 United States presidential election. Voters chose 13 representatives, or electors to the Electoral College, who voted for president and vice president.
| |||||||||||||||||||||||||||||||||
| |||||||||||||||||||||||||||||||||
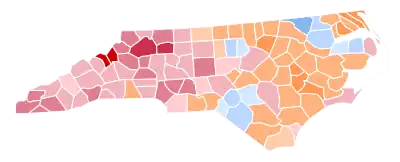 County Results
| |||||||||||||||||||||||||||||||||
| |||||||||||||||||||||||||||||||||
| Elections in North Carolina |
|---|
 |
Whereas in the Deep South, Black Belt whites had deserted the national Democratic Party in 1948, in North Carolina, where they had historically been an economically liberalising influence on the state Democratic Party,[1] the white landowners of the Black Belt had stayed exceedingly loyal to the party until after the Voting Rights Act. This allowed North Carolina to be alongside Arkansas the only state to vote for Democrats in all four presidential elections between 1952 and 1964. Nonetheless, in 1964 Republican Barry Goldwater won a small majority of white voters,[2] although he was beaten by virtually universal support for incumbent President Lyndon Johnson by a black vote estimated at 175,000. However, with the VRA's passage, a reaction set in amongst these, and indeed amongst almost all Southern poor whites outside the unionised coalfields of Appalachia.[3] Former Alabama Governor George Wallace, running in North Carolina under the moniker of the “American Party”, appealed very strongly to most white voters in the eastern half of the state who had become extremely critical of black protesters, student radicals, and rising crime rates.[4]
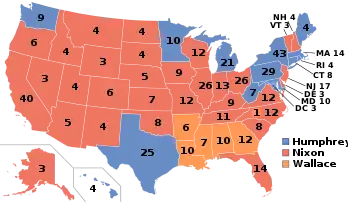
In early polls it was thought that Wallace would carry the state,[5] but a major swing against him and toward Republican nominee Richard Nixon during October and November saw Nixon win the state, with 39.5% of the vote, whilst Wallace's 31.3% still pushed Democratic nominee and incumbent Vice-President Hubert Humphrey into third on 29.2%. The Alabama segregationist carried almost all of the Piedmont and Outer Banks, and some Black Belt areas where black voter registration was still limited – the very areas that had allowed John F. Kennedy and Adlai Stevenson II to carry North Carolina when other Outer South states went Republican. In these previously loyal regions whites felt President Johnson had moved much too far on civil rights issues, and consequent support for highly segregationist candidates in Democratic primary elections[6] led them naturally to Wallace.[7] Humphrey had very limited support outside of black voters, who were estimated to comprise well over half his total vote in the state,[8] with his share of the white vote totalling less than 20 percent and coming mainly from some traditionally Democratic mountain counties and the university communities of Orange and Durham counties.
Nixon won twelve of the state's electoral votes, while one faithless elector that had been pledged to Nixon voted instead for Wallace. Nixon became the first Republican to carry North Carolina in a presidential election since Herbert Hoover in 1928. As of the 2020 presidential election, this is the last election in which Wayne County and Lenoir County did not vote for the Republican presidential candidate.[9]
Results
| 1968 United States presidential election in North Carolina[10] | |||||
|---|---|---|---|---|---|
| Party | Candidate | Votes | Percentage | Electoral votes | |
| Republican | Richard Nixon | 627,192 | 39.51% | 12 | |
| American | George Wallace | 496,188 | 31.26% | 1 | |
| Democratic | Hubert Humphrey | 464,113 | 29.24% | 0 | |
| Totals | 1,587,493 | 100.0% | 13 | ||
| Voter turnout | — | ||||
Results by county
| County | Richard Milhous Nixon[11] Republican |
Hubert Horatio Humphrey, jr.[11] Democratic |
George Corley Wallace[11] American |
Margin[lower-alpha 2] | ||||
|---|---|---|---|---|---|---|---|---|
| % | # | % | # | % | # | % | # | |
| Mitchell | 72.65% | 3,778 | 15.75% | 819 | 11.60% | 603 | 56.90% | 2,959[lower-alpha 3] |
| Avery | 70.76% | 3,197 | 13.97% | 631 | 15.27% | 690 | 55.49% | 2,507 |
| Wilkes | 60.29% | 11,195 | 24.22% | 4,497 | 15.49% | 2,876 | 36.07% | 6,698[lower-alpha 3] |
| Watauga | 55.88% | 5,081 | 32.46% | 2,952 | 11.66% | 1,060 | 23.41% | 2,129[lower-alpha 3] |
| Ashe | 53.15% | 4,894 | 37.21% | 3,426 | 9.64% | 888 | 15.94% | 1,468[lower-alpha 3] |
| Clay | 54.94% | 1,390 | 33.48% | 847 | 11.58% | 293 | 21.46% | 543[lower-alpha 3] |
| Graham | 52.44% | 1,570 | 35.44% | 1,061 | 12.12% | 363 | 17.00% | 509[lower-alpha 3] |
| Cherokee | 53.18% | 3,768 | 33.90% | 2,402 | 12.91% | 915 | 19.28% | 1,366[lower-alpha 3] |
| Yadkin | 60.51% | 5,885 | 14.84% | 1,443 | 24.65% | 2,397 | 35.87% | 3,488 |
| Jackson | 48.14% | 3,747 | 37.98% | 2,956 | 13.88% | 1,080 | 10.16% | 791[lower-alpha 3] |
| Catawba | 56.33% | 18,393 | 21.36% | 6,974 | 22.31% | 7,285 | 34.02% | 11,108 |
| Mecklenburg | 52.40% | 56,325 | 28.93% | 31,102 | 18.67% | 20,070 | 23.46% | 25,223[lower-alpha 3] |
| Henderson | 57.45% | 9,334 | 18.79% | 3,053 | 23.76% | 3,861 | 33.68% | 5,473 |
| Madison | 49.18% | 3,130 | 34.58% | 2,201 | 16.25% | 1,034 | 14.60% | 929[lower-alpha 3] |
| Macon | 50.48% | 3,295 | 31.71% | 2,070 | 17.80% | 1,162 | 18.77% | 1,225[lower-alpha 3] |
| Yancey | 45.21% | 2,448 | 40.90% | 2,215 | 13.89% | 752 | 4.30% | 233[lower-alpha 3] |
| Surry | 51.19% | 9,638 | 27.02% | 5,088 | 21.79% | 4,103 | 24.16% | 4,550[lower-alpha 3] |
| Swain | 45.86% | 1,494 | 37.66% | 1,227 | 16.48% | 537 | 8.20% | 267[lower-alpha 3] |
| Cabarrus | 52.35% | 13,226 | 21.77% | 5,501 | 25.88% | 6,538 | 26.47% | 6,688 |
| Caldwell | 51.46% | 10,433 | 23.41% | 4,746 | 25.13% | 5,095 | 26.33% | 5,338 |
| Alexander | 52.03% | 4,379 | 21.79% | 1,834 | 26.18% | 2,203 | 25.86% | 2,176 |
| Stanly | 51.43% | 9,428 | 22.90% | 4,199 | 25.67% | 4,706 | 25.76% | 4,722 |
| Randolph | 52.35% | 13,450 | 20.83% | 5,351 | 26.82% | 6,892 | 25.52% | 6,558 |
| Forsyth | 46.79% | 31,623 | 30.01% | 20,281 | 23.20% | 15,681 | 16.78% | 11,342[lower-alpha 3] |
| Burke | 48.84% | 11,068 | 25.17% | 5,704 | 26.00% | 5,892 | 22.84% | 5,176 |
| Guilford | 46.23% | 38,996 | 30.35% | 25,604 | 23.42% | 19,751 | 15.88% | 13,392[lower-alpha 3] |
| Lincoln | 46.20% | 6,188 | 30.19% | 4,044 | 23.60% | 3,161 | 16.01% | 2,144[lower-alpha 3] |
| Alleghany | 45.80% | 1,695 | 29.78% | 1,102 | 24.43% | 904 | 16.02% | 593[lower-alpha 3] |
| Rutherford | 46.11% | 7,785 | 27.38% | 4,622 | 26.51% | 4,476 | 18.73% | 3,163[lower-alpha 3] |
| Transylvania | 46.85% | 4,033 | 25.67% | 2,210 | 27.47% | 2,365 | 19.38% | 1,668 |
| Buncombe | 44.23% | 21,031 | 30.76% | 14,624 | 25.01% | 11,889 | 13.48% | 6,407[lower-alpha 3] |
| Polk | 45.89% | 2,550 | 27.41% | 1,523 | 26.71% | 1,484 | 18.48% | 1,027[lower-alpha 3] |
| Rowan | 46.79% | 15,207 | 24.84% | 8,074 | 28.37% | 9,220 | 18.42% | 5,987 |
| Wake | 43.08% | 28,928 | 31.24% | 20,979 | 25.69% | 17,250 | 11.84% | 7,949[lower-alpha 3] |
| Davie | 49.04% | 3,866 | 19.05% | 1,502 | 31.90% | 2,515 | 17.14% | 1,351 |
| Moore | 43.74% | 5,322 | 29.45% | 3,583 | 26.82% | 3,263 | 14.29% | 1,739[lower-alpha 3] |
| McDowell | 46.01% | 4,740 | 24.69% | 2,543 | 29.30% | 3,018 | 16.72% | 1,722 |
| Haywood | 39.26% | 6,205 | 36.08% | 5,703 | 24.66% | 3,898 | 3.18% | 502[lower-alpha 3] |
| Davidson | 46.57% | 16,678 | 21.20% | 7,594 | 32.23% | 11,544 | 14.33% | 5,134 |
| Carteret | 40.23% | 4,593 | 32.95% | 3,762 | 26.81% | 3,061 | 7.28% | 831[lower-alpha 3] |
| Sampson | 41.44% | 6,597 | 30.13% | 4,797 | 28.43% | 4,527 | 11.31% | 1,800[lower-alpha 3] |
| Stokes | 45.25% | 4,781 | 22.47% | 2,374 | 32.28% | 3,410 | 12.98% | 1,371 |
| Orange | 33.30% | 6,097 | 45.70% | 8,366 | 21.00% | 3,845 | -12.39% | -2,269[lower-alpha 3] |
| Gaston | 43.77% | 18,741 | 23.59% | 10,100 | 32.64% | 13,973 | 11.14% | 4,768 |
| Montgomery | 39.67% | 3,070 | 31.14% | 2,410 | 29.19% | 2,259 | 8.53% | 660[lower-alpha 3] |
| Dare | 40.13% | 1,035 | 27.14% | 700 | 32.73% | 844 | 7.41% | 191 |
| Iredell | 43.17% | 10,557 | 19.95% | 4,878 | 36.89% | 9,021 | 6.28% | 1,536 |
| Chatham | 36.22% | 3,845 | 33.27% | 3,532 | 30.51% | 3,239 | 2.95% | 313[lower-alpha 3] |
| Union | 38.67% | 5,290 | 26.53% | 3,630 | 34.80% | 4,761 | 3.87% | 529 |
| New Hanover | 37.03% | 10,020 | 28.64% | 7,750 | 34.33% | 9,291 | 2.69% | 729 |
| Cumberland | 31.95% | 9,143 | 34.72% | 9,938 | 33.33% | 9,539 | 1.39% | 399[lower-alpha 4] |
| Durham | 29.68% | 12,705 | 38.69% | 16,563 | 31.63% | 13,542 | 7.06% | 3,021[lower-alpha 4] |
| Alamance | 36.54% | 12,310 | 24.46% | 8,241 | 39.00% | 13,139 | -2.46% | -829 |
| Scotland | 28.69% | 1,717 | 37.63% | 2,252 | 33.68% | 2,016 | 3.94% | 236[lower-alpha 4] |
| Rockingham | 33.46% | 8,095 | 28.00% | 6,774 | 38.54% | 9,324 | -5.08% | -1,229 |
| Harnett | 32.97% | 5,184 | 25.49% | 4,007 | 41.54% | 6,531 | -8.57% | -1,347 |
| Tyrrell | 22.61% | 291 | 45.14% | 581 | 32.25% | 415 | 12.90% | 166[lower-alpha 4] |
| Robeson | 23.55% | 4,526 | 42.92% | 8,248 | 33.52% | 6,441 | 9.40% | 1,807[lower-alpha 4] |
| Cleveland | 32.28% | 7,298 | 25.04% | 5,661 | 42.68% | 9,649 | -10.40% | -2,351 |
| Brunswick | 27.52% | 2,404 | 34.03% | 2,972 | 38.45% | 3,358 | -4.42% | -386[lower-alpha 4] |
| Johnston | 33.05% | 6,764 | 21.95% | 4,492 | 45.01% | 9,212 | -11.96% | -2,448 |
| Lee | 29.32% | 2,586 | 28.61% | 2,524 | 42.07% | 3,711 | -12.75% | -1,125 |
| Pitt | 25.41% | 5,745 | 34.04% | 7,696 | 40.55% | 9,167 | -6.51% | -1,471[lower-alpha 4] |
| Wayne | 28.79% | 5,678 | 27.06% | 5,338 | 44.15% | 8,709 | -15.37% | -3,031 |
| Hoke | 17.88% | 812 | 48.11% | 2,185 | 34.02% | 1,545 | 14.09% | 640[lower-alpha 4] |
| Hertford | 17.04% | 1,125 | 49.60% | 3,275 | 33.36% | 2,203 | 16.24% | 1,072[lower-alpha 4] |
| Onslow | 28.08% | 3,444 | 26.75% | 3,281 | 45.18% | 5,542 | -17.10% | -2,098 |
| Washington | 21.26% | 1,016 | 39.71% | 1,898 | 39.04% | 1,866 | 0.67% | 32[lower-alpha 4] |
| Edgecombe | 22.36% | 3,198 | 36.66% | 5,243 | 40.98% | 5,861 | -4.32% | -618[lower-alpha 4] |
| Columbus | 26.19% | 3,881 | 28.64% | 4,243 | 45.17% | 6,693 | -16.54% | -2,450[lower-alpha 4] |
| Pamlico | 21.46% | 745 | 36.87% | 1,280 | 41.68% | 1,447 | -4.81% | -167[lower-alpha 4] |
| Richmond | 22.78% | 2,865 | 33.84% | 4,257 | 43.38% | 5,457 | -9.54% | -1,200[lower-alpha 4] |
| Hyde | 20.02% | 401 | 38.39% | 769 | 41.59% | 833 | -3.20% | -64[lower-alpha 4] |
| Person | 24.17% | 2,138 | 29.89% | 2,644 | 45.95% | 4,065 | -16.06% | -1,421[lower-alpha 4] |
| Wilson | 25.13% | 4,053 | 25.87% | 4,173 | 49.00% | 7,903 | -23.13% | -3,730[lower-alpha 4] |
| Nash | 24.08% | 4,602 | 27.64% | 5,283 | 48.29% | 9,230 | -20.65% | -3,947[lower-alpha 4] |
| Chowan | 21.60% | 798 | 32.50% | 1,201 | 45.90% | 1,696 | -13.40% | -495[lower-alpha 4] |
| Craven | 21.77% | 2,991 | 30.86% | 4,240 | 47.37% | 6,509 | -16.51% | -2,269[lower-alpha 4] |
| Bladen | 20.79% | 1,746 | 32.80% | 2,754 | 46.41% | 3,897 | -13.61% | -1,143[lower-alpha 4] |
| Beaufort | 23.03% | 2,669 | 27.89% | 3,232 | 49.07% | 5,686 | -21.18% | -2,454[lower-alpha 4] |
| Halifax | 20.72% | 3,148 | 32.43% | 4,927 | 46.84% | 7,116 | -14.41% | -2,189[lower-alpha 4] |
| Granville | 21.50% | 1,837 | 30.87% | 2,638 | 47.64% | 4,071 | -16.77% | -1,433[lower-alpha 4] |
| Anson | 18.39% | 1,474 | 37.05% | 2,969 | 44.56% | 3,571 | -7.51% | -602[lower-alpha 4] |
| Vance | 19.84% | 2,252 | 33.94% | 3,852 | 46.21% | 5,244 | -12.27% | -1,392[lower-alpha 4] |
| Lenoir | 24.43% | 3,844 | 24.49% | 3,853 | 51.08% | 8,036 | -26.59% | -4,183[lower-alpha 4] |
| Northampton | 10.86% | 860 | 51.43% | 4,072 | 37.71% | 2,986 | 13.72% | 1,086[lower-alpha 4] |
| Duplin | 22.22% | 2,724 | 28.16% | 3,451 | 49.62% | 6,082 | -21.47% | -2,631[lower-alpha 4] |
| Warren | 14.79% | 796 | 42.60% | 2,293 | 42.62% | 2,294 | -0.02% | -1[lower-alpha 4] |
| Pasquotank | 18.84% | 1,430 | 33.78% | 2,564 | 47.39% | 3,597 | -13.61% | -1,033[lower-alpha 4] |
| Gates | 14.58% | 406 | 41.34% | 1,151 | 44.07% | 1,227 | -2.73% | -76[lower-alpha 4] |
| Caswell | 17.20% | 1,036 | 35.47% | 2,137 | 47.33% | 2,851 | -11.85% | -714[lower-alpha 4] |
| Pender | 17.76% | 1,007 | 34.26% | 1,942 | 47.98% | 2,720 | -13.72% | -778[lower-alpha 4] |
| Martin | 14.97% | 1,221 | 38.22% | 3,118 | 46.81% | 3,818 | -8.58% | -700[lower-alpha 4] |
| Bertie | 11.38% | 811 | 45.00% | 3,207 | 43.61% | 3,108 | 1.39% | 99[lower-alpha 4] |
| Perquimans | 15.37% | 468 | 33.60% | 1,023 | 51.03% | 1,554 | -17.44% | -531[lower-alpha 4] |
| Jones | 10.72% | 361 | 36.39% | 1,225 | 52.88% | 1,780 | -16.49% | -555[lower-alpha 4] |
| Franklin | 14.10% | 1,375 | 29.27% | 2,855 | 56.64% | 5,525 | -27.37% | -2,670[lower-alpha 4] |
| Currituck | 14.11% | 363 | 28.69% | 738 | 57.19% | 1,471 | -28.50% | -733[lower-alpha 4] |
| Greene | 12.71% | 650 | 30.49% | 1,560 | 56.80% | 2,906 | -26.31% | -1,346[lower-alpha 4] |
| Camden | 9.06% | 180 | 35.58% | 707 | 55.36% | 1,100 | -19.78% | -393[lower-alpha 4] |
Notes
- Although he was born in California and he served as a U.S. Senator from California, in 1968 Richard Nixon's official state of residence was New York, because he moved there to practice law after his defeat in the 1962 California gubernatorial election. During his first term as president, Nixon re-established his residency in California. Consequently, most reliable reference books list Nixon's home state as New York in the 1968 election and his home state as California in the 1972 (and 1960) election.
- Because Wallace ran second behind Nixon in North Carolina as a whole, all margins given are Nixon vote minus Wallace vote and Nixon percentage minus Wallace percentage unless noted otherwise for the county in question.
- In this county where Wallace did run third behind both Nixon and Humphrey, margin given is Nixon vote minus Humphrey vote and percentage margin Nixon percentage minus Humphrey percentage.
- In this county where Nixon ran third behind both Wallace and Humphrey, margin given is Humphrey vote minus Wallace vote and perentage magin Humphrey percentage minus Wallace percentage.
References
- Phillips, Kevin P.; The Emerging Republican Majority, pp. 219, 303 ISBN 978-0-691-16324-6
- See Etsy, Amos; ‘North Carolina Republicans and the Conservative Revolution, 1964-1968’; The North Carolina Historical Review, volume 82, number 1 (January 2005), pp. 1-32
- Phillips; The Emerging Republican Majority, p. 226
- Eamon, Tom; The Making of a Southern Democracy: North Carolina Politics from Kerr Scott to Pat McCrory, p. 123 ISBN 9781469606972
- Lehnen, Robert G.; ‘Stability of Presidential Choice in 1968: The Case of Two Southern States’; Social Science Quarterly, volume 51, no. 1 (June 1970), pp. 138-147
- Black, Earl; ‘The Militant Segregationist Vote in the Post-Brown South: A Comparative Analysis’; Social Science Quarterly, volume 54, no. 1 (June 1973), pp. 66-84
- Schönberger, Robert A. and Segal, David R.; ‘The Ecology of Dissent: The Southern Wallace Vote in 1968’; Midwest Journal of Political Science, volume 15, no. 3 (August 1971), pp. 583-586
- Phillips; The Emerging Republican Majority, p. 280
- Sullivan, Robert David; ‘How the Red and Blue Map Evolved Over the Past Century’; America Magazine in The National Catholic Review; June 29, 2016
- Leip, Dave (2005). "1968 Presidential General Election Results – North Carolina". US Election Atlas. Retrieved 22 July 2011.
- Our Campaigns; NC US President Race, November 03, 1968