2019 Bath and North East Somerset Council election
The 2019 Bath and North East Somerset Council election was held on 2 May 2019 to elect members of Bath and North East Somerset Council in England.
| |||||||||||||||||||||||||||||||||||||||||||||||||||||||||||||||||
All 59 seats to Bath and North East Somerset Council 30 seats needed for a majority | |||||||||||||||||||||||||||||||||||||||||||||||||||||||||||||||||
|---|---|---|---|---|---|---|---|---|---|---|---|---|---|---|---|---|---|---|---|---|---|---|---|---|---|---|---|---|---|---|---|---|---|---|---|---|---|---|---|---|---|---|---|---|---|---|---|---|---|---|---|---|---|---|---|---|---|---|---|---|---|---|---|---|---|
| |||||||||||||||||||||||||||||||||||||||||||||||||||||||||||||||||
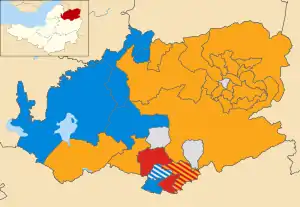 Map showing the results of the 2019 Bath and North East Somerset Council elections. Blue showing Conservative, Red showing Labour, Yellow showing Liberal Democrats and Grey showing Independents. Striped wards have mixed representation. | |||||||||||||||||||||||||||||||||||||||||||||||||||||||||||||||||
| |||||||||||||||||||||||||||||||||||||||||||||||||||||||||||||||||
.jpg.webp)
The Conservative Party took control of the council at the 2015 election, with thirty-seven members and a working majority of seven. At the 2019 election, the Conservative Party defended 36 seats, the Liberal Democrats defended 17 seats and the Labour Party defended six.
Background
Bath and North East Somerset Council held local elections on 2 May 2019 along with councils across England as part of the 2019 local elections. The council elects its members in all-out elections, with all its councillors up for election every four years.[1][2] Councillors defending their seats in this election were previously elected in 2015. In that election, thirty-seven Conservative councillors, fifteen Liberal Democrat councillors, six Labour councillors, five independent councillors and two Green councillors were elected. In subsequent by-elections, the Liberal Democrats gained one seat from the Conservatives and one seat from the Green Party.[3][4] Conservative councillor Martin Veal resigned from his party in March 2019 to run as an independent after his party did not select him as a candidate.[5]
Following the 2015 election, the council was controlled by the Conservative Party, although previously the council had been under no overall control since its creation in 1996. In the New Statesman, the journalist Stephen Bush wrote that if the Conservatives maintained control of Bath and North East Somerset in 2019, it would represent a strong national performance for the party.[6] Conservative peer Robert Hayward predicted that the Liberal Democrats would gain several seats on the council from the Conservatives due to a "Brexit penalty".[7][8]
A boundary change in 2018 meant that the number of councillors fell to 59 from the 65 under previous boundaries, and the number of electoral wards reduced from 37 to 33.[9] Most retained electoral wards have their boundaries adjusted so the number of electors per councillor is roughly similar.[10][11]
The election was contested by full slates of Conservatives and Liberal Democrats, with 49 Labour candidates, 29 Green Party candidates, 12 independent candidates (including one candidate with no description), 11 candidates for the Bath North East Somerset Independent Group, and five UK Independence Party candidates.[12] Two of the independent councillors re-elected in 2019 identified as "No politics, just Peasedown" when elected in 2015.[13]
Retiring councillors
| Council Ward | Departing Councillor | Party | Ref | |
|---|---|---|---|---|
| Abbey | Lizzie Gladwyn | Conservative | [14] | |
| Bathavon North | Alison Millar | Liberal Democrats | [14] | |
| Bathwick | Matt Cochrane | Conservative | [14] | |
| Steve Jeffries | Conservative | [14] | ||
| Chew Valley North | Liz Richardson | Conservative | [14] | |
| Combe Down | Cherry Beath | Liberal Democrats | [14] | |
| Keynsham East | Marie Longstaff | Conservative | [15] | |
| Bryan Organ | Conservative | [14] | ||
| Keynsham North | Charles Gerrish | Conservative | [14] | |
| Lambridge | Lin Patterson | Green | [14] | |
| Lansdown | Tony Clarke | Conservative | [14] | |
| Lyncombe | Michael Norton | Conservative | [14] | |
| Midsomer Norton North | Barry Macrae | Conservative | [14] | |
| Newbridge | Caroline Roberts | Liberal Democrats | [14] | |
| Oldfield | Will Sandry | Liberal Democrats | [14] | |
| Odd Down | Nigel Roberts | Liberal Democrats | [14] | |
| Saltford | Francine Haeberling | Conservative | [14] | |
| Twerton | Joe Rayment | Labour | [14] | |
| Walcot | Fiona Darey | Conservative | [14] | |
| Weston | Colin Barrett | Conservative | [14] | |
| Widcombe | Ian Gilchrist | Liberal Democrats | [14] | |
Council composition
After the previous election the composition of the council was:
| 37 | 15 | 6 | 3 | 2 | 2 |
| Con | LD | Lab | I | G | V |
Prior to the election the composition of the council was:
| 35 | 17 | 6 | 6 | 1 |
| Con | LD | Lab | I | G |
After the election the composition of the council was:
| 37 | 11 | 6 | 5 |
| LD | Con | I | Lab |
Results summary
| Bath and North East Somerset Council election, 2019[16] | |||||||||||||||
|---|---|---|---|---|---|---|---|---|---|---|---|---|---|---|---|
| Party | Candidates | Votes | |||||||||||||
| Stood | Elected | Gained | Unseated | Net | % of total | % | No. | Net % | |||||||
| Liberal Democrats | 59 | 37 | – | – | 62.7% | 43.7% | 42,682 | ||||||||
| Conservative | 59 | 11 | – | – | 18.6% | 25.0% | 24,460 | ||||||||
| Independent | 12 | 6 | – | – | 10.2% | 5.4% | 5,308 | ||||||||
| Labour | 49 | 5 | – | – | 8.5% | 12.6% | 12,340 | ||||||||
| Green | 29 | 0 | – | – | 0% | 9.3% | 9,114 | ||||||||
| BIG | 11 | 0 | – | – | 0% | 2.9% | 2,854 | N/A | |||||||
| UKIP | 5 | 0 | – | – | 0% | 1.0% | 998 | ||||||||
Ward results
Sitting councillors are marked with an asterisk (*).
Bathavon North
| Party | Candidate | Votes | % | ±% | |
|---|---|---|---|---|---|
| Liberal Democrats | Elizabeth Sarah Warren | 1,373 | 50.4 | +21.1 | |
| Liberal Democrats | Kevin Ronald Guy | 1,222 | – | ||
| Conservative | Geoff Ward * | 658 | 24.2 | –13.2 | |
| Conservative | Neil Auty | 575 | – | ||
| Green | Leila Jane Froud | 385 | 14.1 | –0.9 | |
| BIG | Emma Adams | 307 | 11.3 | N/A | |
| BIG | Andrew Lea | 273 | – | ||
| Independent | Martin John Beresford Veal * | 269 | 9.9 | N/A | |
| Labour Co-op | Vicky Drew | 157 | 5.8 | –7.0 | |
| Labour | Cydney Hippisley-Drew | 88 | – | ||
| Turnout | 2,737 | 51.63 | |||
| Registered electors | 5,301 | ||||
| Liberal Democrats gain from Conservative | Swing | ||||
| Liberal Democrats gain from Conservative | Swing | ||||
Bathavon South
| Party | Candidate | Votes | % | ±% | |
|---|---|---|---|---|---|
| Liberal Democrats | Trelawny Neilson Butters * | 1,121 | 53.2 | +5.6 | |
| Liberal Democrats | Matthew David McCabe | 901 | – | ||
| Conservative | Paul Gerald Mallon | 494 | 23.4 | –12.3 | |
| Conservative | Rosemary Naish | 474 | – | ||
| Green | Terry Pitt | 406 | 19.3 | +9.5 | |
| BIG | Lisa Tilesi | 239 | 11.3 | N/A | |
| No party description | David Veale * | 154 | 7.3 | N/A | |
| Labour | Alexander McCabe | 149 | 7.1 | +0.2 | |
| Turnout | 2,116 | 50.85 | |||
| Registered electors | 4,161 | ||||
| Liberal Democrats hold | Swing | ||||
| Liberal Democrats win (new seat) | |||||
Bathwick
| Party | Candidate | Votes | % | ±% | |
|---|---|---|---|---|---|
| Liberal Democrats | Manda Rigby | 1,183 | 53.1 | +24.5 | |
| Liberal Democrats | Yukteshwar Kumar | 1,077 | – | ||
| Conservative | Tom Hobson | 586 | 26.3 | –12.5 | |
| Conservative | Martin Reynold Roberto Grixoni | 558 | – | ||
| Green | Michael Coffey | 348 | 15.6 | –4.6 | |
| BIG | Evan Gregg Rudowski | 278 | 12.5 | N/A | |
| Labour | Johanna Maj Everritt | 134 | 6.0 | –6.4 | |
| Labour | Owen John Biggadike | 125 | – | ||
| Independent | Elie Jacques Charles Breton Des Loys | 37 | 1.7 | N/A | |
| Turnout | 2,237 | 46.19 | |||
| Registered electors | 4,843 | ||||
| Liberal Democrats gain from Conservative | Swing | ||||
| Liberal Democrats gain from Conservative | Swing | ||||
Chew Valley
| Party | Candidate | Votes | % | ±% | |
|---|---|---|---|---|---|
| Conservative | Victor Lewis Pritchard * | 926 | 50.7 | N/A | |
| Conservative | Karen Ruth Warrington * | 717 | – | ||
| Liberal Democrats | Nicola Emma Sewell | 543 | 29.7 | N/A | |
| Liberal Democrats | Amy Fortnam | 486 | – | ||
| Green | David Guy Parkes | 421 | 23.1 | N/A | |
| Labour | Helen Stockwell | 184 | 10.1 | N/A | |
| Turnout | 1,847 | 39.47 | N/A | ||
| Registered electors | 4,680 | ||||
| Conservative win (new seat) | |||||
| Conservative win (new seat) | |||||
Clutton & Farmborough
| Party | Candidate | Votes | % | ±% | |
|---|---|---|---|---|---|
| Conservative | Sally Davis * | 381 | 41.2 | N/A | |
| Liberal Democrats | Ann Margaret Morgan | 257 | 27.8 | N/A | |
| Green | Sam Ross | 234 | 25.3 | N/A | |
| Labour | Alison Mary Simpson | 52 | 5.6 | N/A | |
| Majority | 124 | 13.4 | N/A | ||
| Turnout | 935 | 39.70 | N/A | ||
| Registered electors | 2,355 | ||||
| Conservative win (new seat) | |||||
Combe Down
| Party | Candidate | Votes | % | ±% | |
|---|---|---|---|---|---|
| Liberal Democrats | Bharat Ramji Nathoo Pankhania | 927 | 42.4 | +8.1 | |
| Liberal Democrats | Gerry Curran | 800 | – | ||
| Conservative | Bob Goodman * | 733 | 33.5 | +5.8 | |
| Conservative | Steve Merrifield | 562 | – | ||
| Green | David Charles Andrews | 487 | 22.3 | +2.2 | |
| BIG | Nola Edwards | 376 | 17.2 | N/A | |
| Labour | Tom Pymer | 151 | 6.9 | –4.0 | |
| Labour | Liz Vincent | 146 | – | ||
| Turnout | 2,197 | 47.64 | |||
| Registered electors | 4,612 | ||||
| Liberal Democrats hold | Swing | ||||
| Liberal Democrats gain from Conservative | Swing | ||||
High Littleton
| Party | Candidate | Votes | % | ±% | |
|---|---|---|---|---|---|
| Liberal Democrats | Ryan David Wills | 595 | 57.8 | +41.5 | |
| Conservative | Leslie John Kew * | 320 | 31.1 | –32.1 | |
| Green | Pat Roscow | 67 | 6.5 | –14.0 | |
| Labour | Judith Patricia Brown | 48 | 4.7 | N/A | |
| Majority | 275 | 26.7 | N/A | ||
| Turnout | 1,038 | 43.61 | |||
| Registered electors | 2,380 | ||||
| Liberal Democrats gain from Conservative | Swing | ||||
Keynsham East
| Party | Candidate | Votes | % | ±% | |
|---|---|---|---|---|---|
| Liberal Democrats | Andy Wait | 1,084 | 54.6 | +31.8 | |
| Liberal Democrats | Hal MacFie | 1,038 | – | ||
| Conservative | Matthew Paul Blankley | 584 | 29.4 | –20.2 | |
| Conservative | Jayne Smith | 574 | – | ||
| BIG | Melanie Hilton | 238 | 12.0 | N/A | |
| Labour | John Brian Wood | 160 | 8.1 | –6.7 | |
| Labour | Keith Burchell | 135 | – | ||
| Turnout | 1,997 | 44.95 | |||
| Registered electors | 4,443 | ||||
| Liberal Democrats gain from Conservative | Swing | ||||
| Liberal Democrats gain from Conservative | Swing | ||||
Keynsham North
| Party | Candidate | Votes | % | ±% | |
|---|---|---|---|---|---|
| Conservative | Brian Simmons * | 600 | 40.5 | –6.3 | |
| Conservative | Victor John Clarke | 541 | – | ||
| Labour | Andy McGuinness | 398 | 26.9 | +7.1 | |
| Labour | Jonathan Samuel Wallcroft | 394 | – | ||
| Liberal Democrats | Olivia Leydenfrost | 343 | 23.2 | +17.7 | |
| Liberal Democrats | Clive Kenneth Dellard | 323 | – | ||
| UKIP | Steve Grimes | 171 | 11.5 | –2.7 | |
| Turnout | 1,485 | 34.22 | |||
| Registered electors | 4,339 | ||||
| Conservative hold | Swing | ||||
| Conservative hold | Swing | ||||
Keynsham South
| Party | Candidate | Votes | % | ±% | |
|---|---|---|---|---|---|
| Conservative | Alan Dudley Hale * | 670 | 42.9 | +2.6 | |
| Conservative | Lisa O'Brien * | 464 | – | ||
| Labour | David William Biddleston | 437 | 28.0 | +0.5 | |
| Labour | Joan Liley | 299 | – | ||
| Green | Fiona Mary Edwards | 283 | 18.1 | +10.0 | |
| BIG | Jessica Tamsin Milton | 210 | 13.5 | N/A | |
| Liberal Democrats | Claire Veronica Jackson | 180 | 11.5 | +2.1 | |
| UKIP | Nathan Lerway | 175 | 11.2 | –3.5 | |
| Liberal Democrats | Rosemary Rea Todd | 131 | – | ||
| Turnout | 1,568 | 31.35 | |||
| Registered electors | 5,002 | ||||
| Conservative hold | Swing | ||||
| Conservative hold | Swing | ||||
Kingsmead
| Party | Candidate | Votes | % | ±% | |
|---|---|---|---|---|---|
| Liberal Democrats | Sue Craig * | 721 | 45.7 | +14.5 | |
| Liberal Democrats | Andy Furse * | 664 | – | ||
| Labour | Sharon Louise Gillings | 421 | 26.7 | +13.7 | |
| Green | Eric Lucas | 294 | 18.6 | –3.8 | |
| Labour | Mike Midgley | 272 | – | ||
| Conservative | Oliver Hamish Thomas Dudley | 230 | 14.6 | –13.5 | |
| Conservative | Peter Joseph Michael Turner * | 213 | – | ||
| BIG | Molly Martha Conisbee | 179 | 11.3 | N/A | |
| Turnout | 1,589 | 38.85 | |||
| Registered electors | 4,090 | ||||
| Liberal Democrats hold | Swing | ||||
| Liberal Democrats gain from Conservative | Swing | ||||
Lambridge
| Party | Candidate | Votes | % | ±% | |
|---|---|---|---|---|---|
| Liberal Democrats | Joanna Wright | 1,050 | 46.3 | +23.1 | |
| Liberal Democrats | Rob Appleyard * | 1,025 | – | ||
| Green | Fay Emily Veare Whitfield | 544 | 24.0 | –1.3 | |
| Labour Co-op | Lesley Kathleen Bees | 453 | 20.0 | +6.3 | |
| Labour Co-op | Jane Alice Samson | 395 | – | ||
| Conservative | Emily Jane Peacock | 313 | 13.8 | –8.7 | |
| Conservative | Mark Patrick Mac Donnell | 301 | – | ||
| BIG | Paula Malone | 250 | 11.0 | N/A | |
| Turnout | 2,278 | 52.34 | |||
| Registered electors | 4,352 | ||||
| Liberal Democrats hold | Swing | ||||
| Liberal Democrats gain from Green | Swing | ||||
Lansdown
| Party | Candidate | Votes | % | ±% | |
|---|---|---|---|---|---|
| Liberal Democrats | Lucy Jane Hodge | 1,151 | 55.1 | +37.0 | |
| Liberal Democrats | Mark William Elliott | 1,028 | – | ||
| Conservative | Manuel Emilio Pimentel-Reid | 553 | 26.5 | –22.7 | |
| Conservative | Andrew Edwin Charles Pattie | 532 | – | ||
| Green | Jonathan Oates | 301 | 14.4 | –7.0 | |
| BIG | Stephen Richard Arthur Taylor | 301 | 14.4 | N/A | |
| Labour | Rosemary Joan Sansome | 158 | 7.6 | –3.7 | |
| Turnout | 2,098 | 50.20 | |||
| Registered electors | 4,179 | ||||
| Liberal Democrats gain from Conservative | Swing | ||||
| Liberal Democrats gain from Conservative | Swing | ||||
Mendip
| Party | Candidate | Votes | % | ±% | |
|---|---|---|---|---|---|
| Liberal Democrats | David Wood | 806 | 67.0 | +52.1 | |
| Conservative | Tim Warren * | 338 | 28.1 | –35.7 | |
| Labour | Howard Ian Simpson | 59 | 4.9 | N/A | |
| Majority | 468 | 38.9 | N/A | ||
| Turnout | 1,210 | 54.07 | |||
| Registered electors | 2,238 | ||||
| Liberal Democrats gain from Conservative | Swing | ||||
Midsomer Norton North
| Party | Candidate | Votes | % | ±% | |
|---|---|---|---|---|---|
| Independent | Shaun Hughes | 436 | 34.3 | N/A | |
| Conservative | Michael Evans * | 413 | 32.5 | –13.1 | |
| Liberal Democrats | Edward Michael Jakins | 283 | 22.3 | +14.3 | |
| Liberal Democrats | Ben Stevens | 271 | – | ||
| Conservative | Ben Warren | 247 | – | ||
| Labour Co-op | Andrew Barnes | 234 | 18.4 | –10.4 | |
| Labour Co-op | Fflyff McLaren | 209 | – | ||
| Green | Grace Wiltshire | 208 | 16.4 | +3.4 | |
| Turnout | 1,284 | 30.00 | |||
| Registered electors | 4,280 | ||||
| Independent gain from Conservative | Swing | ||||
| Conservative hold | Swing | ||||
Midsomer Norton Redfield
| Party | Candidate | Votes | % | ±% | |
|---|---|---|---|---|---|
| Conservative | Paul Myers * | 817 | 57.4 | +9.7 | |
| Conservative | Chris Watt * | 654 | 45.9 | ||
| Independent | John Edward Terry Baker | 295 | 20.7 | N/A | |
| Labour | Lauren Barnes | 288 | 20.2 | –5.7 | |
| Green | Vicki Gait | 268 | 18.8 | +1.5 | |
| Liberal Democrats | Gitte Dawson | 133 | 9.3 | +0.2 | |
| Liberal Democrats | Alice Ekrek Hovanessian | 96 | – | ||
| Turnout | 1,433 | 30.42 | |||
| Registered electors | 4,711 | ||||
| Conservative hold | Swing | ||||
| Conservative hold | Swing | ||||
Moorlands
| Party | Candidate | Votes | % | ±% | |
|---|---|---|---|---|---|
| Liberal Democrats | Jess David | 639 | 61.3 | N/A | |
| Conservative | Paul Francis Cobden Massey | 165 | 15.8 | N/A | |
| Labour | Lesley Benita Hall | 141 | 13.5 | N/A | |
| Green | Tim Beadle | 98 | 9.4 | N/A | |
| Majority | 474 | 45.4 | N/A | ||
| Turnout | 1,051 | 43.00 | N/A | ||
| Registered electors | 2,444 | ||||
| Liberal Democrats win (new seat) | |||||
Newbridge
| Party | Candidate | Votes | % | ±% | |
|---|---|---|---|---|---|
| Liberal Democrats | Michelle O'Doherty * | 1,439 | 64.4 | +39.4 | |
| Liberal Democrats | Mark Roper | 1,153 | – | ||
| Conservative | Loraine Morgan-Brinkhurst | 580 | 26.0 | –1.2 | |
| Conservative | David Miller Workman | 460 | – | ||
| Green | Dick Daniel | 353 | 15.8 | –3.2 | |
| Labour | Maggy White | 140 | 6.3 | –7.7 | |
| Labour | Ashley James Lewis | 134 | – | ||
| Turnout | 2,248 | 47.16 | |||
| Registered electors | 4,767 | ||||
| Liberal Democrats hold | Swing | ||||
| Liberal Democrats gain from Conservative | Swing | ||||
Odd Down
| Party | Candidate | Votes | % | ±% | |
|---|---|---|---|---|---|
| Liberal Democrats | Steve Hedges* | 1,095 | 54.5 | +16.9 | |
| Liberal Democrats | Joel Edwin Hirst | 1,028 | – | ||
| Green | Kathy Anne Beadle | 508 | 25.3 | +9.8 | |
| Green | Dom Tristram | 418 | – | ||
| Labour | Paul Robert Purnell | 316 | 15.7 | +1.5 | |
| Conservative | Michael James Clarkson | 260 | 12.9 | –8.2 | |
| Conservative | Alastair James Thompson | 238 | – | ||
| Turnout | 2,024 | 39.42 | |||
| Registered electors | 5,134 | ||||
| Liberal Democrats hold | Swing | ||||
| Liberal Democrats hold | Swing | ||||
Oldfield Park
| Party | Candidate | Votes | % | ±% | |
|---|---|---|---|---|---|
| Liberal Democrats | Shaun Andrew Stephenson-McGall * | 759 | 73.8 | N/A | |
| Conservative | Brian John Webber | 108 | 10.5 | N/A | |
| Green | Olivia Grace Fitzgerald | 97 | 9.4 | N/A | |
| Labour | Vanessa Ann Jessop | 64 | 6.2 | N/A | |
| Majority | 651 | 63.3 | N/A | ||
| Turnout | 1,034 | 48.25 | N/A | ||
| Registered electors | 2,143 | ||||
| Liberal Democrats win (new seat) | |||||
Paulton
| Party | Candidate | Votes | % | ±% | |
|---|---|---|---|---|---|
| Labour | Liz Hardman * | 808 | 62.3 | +30.3 | |
| Labour | Grant Johnson | 630 | – | ||
| Independent | Jeff Humphries | 272 | 21.0 | N/A | |
| Conservative | John Duddy | 177 | 13.7 | –9.4 | |
| UKIP | Ian Edmund Kealey | 177 | 13.7 | –2.4 | |
| Conservative | Muriel Megan Harris | 167 | – | ||
| Liberal Democrats | Zoe Louise Bushell | 112 | 8.6 | +4.8 | |
| Liberal Democrats | Debra Julie Ballington | 78 | – | ||
| Turnout | 1,308 | 28.68 | |||
| Registered electors | 4,560 | ||||
| Labour hold | Swing | ||||
| Labour hold | Swing | ||||
Peasedown
| Party | Candidate | Votes | % | ±% | |
|---|---|---|---|---|---|
| Independent | Sarah Frances Bevan * | 835 | 50.2 | N/A | |
| Independent | Karen Francine Walker * | 791 | 47.5 | N/A | |
| Conservative | Jo Davis | 380 | 22.8 | +1.1 | |
| Conservative | Kathy Thomas | 331 | – | ||
| Labour | Jonathan Paul Rich | 250 | 15.0 | –6.7 | |
| Green | David John König | 182 | 10.9 | +3.9 | |
| Liberal Democrats | Ray Love | 177 | 10.6 | –0.8 | |
| Labour | Vincent Michael Cox | 157 | – | ||
| Liberal Democrats | Adam William John Reynolds | 93 | – | ||
| Turnout | 1,674 | 33.52 | |||
| Registered electors | 4,994 | ||||
| Independent gain from Village Voice | Swing | ||||
| Independent gain from Village Voice | Swing | ||||
Publow with Whitchurch
| Party | Candidate | Votes | % | ±% | |
|---|---|---|---|---|---|
| Conservative | Paul May * | 470 | 59.6 | –6.8 | |
| Green | Steve Day | 143 | 18.1 | –1.2 | |
| Labour | Julian Alexander Woonton | 121 | 15.4 | N/A | |
| Liberal Democrats | Meghan Amber Jones | 54 | 6.9 | –7.3 | |
| Majority | 327 | 41.5 | –5.6 | ||
| Turnout | 797 | 37.59 | |||
| Registered electors | 2,120 | ||||
| Conservative hold | Swing | ||||
Radstock
| Party | Candidate | Votes | % | ±% | |
|---|---|---|---|---|---|
| Labour Co-op | Christopher John Dando * | 428 | 27.9 | –2.1 | |
| Liberal Democrats | Bruce Andrew Shearn | 417 | 27.2 | +6.6 | |
| Labour Co-op | Lesley Ann Mansell | 383 | – | ||
| Conservative | Rupert Stephen Jude Bevan | 317 | 20.7 | –1.6 | |
| Independent | Mike Boulton | 295 | 19.2 | N/A | |
| Green | Rob Carter | 289 | 18.8 | +4.9 | |
| Liberal Democrats | Toby Simon | 272 | – | ||
| UKIP | Philip Michael Allen | 234 | 15.2 | N/A | |
| Conservative | Deirdre Mary Horstmann * | 220 | – | ||
| Turnout | 1,538 | 35.07 | |||
| Registered electors | 4,385 | ||||
| Labour Co-op hold | Swing | ||||
| Liberal Democrats gain from Conservative | Swing | ||||
Saltford
| Party | Candidate | Votes | % | ±% | |
|---|---|---|---|---|---|
| Liberal Democrats | Duncan Stuart Hounsell | 1,124 | 54.3 | +27.4 | |
| Liberal Democrats | Alastair Graham Singleton | 944 | – | ||
| Conservative | Emma Clare Dixon * | 775 | 37.4 | –2.6 | |
| Conservative | Elizabeth Mary Alice Carter | 724 | – | ||
| Green | Antony Stuart Dobson | 241 | 11.6 | +0.3 | |
| Labour | John Anthony Bull * | 139 | 6.7 | –3.8 | |
| Turnout | 2,085 | 42.78 | |||
| Registered electors | 4,874 | ||||
| Liberal Democrats gain from Conservative | Swing | ||||
| Liberal Democrats gain from Conservative | Swing | ||||
Southdown
| Party | Candidate | Votes | % | ±% | |
|---|---|---|---|---|---|
| Liberal Democrats | Dine Romero * | 1,119 | 59.1 | +23.1 | |
| Liberal Democrats | Paul Nigel Crossley * | 1,019 | – | ||
| Green | Jon Lucas | 493 | 26.0 | +14.1 | |
| Labour | David William Musgrave | 407 | 21.5 | +9.0 | |
| Conservative | Patrick Anketell-Jones * | 243 | 12.8 | –10.5 | |
| Conservative | Lindsay Sally Whitmore | 222 | – | ||
| Turnout | 1,909 | 37.84 | |||
| Registered electors | 5,045 | ||||
| Liberal Democrats hold | Swing | ||||
| Liberal Democrats hold | Swing | ||||
Timsbury
| Party | Candidate | Votes | % | ±% | |
|---|---|---|---|---|---|
| Independent | Douglas Eric Deacon * | 448 | 59.3 | +13.4 | |
| Conservative | Allan Melville Sinclair | 115 | 15.2 | –7.2 | |
| Liberal Democrats | Sean Robert Stephenson-McGall | 102 | 13.5 | +2.6 | |
| Labour Co-op | Chris Reddy | 91 | 12.0 | –0.5 | |
| Majority | 333 | 44.2 | +20.7 | ||
| Turnout | 759 | 37.21 | |||
| Registered electors | 2,040 | ||||
| Independent hold | Swing | ||||
Twerton
| Party | Candidate | Votes | % | ±% | |
|---|---|---|---|---|---|
| Liberal Democrats | Tim Ball * | 886 | 66.4 | +32.8 | |
| Liberal Democrats | Sarah Moore | 764 | – | ||
| Labour | Rachel Willis | 312 | 23.4 | +1.8 | |
| Labour | Cameron Standring | 250 | – | ||
| Green | Iona Everett | 146 | 10.9 | –7.6 | |
| Conservative | Max Seal | 90 | 6.7 | –6.6 | |
| Conservative | Jordan Edwards | 75 | – | ||
| Turnout | 1,344 | 28.93 | |||
| Registered electors | 4,645 | ||||
| Liberal Democrats hold | Swing | ||||
| Liberal Democrats gain from Labour | Swing | ||||
Walcot
| Party | Candidate | Votes | % | ±% | |
|---|---|---|---|---|---|
| Liberal Democrats | Richard Emlyn Samuel * | 1,050 | 58.6 | +21.2 | |
| Liberal Democrats | Tom Davies | 930 | – | ||
| Green | Tim Morgan | 469 | 26.2 | +4.4 | |
| Labour | Nathan Stanley Russell | 284 | 15.8 | +1.2 | |
| Conservative | Isobel Mary Blackburn | 254 | 14.2 | –8.3 | |
| Conservative | Stuart Laurence Kay | 242 | – | ||
| Labour | Paul Tom Edward Tucker | 225 | – | ||
| Turnout | 1,807 | 42.43 | |||
| Registered electors | 4,259 | ||||
| Liberal Democrats hold | Swing | ||||
| Liberal Democrats gain from Conservative | Swing | ||||
Westfield
| Party | Candidate | Votes | % | ±% | |
|---|---|---|---|---|---|
| Labour | Robin Moss * | 479 | 44.9 | +16.4 | |
| Labour | Eleanor Margaret Jackson * | 461 | – | ||
| Green | Christian Michael Wach | 247 | 14.0 | +6.7 | |
| UKIP | Michael David Hooper | 241 | 13.6 | –5.8 | |
| Conservative | Margaret Rose Brewer | 183 | 17.2 | –1.2 | |
| Conservative | Katharine Sara Simmons | 154 | – | ||
| Liberal Democrats | Sharon Grace Ball | 95 | 8.9 | +1.6 | |
| Liberal Democrats | Belinda Mary Gornall | 75 | – | ||
| Turnout | 1,072 | 22.62 | |||
| Registered electors | 4,733 | ||||
| Labour hold | Swing | ||||
| Labour hold | Swing | ||||
Westmoreland
| Party | Candidate | Votes | % | ±% | |
|---|---|---|---|---|---|
| Independent | June Player * | 874 | 59.2 | +22.8 | |
| Independent | Colin David Blackburn * | 602 | 40.8 | +18.9 | |
| Liberal Democrats | Jonathan David Adcock | 445 | 30.1 | +13.5 | |
| Liberal Democrats | Sam Campling | 391 | – | ||
| Green | Jo Williams | 219 | 14.8 | –6.8 | |
| Labour Co-op | Brad Baines | 134 | 9.1 | –4.5 | |
| Conservative | Susan Gillian Henley Green | 83 | 5.6 | –6.7 | |
| Conservative | Lyn Jacobs | 63 | – | ||
| Turnout | 1,476 | 38.36 | |||
| Registered electors | 3,848 | ||||
| Independent hold | Swing | ||||
| Independent hold | Swing | ||||
Weston
| Party | Candidate | Votes | % | ±% | |
|---|---|---|---|---|---|
| Liberal Democrats | Shelley Bromley | 1,216 | 54.3 | +35.4 | |
| Liberal Democrats | Ruth Madeleine Malloy | 1,138 | – | ||
| Conservative | Matthew Paul Davies * | 603 | 26.9 | –6.2 | |
| Conservative | Alison Peters Sandeman | 535 | – | ||
| Green | Lisa Loveridge | 355 | 15.8 | –0.3 | |
| BIG | Guy Edward Ian Hodgson | 203 | 9.1 | N/A | |
| Labour | Tamsin Egan | 201 | 9.0 | –2.1 | |
| Turnout | 2,251 | 50.21 | |||
| Registered electors | 4,483 | ||||
| Liberal Democrats gain from Conservative | Swing | ||||
| Liberal Democrats gain from Conservative | Swing | ||||
Widcombe & Lyncombe
| Party | Candidate | Votes | % | ±% | |
|---|---|---|---|---|---|
| Liberal Democrats | Alison Patricia Sian Born | 1,852 | 67.6 | N/A | |
| Liberal Democrats | Peter Winston Gordon Duguid | 1,404 | – | ||
| Conservative | Mark Grosvenor McNeill Shelford * | 632 | 23.1 | N/A | |
| Green | Adam James Ley-Lange | 610 | 22.3 | N/A | |
| Conservative | Jasper Martin Becker * | 566 | – | ||
| Labour | Mary Patricia Flitton | 239 | 8.7 | N/A | |
| Turnout | 2,758 | 56.09 | N/A | ||
| Registered electors | 4,917 | ||||
| Liberal Democrats win (new seat) | |||||
| Liberal Democrats win (new seat) | |||||
References
- "Local government structure and elections". GOV.UK. Retrieved 27 April 2018.
- "Election Timetable in England" (PDF).
- Crawley, James (5 May 2017). "The Newbridge by-election result is in". bathchronicle. Retrieved 11 March 2019.
- Sumner, Stephen (6 July 2018). "Result of Bath city centre by-election declared". somersetlive. Retrieved 11 March 2019.
- Sumner, Stephen; Bingham, Eddie (22 March 2019). "Lifelong Tory councillor quits party just before election". somersetlive. Retrieved 27 March 2019.
- "What would be a good night for the Conservatives in the 2019 local elections?". www.newstatesman.com. Retrieved 29 March 2019.
- "May To Pay 'Brexit Penalty' In Local Elections, Pollster Warns". HuffPost UK. 8 April 2019. Retrieved 9 April 2019.
- Bloom, Dan (8 April 2019). "Brexit chaos 'penalty' set to hit Tories hard in the local elections". mirror. Retrieved 9 April 2019.
- "Current and New Wards list" (PDF). Bath and North East Somerset Council. Retrieved 26 April 2019.
- "Boundary Review 2018". Bath and North East Somerset Council. Retrieved 24 April 2019.
- "Bath & North East Somerset". Local Government Boundary Commission for England. 2018. Retrieved 24 April 2019.
- Sumner, Stephen (5 April 2019). "The candidates you can vote for in the upcoming BANES election". somersetlive. Retrieved 10 April 2019.
- "Election results for Peasedown". Bath and North East Somerset Council. 8 May 2015. Retrieved 3 May 2019.
- Sumner, Stepehen (11 April 2019). "Meet the 20 Bath and North East Somerset councillors who are stepping down from public duty". Somerset Live. Reach plc. Retrieved 17 May 2020.
- "Meet the candidates hoping to win a seat at the Guildhall with your votes". Keynsham Voice (86). Keynsham, Somerset. May 2019. p. 15. Retrieved 17 May 2020.
- "Bath & North East Somerset (All Wards) - Thursday, 2nd May, 2019". Bath and North East Somerset Council. 3 May 2019. Retrieved 3 May 2019.
- "Election results for Bathavon North". Bath and North East Somerset Council. Retrieved 20 April 2020.
- "Election results for Bathavon South". Bath and North East Somerset Council. Retrieved 20 April 2020.
- "Election results for Bathwick". Bath and North East Somerset Council. Retrieved 20 April 2020.
- "Election results for Chew Valley". Bath and North East Somerset Council. Retrieved 20 April 2020.
- "Election results for Clutton & Farmborough". Bath and North East Somerset Council. Retrieved 20 April 2020.
- "Election results for Combe Down". Bath and North East Somerset Council. Retrieved 20 April 2020.
- "Election results for High Littleton". Bath and North East Somerset Council. Retrieved 20 April 2020.
- "Election results for Keynsham East". Bath and North East Somerset Council. Retrieved 20 April 2020.
- "Election results for Keynsham North". Bath and North East Somerset Council. Retrieved 20 April 2020.
- "Election results for Keynsham South". Bath and North East Somerset Council. Retrieved 20 April 2020.
- "Election results for Kingsmead". Bath and North East Somerset Council. Retrieved 20 April 2020.
- "Election results for Lambridge". Bath and North East Somerset Council. Retrieved 20 April 2020.
- "Election results for Lansdown". Bath and North East Somerset Council. Retrieved 20 April 2020.
- "Election results for Mendip". Bath and North East Somerset Council. Retrieved 20 April 2020.
- "Election results for Midsomer Norton North". Bath and North East Somerset Council. Retrieved 20 April 2020.
- "Election results for Midsomer Norton Redfield". Bath and North East Somerset Council. Retrieved 20 April 2020.
- "Election results for Moorlands". Bath and North East Somerset Council. Retrieved 20 April 2020.
- "Election results for Newbridge". Bath and North East Somerset Council. Retrieved 20 April 2020.
- "Election results for Odd Down". Bath and North East Somerset Council. Retrieved 20 April 2020.
- "Election results for Oldfield Park". Bath and North East Somerset Council. Retrieved 20 April 2020.
- "Election results for Paulton". Bath and North East Somerset Council. Retrieved 20 April 2020.
- "Election results for Peasedown". Bath and North East Somerset Council. Retrieved 20 April 2020.
- "Election results for Publow with Whitchurch". Bath and North East Somerset Council. Retrieved 20 April 2020.
- "Election results for Radstock". Bath and North East Somerset Council. Retrieved 20 April 2020.
- "Election results for Saltford". Bath and North East Somerset Council. Retrieved 20 April 2020.
- "Election results for Southdown". Bath and North East Somerset Council. Retrieved 20 April 2020.
- "Election results for Timsbury". Bath and North East Somerset Council. Retrieved 20 April 2020.
- "Election results for Twerton". Bath and North East Somerset Council. Retrieved 20 April 2020.
- "Election results for Walcot". Bath and North East Somerset Council. Retrieved 20 April 2020.
- "Election results for Westfield". Bath and North East Somerset Council. Retrieved 20 April 2020.
- "Election results for Westmoreland". Bath and North East Somerset Council. Retrieved 20 April 2020.
- "Election results for Weston". Bath and North East Somerset Council. Retrieved 20 April 2020.
- "Election results for Widcombe & Lyncombe". Bath and North East Somerset Council. Retrieved 20 April 2020.
| Somerset County Council | |
|---|---|
| Bath and North East Somerset Council | |
| Mendip District Council | |
| North Somerset Council | |
| Sedgemoor District Council | |
| South Somerset District Council | |
| Somerset West and Taunton District Council | |
| Avon County Council |
|
| Bath City Council | |
| Taunton Deane Borough Council | |
| Wansdyke District Council |
|
| West Somerset District Council | |
| West of England Mayor | |
| |