2019 Knowsley Metropolitan Borough Council election
The 2019 Knowsley Metropolitan Borough Council election took place on 2 May 2019 to elect members of Knowsley Metropolitan Borough Council in England.[2] This election was held on the same day as other local elections.
| |||||||||||||||||||||||||||||||||||||||||||||||||||||||||||||||||
15 of 45 seats (One Third) to Knowsley Metropolitan Borough Council 23 seats needed for a majority | |||||||||||||||||||||||||||||||||||||||||||||||||||||||||||||||||
|---|---|---|---|---|---|---|---|---|---|---|---|---|---|---|---|---|---|---|---|---|---|---|---|---|---|---|---|---|---|---|---|---|---|---|---|---|---|---|---|---|---|---|---|---|---|---|---|---|---|---|---|---|---|---|---|---|---|---|---|---|---|---|---|---|---|
| Turnout | 23.7% ( | ||||||||||||||||||||||||||||||||||||||||||||||||||||||||||||||||
| |||||||||||||||||||||||||||||||||||||||||||||||||||||||||||||||||
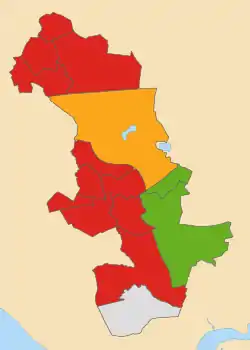 Map of results of 2019 election | |||||||||||||||||||||||||||||||||||||||||||||||||||||||||||||||||
| |||||||||||||||||||||||||||||||||||||||||||||||||||||||||||||||||
After the election, the composition of the council was:
| Party | Seats | ± | |
|---|---|---|---|
| Labour | 37 | -3 | |
| Green | 3 | +2 | |
| Liberal Democrat | 3 | ±0 | |
| Independent | 2 | +1 | |
| Source: The Guardian[3] | |||
Election results
Overall election result
Overall result compared with 2018.
| 2019 Knowsley Metropolitan Borough Council election | ||||||||||
|---|---|---|---|---|---|---|---|---|---|---|
| Party | This election | Full council | This election | |||||||
| Seats | Net | Seats % | Other | Total | Total % | Votes | Votes % | +/− | ||
| Labour | 11 | 73.3 | 26 | 37 | 82.2 | 15,877 | 58.4 | –7.8 | ||
| Green | 2 | 13.3 | 1 | 3 | 6.7 | 5,665 | 20.9 | +8.5 | ||
| Liberal Democrats | 1 | 6.7 | 2 | 3 | 6.7 | 1,589 | 5.8 | –1.0 | ||
| Independent | 1 | 6.7 | 1 | 2 | 4.4 | 2,040 | 7.5 | ±0.0 | ||
| Conservative | 0 | 0.0 | 0 | 0 | 0.0 | 1,754 | 6.5 | +1.1 | ||
| Socialist Alternative | 0 | 0.0 | 0 | 0 | 0.0 | 242 | 0.9 | +0.4 | ||

Knowsley Metropolitan Borough Council composition after the 2019 election[4]
Ward results
Cherryfield
| Party | Candidate | Votes | % | ±% | |
|---|---|---|---|---|---|
| Labour | Jayne Aston | 1,089 | 71.0 | -11.0 | |
| Green | Michael Dooley | 375 | 24.5 | +12.9 | |
| Conservative | Ken Wilson | 69 | 4.5 | -1.9 | |
| Majority | 714 | 46.6 | -23.8 | ||
| Turnout | 1,550 | 18.9 | -1.4 | ||
| Rejected ballots | 17 | 1.1 | +0.7 | ||
| Labour hold | Swing | -12.0 | |||
Halewood North
| Party | Candidate | Votes | % | ±% | |
|---|---|---|---|---|---|
| Labour | Shelley Powell | 1,071 | 54.4 | -12.1 | |
| Independent | Eric McIntosh | 771 | 39.2 | +18.3 | |
| Conservative | Mark Thomas | 127 | 6.4 | N/A | |
| Majority | 300 | 15.2 | -30.3 | ||
| Turnout | 1,984 | 23.9 | -2.1 | ||
| Rejected ballots | 15 | 0.8 | +0.3 | ||
| Labour hold | Swing | -15.2 | |||
Halewood South
| Party | Candidate | Votes | % | ±% | |
|---|---|---|---|---|---|
| Independent | Barbara Dunn | 1,267 | 53.9 | +6.6 | |
| Labour | Gary See | 1,007 | 42.8 | -3.0 | |
| Conservative | Adam Galloway | 77 | 3.3 | -3.6 | |
| Majority | 260 | 11.1 | +9.5 | ||
| Turnout | 2,360 | 29.2 | -2.9 | ||
| Rejected ballots | 9 | 0.4 | +0.1 | ||
| Independent gain from Labour | Swing | +4.8 | |||
Northwood
| Party | Candidate | Votes | % | ±% | |
|---|---|---|---|---|---|
| Labour | Marie Stuart | 1,154 | 76.0 | -10.5 | |
| Green | Russell Greenway | 296 | 19.5 | +6.0 | |
| Conservative | Pamela Turner | 69 | 4.5 | N/A | |
| Majority | 858 | 56.5 | -16.5 | ||
| Turnout | 1,539 | 18.3 | -1.6 | ||
| Rejected ballots | 20 | 1.3 | +0.8 | ||
| Labour hold | Swing | -8.3 | |||
Page Moss
| Party | Candidate | Votes | % | ±% | |
|---|---|---|---|---|---|
| Labour | Del Arnall | 1,027 | 69.2 | -10.9 | |
| Green | John Carine | 382 | 25.7 | +5.8 | |
| Conservative | Andrew Copplestone | 76 | 5.1 | N/A | |
| Majority | 645 | 43.4 | -16.7 | ||
| Turnout | 1,497 | 18.8 | +0.1 | ||
| Rejected ballots | 12 | 0.8 | |||
| Labour hold | Swing | -8.4 | |||
Prescot North
| Party | Candidate | Votes | % | ±% | |
|---|---|---|---|---|---|
| Liberal Democrats | Ian Smith | 1,364 | 59.9 | -0.4 | |
| Labour | Tony Ely | 790 | 34.7 | +0.4 | |
| Conservative | Gary McCormick | 123 | 5.4 | ||
| Majority | 574 | 25.2 | -0.8 | ||
| Turnout | 2,322 | 30.0 | -0.1 | ||
| Rejected ballots | 45 | 1.9 | +1.7 | ||
| Liberal Democrats hold | Swing | -0.4 | |||
Prescot South
| Party | Candidate | Votes | % | ±% | |
|---|---|---|---|---|---|
| Green | Joanne Burke | 1,424 | 67.7 | +2.2 | |
| Labour | Denise Allen | 615 | 29.2 | -2.5 | |
| Conservative | Gary Robertson | 65 | 3.1 | +0.3 | |
| Majority | 809 | 38.5 | +4.7 | ||
| Turnout | 2,116 | 29.4 | -3.4 | ||
| Rejected ballots | 12 | 0.6 | +0.5 | ||
| Green gain from Labour | Swing | +2.4 | |||
Roby
| Party | Candidate | Votes | % | ±% | |
|---|---|---|---|---|---|
| Labour | Hughie Malone | 1,103 | 47.9 | -8.2 | |
| Green | Kirk Sandringham | 1,002 | 43.5 | +21.5 | |
| Conservative | Victoria Smart | 196 | 8.5 | -8.8 | |
| Majority | 101 | 4.4 | -29.7 | ||
| Turnout | 2,330 | 31.0 | -0.1 | ||
| Rejected ballots | 29 | 1.2 | +1.0 | ||
| Labour hold | Swing | -14.9 | |||
Shevington
| Party | Candidate | Votes | % | ±% | |
|---|---|---|---|---|---|
| Labour | Tony Brennan | 1,139 | 77.2 | -12.8 | |
| Socialist Alternative | Neil Dunne | 242 | 16.4 | +6.4 | |
| Conservative | John Aspinall | 95 | 6.4 | N/A | |
| Majority | 897 | 60.8 | -19.2 | ||
| Turnout | 1,495 | 19.2 | -1.5 | ||
| Rejected ballots | 19 | 1.3 | +0.3 | ||
| Labour hold | Swing | -9.6 | |||
St Gabriels
| Party | Candidate | Votes | % | ±% | |
|---|---|---|---|---|---|
| Labour | Crispin Evans | 1,345 | 86.8 | +10.1 | |
| Conservative | Antony Read | 205 | 13.2 | +6.0 | |
| Majority | |||||
| Turnout | |||||
| Rejected ballots | |||||
| Labour hold | Swing | ||||
St Michaels
| Party | Candidate | Votes | % | ±% | |
|---|---|---|---|---|---|
| Labour | Mike Kearns | 1,069 | 76.1 | -8.6 | |
| Liberal Democrats | Michael Seed | 225 | 16.0 | N/A | |
| Conservative | James Fletcher | 111 | 7.9 | ±0.0 | |
| Majority | |||||
| Turnout | |||||
| Rejected ballots | |||||
| Labour hold | Swing | ||||
Stockbridge
| Party | Candidate | Votes | % | ±% | |
|---|---|---|---|---|---|
| Labour | John Donnelly | 997 | 74.5 | -2.2 | |
| Green | Paul Ryan | 270 | 20.2 | +8.0 | |
| Conservative | Graham Tubey | 72 | 5.4 | N/A | |
| Majority | |||||
| Turnout | |||||
| Rejected ballots | |||||
| Labour hold | Swing | ||||
Swanside
| Party | Candidate | Votes | % | ±% | |
|---|---|---|---|---|---|
| Labour | Chris Bannon | 1,208 | 56.9 | -24.4 | |
| Green | Paul Woodruff | 835 | 39.3 | N/A | |
| Conservative | Jack Boyd | 80 | 3.8 | -5.5 | |
| Majority | 373 | 17.6 | -54.3 | ||
| Turnout | 2,143 | 28.3 | +0.7 | ||
| Rejected ballots | 20 | 0.9 | +0.5 | ||
| Labour hold | Swing | -27.2 | |||
Whiston and Cronton
| Party | Candidate | Votes | % | ±% | |
|---|---|---|---|---|---|
| Green | Ron Gaffney | 1,082 | 51.6 | +22.4 | |
| Labour | Tony Newman | 863 | 41.2 | -14.3 | |
| Conservative | Aaron Waters | 150 | 7.2 | -3.8 | |
| Majority | 219 | 10.5 | N/A | ||
| Turnout | 2,119 | 28.4 | -0.7 | ||
| Rejected ballots | 24 | 1.1 | +0.8 | ||
| Green gain from Labour | Swing | +18.4 | |||
Whitefield
| Party | Candidate | Votes | % | ±% | |
|---|---|---|---|---|---|
| Labour | John Morgan | 1,400 | 85.4 | -5.2 | |
| Conservative | Darren Melling | 240 | 14.6 | N/A | |
| Turnout | 1,656 | ||||
| Rejected ballots | 56 | 0.03 | |||
| Labour hold | Swing | ||||
References
- "Knowsley Local Elections 2019 – results". Knowsley News. 3 May 2019. Retrieved 8 May 2019.
- Harden, Mike (22 March 2019). "KNOWSLEY METROPOLITAN BOROUGH COUNCIL NOTICE OF ELECTION ELECTION OF BOROUGH COUNCILLORS THURSDAY 2 MAY 2019" (PDF). Knowsley Metropolitan Borough Council. Retrieved 24 April 2019.
- Holder, Josh; Voce, Antonio (3 May 2019). "Local elections 2019: full results for English councils". The Guardian. Retrieved 8 May 2019.
- "Borough Council Results - Thursday 2 May 2019" (PDF). Knowsley Metropolitan Borough Council. 3 May 2019. Retrieved 8 May 2019.
"Statement of Persons Nominated" (PDF). Knowsley Metropolitan Borough Council. 3 April 2019. Retrieved 4 April 2019.
This article is issued from Wikipedia. The text is licensed under Creative Commons - Attribution - Sharealike. Additional terms may apply for the media files.