2019 Norwich City Council election
Elections to Norwich City Council were held on 2 May 2019. Following boundary changes, all 39 seats were put up for election, with three councillors being elected per ward using the block vote system.[1] The election saw the Green Party reclaim five seats from the Labour Party, while the Labour Party retained its majority on the council.
| |||||||||||||||||||||||||||||||||
All 39 seats to Norwich City Council 20 seats needed for a majority | |||||||||||||||||||||||||||||||||
|---|---|---|---|---|---|---|---|---|---|---|---|---|---|---|---|---|---|---|---|---|---|---|---|---|---|---|---|---|---|---|---|---|---|
| |||||||||||||||||||||||||||||||||
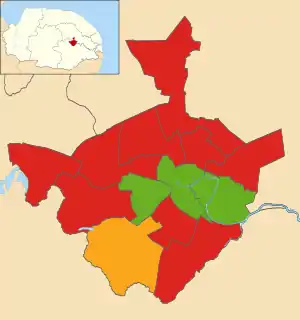 Map showing the 2019 local election results in Norwich. | |||||||||||||||||||||||||||||||||
| |||||||||||||||||||||||||||||||||
Background
In the 2018 election, the Labour Party achieved its best result in the city since the 1990s, winning 49% of the vote and 12 of 13 seats up for election, with the Greens dropping to their worst percentage result since 2004 (19%) and losing all 5 seats they were defending. This followed a similar victory for Labour within Norwich in the 2017 Norfolk County Council election and the 2017 re-election of Norwich South Labour MP Clive Lewis with 61% of the vote. As a result of the 2018 election, Labour held 31 of the 39 seats - 79.5% of the total.
In late 2017, the Local Government Boundary Commission began a review of the Norwich City Council boundaries.[2]
All councillors had to seek reelection in the 2019 Norwich City Council election, rather than the usual third of each ward.
Summary
Results summary
| Party | Seats | Gains | Losses | Net gain/loss | Seats % | Votes % | Votes | +/− | |
|---|---|---|---|---|---|---|---|---|---|
| Labour | 27 | 1 | 5 | 40.5 | 39,418 | ||||
| Green | 9 | 5 | 1 | 30.0 | 29,213 | ||||
| Liberal Democrats | 3 | 0 | 0 | 14.0 | 13,604 | ||||
| Conservative | 0 | 0 | 0 | 14.8 | 14,386 | ||||
| UKIP | 0 | 0 | 0 | 0.3 | 324 | New | |||
| Independent | 0 | 0 | 0 | 0.3 | 309 | New | |||
Council Composition
Prior to the election the composition of the council was:
| 31 | 5 | 3 |
| Labour | Green | Lib Dem |
The results were as follows:
| 27 | 9 | 3 |
| Labour | Green | Lib Dem |
Ward results
Bowthorpe
| Party | Candidate | Votes | % | ±% | |
|---|---|---|---|---|---|
| Labour | Sally Ann Batton | 860 | 41.2 | -18.3 | |
| Labour | Mike Sands | 838 | |||
| Labour | Sue Sands | 775 | |||
| Conservative | Thomas Simon Sheppard | 432 | 20.7 | -5.9 | |
| Conservative | Anthony Daniel Little | 399 | |||
| Conservative | Syed Ahmod | 357 | |||
| Green | Tim Michael Jones | 321 | 15.4 | +7.5 | |
| Independent | Jon Watson | 309 | 14.8 | New | |
| Green | Jennifer Susan Ramsay | 288 | |||
| Green | Sabine Virani | 270 | |||
| Liberal Democrats | Danielle Engelbrecht | 164 | 7.9 | +1.9 | |
| Liberal Democrats | Samual Neal | 152 | |||
| Turnout | 2,479 | 28.2 | +3.4 | ||
| Labour hold | |||||
| Labour hold | |||||
| Labour hold | |||||
Catton Grove
| Party | Candidate | Votes | % | ±% | |
|---|---|---|---|---|---|
| Labour | Gail Paula Harris | 971 | 45.1 | -6.2 | |
| Labour | Paul Kendrick | 965 | |||
| Labour | Mike Stonard | 890 | |||
| Conservative | Henry James Charles Lynn | 575 | 26.7 | -7.3 | |
| Conservative | John Elliot Tye | 532 | |||
| Conservative | Roger Tubby | 498 | |||
| Green | Tony Arthur Park | 403 | 18.7 | +10.5 | |
| Green | Christine Patricia Way | 381 | |||
| Green | Ian Peter Chapman | 334 | |||
| Liberal Democrats | Sean Timothy Bennett | 205 | 9.5 | +3.1 | |
| Liberal Democrats | Wendy Outwin | 192 | |||
| Liberal Democrats | Christopher Morgan | 178 | |||
| Turnout | 2134 | 27.2 | -3.1 | ||
| Labour hold | |||||
| Labour hold | |||||
| Labour hold | |||||
Crome
| Party | Candidate | Votes | % | ±% | |
|---|---|---|---|---|---|
| Labour | Alan Henry Waters | 1,134 | 48.5 | -9.5 | |
| Labour | Marion Frances Maxwell | 1,105 | |||
| Labour | Adam Christopher Giles | 1,052 | |||
| Conservative | Jane Mary Fisher | 524 | 22.4 | -5.8 | |
| Green | Olivia Margaret Hanks | 508 | 21.7 | +13.2 | |
| Conservative | John Hipperson | 498 | |||
| Green | Judith Marianne Ford | 466 | |||
| Conservative | Ethan Richard Harvey | 451 | |||
| Green | Paul Meade | 420 | |||
| Liberal Democrats | Alexander William Atkins | 170 | 7.3 | +2.0 | |
| Liberal Democrats | Nigel Clifford Lubbock | 152 | |||
| Liberal Democrats | Joyce Pitty | 137 | |||
| Turnout | 2088 | 28.6 | -0.2 | ||
| Labour hold | |||||
| Labour hold | |||||
| Labour hold | |||||
Eaton
| Party | Candidate | Votes | % | ±% | |
|---|---|---|---|---|---|
| Liberal Democrats | Judith Lubbock | 2,168 | 56.0 | +6.4 | |
| Liberal Democrats | Caroline Sarah Ackroyd | 2,129 | |||
| Liberal Democrats | James William Wright | 1,963 | |||
| Conservative | Stephen Michael Edmond Bailey | 690 | 17.8 | -6.7 | |
| Conservative | Mark Eva | 652 | |||
| Conservative | Mary Josephine Chacksfield | 646 | |||
| Labour | Benjamin James Hardie | 532 | 13.8 | -5.2 | |
| Labour | Christopher Robin Elderton | 518 | |||
| Green | Jane Isobel Saunders | 479 | 12.4 | +5.5 | |
| Labour | Christopher Douglas Smith | 478 | |||
| Green | Hazel Patricia Davidson | 439 | |||
| Green | David John Battye | 436 | |||
| Turnout | 3248 | 50.4 | -5.9 | ||
| Liberal Democrats hold | Swing | ||||
| Liberal Democrats hold | Swing | ||||
| Liberal Democrats hold | Swing | ||||
Lakenham
| Party | Candidate | Votes | % | ±% | |
|---|---|---|---|---|---|
| Labour | Keith Malcom Driver | 1,159 | 36.3 | -20.7 | |
| Labour | Patrick John Paul Manning | 1,121 | |||
| Labour | Jane Sarmezey | 1,032 | |||
| Green | Chris Hull | 733 | 23.0 | +13.0 | |
| Liberal Democrats | David Angus Fairbairn | 532 | 16.7 | +3.8 | |
| Liberal Democrats | Peter Callf | 472 | |||
| Independent | Robert James Hammond | 400 | 12.5 | New | |
| Conservative | Christine Mackie | 366 | 11.5 | -8.5 | |
| Conservative | David John Mackie | 315 | |||
| Conservative | Eric Phillip Ashwell Masters | 303 | |||
| Turnout | 2294 | 31.9 | -1.1 | ||
| Labour hold | Swing | ||||
| Labour hold | Swing | ||||
| Labour hold | Swing | ||||
Mancroft
| Party | Candidate | Votes | % | ±% | |
|---|---|---|---|---|---|
| Green | Sandra Bogelein | 1,308 | 50.8 | +10.8 | |
| Green | Jamie Osborn | 1,171 | |||
| Green | Martin Kenneth Albert Schmeirer | 1,148 | |||
| Labour | Jo Smith | 833 | 32.3 | -10.3 | |
| Labour | David Fullman | 803 | |||
| Labour | Matt Reilly | 715 | |||
| Conservative | Anthony John Barton | 256 | 9.9 | -2.8 | |
| Conservative | Joanne Maria Grand | 229 | |||
| Conservative | John Martyn Ward | 200 | |||
| Liberal Democrats | Gordon Richard Dean | 180 | 7.0 | +2.3 | |
| Turnout | 2964 | 35.4 | +0.4 | ||
| Green gain from Labour | |||||
| Green gain from Labour | |||||
| Green hold | |||||
Mile Cross
| Party | Candidate | Votes | % | ±% | |
|---|---|---|---|---|---|
| Labour | Jacob Stephen Orlando Huntley | 978 | 43.4 | -14.4 | |
| Labour | Vivien Thomas | 939 | |||
| Labour | Vaughan Thomas | 926 | |||
| Green | Susan Curran | 480 | 21.3 | +11.6 | |
| Green | Adrian St. John Holmes | 391 | |||
| UKIP | Peter James Pyke | 324 | 14.4 | New | |
| Conservative | John Frederick Fisher | 257 | 11.4 | -8.8 | |
| Conservative | Guy Christopher James Owen | 255 | |||
| Conservative | Carl Lamb | 221 | |||
| Liberal Democrats | Adrian Christopher Thomas | 214 | 9.5 | +3.1 | |
| Liberal Democrats | Carol Taylor | 170 | |||
| Liberal Democrats | Alistair Pitty | 141 | |||
| Turnout | 5,303 | 35.4 | +22.4 | ||
| Labour hold | Swing | ||||
| Labour hold | Swing | ||||
| Labour hold | Swing | ||||
Nelson
| Party | Candidate | Votes | % | ±% | |
|---|---|---|---|---|---|
| Green | Denise Eileen Carlo | 2,626 | 56.1 | +14.1 | |
| Green | Nannette Youssef | 2,316 | |||
| Green | Paul Vincent Neale | 2,055 | |||
| Labour | Emma Hampton | 1,464 | 31.3 | -15.9 | |
| Labour | Hugo Malik | 1,367 | |||
| Labour | Gary McGuinness | 951 | |||
| Liberal Democrats | Connor Alex Bell | 355 | 7.6 | +2.3 | |
| Conservative | Richard James Gill | 236 | 5.0 | -0.4 | |
| Conservative | Danny Buck | 205 | |||
| Conservative | Jo Copplestone | 190 | |||
| Turnout | 4,007 | 51.8 | |||
| Green gain from Labour | Swing | ||||
| Green gain from Labour | Swing | ||||
| Green hold | Swing | ||||
Sewell
| Party | Candidate | Votes | % | ±% | |
|---|---|---|---|---|---|
| Labour | Julie Dawn Brociek-Coulton | 1,451 | 52.6 | -11.9 | |
| Labour | Matthew Robert Packer | 1,152 | |||
| Labour | Laura Elizabeth McCartney-Gray | 1,143 | |||
| Green | Simeon Jackson | 779 | 28.2 | +15.5 | |
| Green | Gary Champion | 750 | |||
| Green | Aaron Stephen Fickling | 581 | |||
| Conservative | Gillian Anna Ashenden | 318 | 11.5 | -5.3 | |
| Conservative | Charley Le Grice | 276 | |||
| Conservative | Andrew Roy Wiltshire | 252 | |||
| Liberal Democrats | Helen Arundell | 212 | 7.7 | +1.7 | |
| Liberal Democrats | Richard Smith | 191 | |||
| Liberal Democrats | David Munday | 139 | |||
| Turnout | 2,688 | 33.8 | |||
| Labour hold | Swing | ||||
| Labour hold | Swing | ||||
| Labour hold | Swing | ||||
Thorpe Hamlet
| Party | Candidate | Votes | % | ±% | |
|---|---|---|---|---|---|
| Green | Lesley Juliet Grahame | 1,410 | 48.1 | +13.2 | |
| Green | Ben Price | 1,294 | |||
| Green | Nigel John Utton | 1,096 | |||
| Labour | Rachel Charlotte Everett | 770 | 26.3 | -13.4 | |
| Labour | Cavan Stewart | 753 | |||
| Labour | Deane Edward Money | 650 | |||
| Conservative | Simon Mark Jones | 417 | 14.2 | -4.1 | |
| Conservative | Stephen Mark Barber | 407 | |||
| Conservative | Jonathan Michael Hook | 370 | |||
| Liberal Democrats | Jeremy Hooke | 335 | 11.4 | +4.3 | |
| Turnout | 3,483 | 37.5 | |||
| Green gain from Labour | Swing | ||||
| Green hold | Swing | ||||
| Green hold | Swing | ||||
Town Close
| Party | Candidate | Votes | % | ±% | |
|---|---|---|---|---|---|
| Labour | Karen Ann Davis | 1,518 | 44.7 | -4.2 | |
| Labour | Cate Oliver | 1,415 | |||
| Labour | Ian Clifford Stutely | 1,393 | |||
| Green | Nick Caistor | 848 | 25.0 | +6.9 | |
| Green | Phil Di Palma | 832 | |||
| Green | Richard Andrew Bearman | 789 | |||
| Liberal Democrats | Jacob Hamilton | 530 | 15.6 | +5.4 | |
| Liberal Democrats | Neil Robert Hardman | 506 | |||
| Conservative | John Clarke Ward | 500 | 14.7 | -8.3 | |
| Conservative | Iain Michael Morgan Gwynn | 495 | |||
| Conservative | Sarah Jane King | 490 | |||
| Liberal Democrats | Silvia Schmidtova | 485 | |||
| Turnout | 3,991 | 43.5 | |||
| Labour gain from Green | Swing | ||||
| Labour hold | Swing | ||||
| Labour hold | Swing | ||||
University
| Party | Candidate | Votes | % | ±% | |
|---|---|---|---|---|---|
| Labour | Beth Jones | 1,134 | 49.7 | -13.5 | |
| Labour | Matthew Lewis Fulton-McAlister | 1,064 | |||
| Labour | Roger John Ryan | 1,036 | |||
| Green | Andrew Philip Boswell | 617 | 27.1 | +10.9 | |
| Green | Catherine Joanna Rowett | 581 | |||
| Green | John Robert Greenaway | 547 | |||
| Conservative | Craig Daniel James Harvey | 285 | 12.5 | -1.3 | |
| Conservative | Wini Dwebeng | 262 | |||
| Liberal Democrats | Carol Chilton | 244 | 10.7 | +3.9 | |
| Conservative | Hassan Iqbal | 235 | |||
| Liberal Democrats | Robert Parsons | 227 | |||
| Liberal Democrats | Ian Williams | 166 | |||
| Turnout | 1,262 | 29.6 | |||
| Labour hold | Swing | ||||
| Labour hold | Swing | ||||
| Labour hold | Swing | ||||
Wensum
| Party | Candidate | Votes | % | ±% | |
|---|---|---|---|---|---|
| Labour | Erin Fulton-McAlister | 1,231 | 50.6 | -8.0 | |
| Labour | Kevin Maguire | 1,202 | |||
| Labour | Martin Peek | 1,100 | |||
| Green | Liam Calvert | 733 | 30.2 | +10.7 | |
| Green | Lucy Galvin | 733 | |||
| Green | Jonathan Lambert | 650 | |||
| Conservative | Alice Saunders | 306 | 12.6 | -4.9 | |
| Conservative | Pete Freeman | 294 | |||
| Conservative | William Oxley | 273 | |||
| Liberal Democrats | Sean Laver-Vincent | 161 | 6.6 | +2.0 | |
| Liberal Democrats | Alan Wright | 152 | |||
| Liberal Democrats | Nico Pili | 227 | |||
| Turnout | 2,591 | 29.9 | |||
| Labour hold | Swing | ||||
| Labour hold | Swing | ||||
| Labour hold | Swing | ||||