List of cities in Mexico
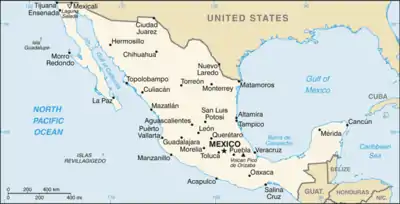
This article contains lists of most populous cities as well as municipalities of Mexico.

Top 100 Most Populous Cities

This is a list of the Top 100 cities in Mexico by fixed population, according to the 2020 Mexican National Census.[1]
Mexico City contains all of the federal entity's area, including rural areas with relatively small populations. All of the map links are of the same scale.
‡ These cities extend beyond the borders of a single municipality.
Top 100 Most Populous Municipalities


The following is a list of the most populous incorporated places in Mexico (municipalities) according to the 2020 Mexican National Census.[1] This list refers only to the population of individual municipalities within their defined limits, which does not include other municipalities or unincorporated suburban areas within urban agglomerations.
| Rank | Municipality | State | 2020 Census | 2010 Census | Change |
|---|---|---|---|---|---|
| 1 | Mexico City | Mexico City | 9,209,944 | 8,851,080 | +4.05% |
| 2 | Tijuana | Baja California | 1,922,523 | 1,559,683 | +23.26% |
| 3 | León | Guanajuato | 1,721,215 | 1,436,480 | +19.82% |
| 4 | Puebla | Puebla | 1,692,181 | 1,539,819 | +9.89% |
| 5 | Ecatepec | State of Mexico | 1,645,352 | 1,656,107 | −0.65% |
| 6 | Juárez | Chihuahua | 1,512,450 | 1,332,131 | +13.54% |
| 7 | Zapopan | Jalisco | 1,476,491 | 1,243,756 | +18.71% |
| 8 | Guadalajara | Jalisco | 1,385,629 | 1,495,189 | −7.33% |
| 9 | Monterrey | Nuevo León | 1,142,994 | 1,135,550 | +0.66% |
| 10 | Nezahualcóyotl | State of Mexico | 1,077,208 | 1,110,565 | −3.00% |
| 11 | Mexicali | Baja California | 1,049,792 | 936,826 | +12.06% |
| 12 | Querétaro | Querétaro | 1,049,777 | 801,940 | +30.90% |
| 13 | Culiacán | Sinaloa | 1,003,530 | 858,638 | +16.87% |
| 14 | Mérida | Yucatan | 995,129 | 830,732 | +19.79% |
| 15 | Aguascalientes | Aguascalientes | 948,990 | 797,010 | +19.07% |
| 16 | Chihuahua | Chihuahua | 937,674 | 819,543 | +14.41% |
| 17 | Hermosillo | Sonora | 936,263 | 784,342 | +19.37% |
| 18 | San Luis Potosí | San Luis Potosí | 911,908 | 772,604 | +18.03% |
| 19 | Benito Juárez | Quintana Roo | 911,503 | 661,176 | +37.86% |
| 20 | Toluca | State of Mexico | 910,608 | 819,561 | +11.11% |
| 21 | Saltillo | Coahuila | 879,958 | 725,123 | +21.35% |
| 24 | Morelia | Michoacán | 849,053 | 729,279 | +16.42% |
| 25 | Naucalpan | State of Mexico | 834,434 | 833,779 | +0.08% |
| 26 | Acapulco | Guerrero | 779,566 | 789,971 | −1.32% |
| 27 | Tlajomulco | Jalisco | 727,750 | 416,626 | +74.68% |
| 28 | Torreón | Coahuila | 720,848 | 639,629 | +12.70% |
| 29 | Chimalhuacán | State of Mexico | 705,193 | 614,453 | +14.77% |
| 30 | Reynosa | Tamaulipas | 704,767 | 608,891 | +15.75% |
| 31 | Durango | Durango | 688,697 | 582,267 | +18.28% |
| 32 | Tlaquepaque | Jalisco | 687,127 | 608,114 | +12.99% |
| 33 | Centro | Tabasco | 683,607 | 640,359 | +6.75% |
| 34 | Tlalnepantla | State of Mexico | 672,202 | 664,225 | +1.20% |
| 35 | Apodaca | Nuevo León | 656,464 | 523,270 | +25.45% |
| 36 | Guadalupe | Nuevo León | 643,143 | 678,006 | −5.14% |
| 36 | Veracruz | Veracruz | 607,209 | 552,156 | +9.97% |
| 37 | Tuxtla Gutiérrez | Chiapas | 604,147 | 553,374 | +9.18% |
| 38 | Irapuato | Guanajuato | 592,953 | 529,440 | +12.00% |
| 39 | Tonalá | Jalisco | 569,913 | 478,689 | +19.06% |
| 40 | Cuautitlán Izcalli | State of Mexico | 555,163 | 511,675 | +8.50% |
| 41 | Tecámac | State of Mexico | 547,503 | 364,589 | +50.17% |
| 42 | Ixtapaluca | State of Mexico | 542,211 | 467,361 | +16.02% |
| 43 | Matamoros | Tamaulipas | 541,979 | 489,193 | +10.79% |
| 44 | Atizapán de Zaragoza | State of Mexico | 523,674 | 489,937 | +6.89% |
| 45 | Celaya | Guanajuato | 521,169 | 468,469 | +11.25% |
| 46 | Tultitlán | State of Mexico | 516,341 | 524,074 | −1.48% |
| 47 | Mazatlán | Sinaloa | 501,441 | 438,434 | +14.37% |
| 48 | Xalapa | Veracruz | 488,531 | 457,928 | +6.68% |
| 49 | General Escobedo | Nuevo León | 481,213 | 357,937 | +34.44% |
| 50 | Juarez | Nuevo León | 471,523 | 256,454 | +83.86% |
| 51 | Ahome | Sinaloa | 459,310 | 416,299 | +10.33% |
| 52 | Ensenada‡ | Baja California | 443,807 | 466,814 | −4.93% |
| 53 | Cajeme | Sonora | 436,484 | 409,310 | +6.64% |
| 54 | Nicolás Romero | State of Mexico | 430,601 | 366,604 | +17.46% |
| 55 | Tepic | Nayarit | 425,924 | 380,074 | +12.06% |
| 55 | Nuevo Laredo | Tamaulipas | 425,058 | 384,033 | +10.68% |
| 56 | San Nicolás de los Garza | Nuevo León | 412,199 | 443,273 | −7.01% |
| 57 | Chalco | State of Mexico | 400,057 | 310,124 | +29.00% |
| 58 | García | Nuevo León | 397,205 | 143,668 | +176.47% |
| 59 | Valle de Chalco | State of Mexico | 391,731 | 357,637 | +9.53% |
| 60 | Cuernavaca | Morelos | 378,476 | 364,778 | +3.76% |
| 61 | Gómez Palacio | Durango | 372,750 | 328,159 | +13.59% |
| 62 | Uruapan | Michoacán | 356,786 | 315,329 | +13.15% |
| 63 | Tapachula | Chiapas | 353,706 | 320,456 | +10.38% |
| 68 | Los Cabos | Baja California Sur | 351,111 | 238,487 | +47.22% |
| 62 | Victoria | Tamaulipas | 349,688 | 321,685 | +8.71% |
| 63 | Solidaridad | Quintana Roo | 333,800 | 159,310 | +109.53% |
| 64 | Soledad | San Luis Potosí | 332,072 | 267,839 | +23.98% |
| 65 | Tehuacán | Puebla | 327,312 | 274,907 | +19.06% |
| 66 | Pachuca | Hidalgo | 314,331 | 267,862 | +17.35% |
| 67 | Coatzacoalcos | Veracruz | 310,698 | 305,225 | +1.79% |
| 68 | Santa Catarina | Nuevo León | 306,322 | 270,790 | +13.12% |
| 69 | La Paz | State of Mexico | 304,088 | 253,843 | +19.79% |
| 70 | San Juan del Rio | Querétaro | 297,804 | 241,699 | +23.21% |
| 71 | Tampico | Tamaulipas | 297,562 | 297,057 | +0.17% |
| 72 | Campeche | Campeche | 294,077 | 259,005 | +13.54% |
| 73 | Coacalco de Berriozábal | State of Mexico | 293,444 | 278,203 | +5.48% |
| 74 | La Paz | Baja California Sur | 292,241 | 251,871 | +16.03% |
| 75 | Puerto Vallarta | Jalisco | 291,839 | 255,725 | +14.12% |
| 76 | Guasave | Sinaloa | 289,370 | 285,919 | +1.21% |
| 77 | Huixquilucan | State of Mexico | 284,965 | 242,167 | +17.67% |
| 78 | Chilpancingo | Guerrero | 283,354 | 241,717 | +17.23% |
| 79 | Zumpango | State of Mexico | 280,455 | 159,647 | +75.67% |
| 80 | Texcoco | State of Mexico | 277,562 | 235,151 | +18.04% |
| 81 | Salamanca | Guanajuato | 273,417 | 260,759 | +4.85% |
| 82 | Oaxaca | Oaxaca | 270,955 | 263,145 | +2.97% |
| 83 | Altamira | Tamaulipas | 269,790 | 212,001 | +27.26% |
| 84 | Nogales | Sonora | 264,782 | 220,292 | +20.20% |
| 85 | Carmen | Campeche | 248,845 | 221,094 | +12.55% |
| 86 | Cardenas | Tabasco | 243,229 | 248,507 | −2.12% |
| 87 | Metepec | State of Mexico | 242,307 | 214,162 | +13.14% |
| 88 | Fresnillo | Zacatecas | 240,532 | 213,139 | +12.85% |
| 89 | Monclova | Coahuila | 237,951 | 216,206 | +10.06% |
| 90 | Ocosingo | Chiapas | 234,661 | 198,877 | +17.99% |
| 91 | Othón P. Blanco‡‡ | Quintana Roo | 233,648 | 244,616 | −4.48% |
| 92 | El Salto | Jalisco | 232,852 | 138,226 | +68.46% |
| 93 | El Marqués | Querétaro | 231,668 | 116,458 | +98.93% |
| 94 | San Cristobal de las Casas | Chiapas | 215,874 | 185,917 | +16.11% |
| 95 | Jiutepec | Morelos | 215,357 | 196,953 | +9.34% |
| 96 | Comalcalco | Tabasco | 214,877 | 192,802 | +11.45% |
| 97 | Corregidora | Querétaro | 212,567 | 143,073 | +48.57% |
| 98 | Guadalupe | Zacatecas | 211,740 | 159,991 | +32.34% |
| 99 | Ciudad Madero | Tamaulipas | 205,933 | 197,216 | +4.42% |
| 100 | Zamora | Michoacán | 204,860 | 186,102 | +10.08% |
‡ A new municipality, San Quintín, was created out of Ensenada's territory in February 2020.[2] ‡‡ A new municipality, Bacalar, was created out of Othon P. Blanco's territory in February 2011.[3]
References
- "Censo de Población y Vivienda 2020 - SCITEL" (in Spanish). INEGI. Retrieved 27 January 2021.
- "San Quintín will be the sixth municipality in Baja California" (in Spanish). El Financiero. Retrieved 30 December 2020.
- Silvia Hernández (2 February 2011). "Bacalar, el décimo municipio de Q. Roo" (in Spanish). El Universal. Retrieved 5 February 2011.
External links
| Wikimedia Commons has media related to Cities in Mexico. |
- National Population Council (CONAPO) — official website. (in Spanish)
- National Institute of Statistics and Geography (INEGI) — official website. (in Spanish)
- Main Cities to Visit in Mexico —
- Towns of Mexico — List with all the small villages, towns and cities in Mexico


.jpg.webp)