List of metropolitan areas in the Philippines
The Philippines has three metropolitan areas as defined by the National Economic and Development Authority (NEDA).[1]
Metro Manila is the largest conurbation or urban agglomeration in the country, and its official metropolitan area is composed of the city of Manila plus 15 neighboring cities and the municipality of Pateros. Metro Cebu, located in the Visayas, is the Philippines' second largest urban area, while Metro Davao, which is located in Mindanao, is the country's third largest metropolitan area.
The official definition of each area does not necessarily follow the actual extent of continuous urbanization. For example, the built-up area of Metro Manila has long spilled out of its officially defined borders into the adjacent provinces of Bulacan, Rizal, Laguna, and Cavite.[2]
The number of metropolitan areas in the Philippines was reduced from 13 in 2007 to the current three based from the 2017–2022 Philippine Development Plan by NEDA. The other 10 metropolitan areas were Metro Angeles, Metro Bacolod, Metro Baguio, Metro Batangas, Metro Cagayan de Oro, Metro Dagupan, Metro Iloilo–Guimaras, Metro Butuan, Metro Naga, and Metro Olongapo.[3]
List
| Metro area [1] | Population (2015) [4] | Area [5][6] | Density (2015) | Managing agency | ||||
|---|---|---|---|---|---|---|---|---|
| km2 | sq mi | /km2 | /sq mi | |||||
| Metro Cebu | 2,849,213 | 1,053.19 | 406.64 | 2,700 | 7,000 | Metro Cebu Development and Coordinating Board[7] | ||
| Carcar | 4.2% | 119,664 | 116.78 | 45.09 | 1,000 | 2,600 | ||
| Cebu City | 32.4% | 922,611 | 315.00 | 121.62 | 2,900 | 7,500 | ||
| Compostela | 1.7% | 47,898 | 53.90 | 20.81 | 890 | 2,300 | ||
| Consolacion | 4.6% | 131,528 | 37.03 | 14.30 | 3,600 | 9,300 | ||
| Cordova | 2.1% | 59,712 | 17.15 | 6.62 | 3,500 | 9,100 | ||
| Danao | 4.8% | 136,471 | 107.30 | 41.43 | 1,300 | 3,400 | ||
| Lapu-Lapu (Opon) | 14.3% | 408,112 | 58.10 | 22.43 | 7,000 | 18,000 | ||
| Liloan | 4.2% | 118,753 | 45.92 | 17.73 | 2,600 | 6,700 | ||
| Mandaue | 12.7% | 362,654 | 25.18 | 9.72 | 14,000 | 36,000 | ||
| Minglanilla | 4.6% | 132,135 | 65.60 | 25.33 | 2,000 | 5,200 | ||
| Naga | 4.1% | 115,750 | 101.97 | 39.37 | 1,100 | 2,800 | ||
| San Fernando | 2.3% | 66,280 | 69.39 | 26.79 | 960 | 2,500 | ||
| Talisay | 8.0% | 227,645 | 39.87 | 15.39 | 5,700 | 15,000 | ||
| Metro Davao | 2,516,216 | 3,964.95 | 1,530.88 | 630 | 1,600 | Davao Integrated Development Program Board[8] | ||
| Carmen | 3.0% | 74,679 | 166.00 | 64.09 | 450 | 1,200 | ||
| Davao City | 64.9% | 1,632,991 | 2,443.61 | 943.48 | 670 | 1,700 | ||
| Digos | 6.7% | 169,393 | 287.10 | 110.85 | 590 | 1,500 | ||
| Panabo | 7.3% | 184,599 | 251.23 | 97.00 | 730 | 1,900 | ||
| Samal | 4.1% | 104,123 | 301.30 | 116.33 | 350 | 910 | ||
| Santa Cruz | 3.6% | 90,987 | 319.91 | 123.52 | 280 | 730 | ||
| Tagum | 10.3% | 259,444 | 195.80 | 75.60 | 1,300 | 3,400 | ||
| Metro Manila | 12,877,253 | 633.11 | 244.45 | 20,000 | 52,000 | Metropolitan Manila Development Authority | ||
| Caloocan | 12.3% | 1,583,978 | 53.20 | 20.54 | 30,000 | 78,000 | ||
| Las Piñas | 4.6% | 588,894 | 32.02 | 12.36 | 18,000 | 47,000 | ||
| Makati | 4.5% | 582,602 | 27.36 | 10.56 | 21,000 | 54,000 | ||
| Malabon | 2.8% | 365,525 | 15.96 | 6.16 | 23,000 | 60,000 | ||
| Mandaluyong | 3.0% | 386,276 | 11.06 | 4.27 | 35,000 | 91,000 | ||
| Manila | 13.8% | 1,780,148 | 42.88 | 16.56 | 42,000 | 110,000 | ||
| Marikina | 3.5% | 450,741 | 22.64 | 8.74 | 20,000 | 52,000 | ||
| Muntinlupa | 3.9% | 504,509 | 41.67 | 16.09 | 12,000 | 31,000 | ||
| Navotas | 1.9% | 249,463 | 11.51 | 4.44 | 22,000 | 57,000 | ||
| Parañaque | 5.2% | 665,822 | 47.28 | 18.25 | 14,000 | 36,000 | ||
| Pasay | 3.2% | 416,522 | 18.64 | 7.20 | 22,000 | 57,000 | ||
| Pasig | 5.9% | 755,300 | 31.46 | 12.15 | 24,000 | 62,000 | ||
| Pateros | 0.5% | 63,840 | 1.76 | 0.68 | 36,000 | 93,000 | ||
| Quezon City | 22.8% | 2,936,116 | 165.33 | 63.83 | 18,000 | 47,000 | ||
| San Juan | 0.9% | 122,180 | 5.87 | 2.27 | 21,000 | 54,000 | ||
| Taguig | 6.3% | 804,915 | 45.18 | 17.44 | 18,000 | 47,000 | ||
| Valenzuela | 4.8% | 620,422 | 45.75 | 17.66 | 14,000 | 36,000 | ||
Gallery
(2017-11-19).jpg.webp) Metro Manila
Metro Manila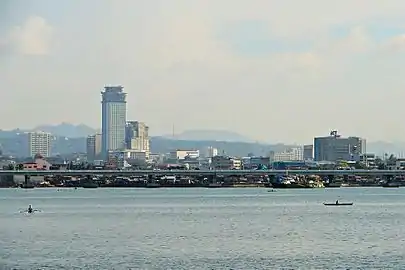 Metro Cebu
 Metro Davao
See also
References
- "Chapter 3: Overlay of Economic Growth, Demographic Trends, and Physical Characteristics" (PDF). Philippine Development Plan 2017-2022. National Economic and Development Authority: 37–38. 2017. Archived from the original (PDF) on July 25, 2020. Retrieved August 1, 2020.
- "Demographia World Urban Areas, 12th Annual Edition: 2016:04" (PDF). 2016. Archived from the original (PDF) on February 21, 2017. Retrieved March 24, 2017.
Higher than other estimates, which are largely limited to the National Capital Region. Continuous urbanization extends into Cavite, Laguna, Bulucan [sic] and Rizal.
- "Building Globally Competitive Metro Areas in the Philippines" (PDF). National Economic and Development Authority. August 30, 2007. Archived from the original (PDF) on October 4, 2013. Retrieved February 6, 2014.
- Census of Population (2015). Highlights of the Philippine Population 2015 Census of Population. PSA. Retrieved June 20, 2016.
- "Philippine Standard Geographic Code". PSGC Interactive. Quezon City, Philippines: Philippine Statistics Authority. Archived from the original on July 6, 2016. Retrieved September 9, 2016.
- "Philippine Standard Geographic Code". PSGC Interactive. Quezon City, Philippines: Philippine Statistics Authority. Archived from the original on July 6, 2016. Retrieved September 9, 2016.
- "What is MCDCB?". Mega Cebu Blog. March 2, 2014. Retrieved January 11, 2017.
- http://dirp4.pids.gov.ph/ris/pdf/pidspn9810.pdf
External links
| Current metro areas | |
|---|---|
| Proposed existing metro areas | |