Maine's 1st congressional district
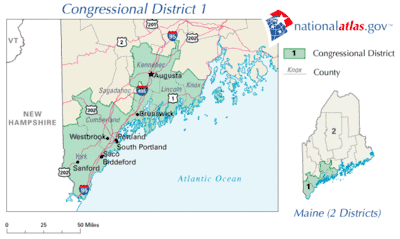
Maine's 1st congressional district is a congressional district in the U.S. state of Maine. The geographically smaller of the state's two congressional districts, the district covers the southern coastal area of the state. The district consists of all of Cumberland, Knox, Lincoln, Sagadahoc, and York counties and most of Kennebec County. Located within the district are the cities of Portland, Augusta, Brunswick, and Saco.
| Maine's 1st congressional district | |||
|---|---|---|---|
.tif.png.webp) Maine's 1st congressional district – since January 3, 2013. | |||
| Representative |
| ||
| Distribution |
| ||
| Population (2019) | 686,731 | ||
| Median household income | $67,392[1] | ||
| Ethnicity |
| ||
| Cook PVI | D+8[2] | ||
The district is currently represented by Democrat Chellie Pingree.
History
Maine was initially a part of the state of Massachusetts. Massachusetts was allocated 20 districts after the 1810 U.S. Census. When Maine became a state in 1820, seven of those districts were credited to it. Since then, all but the 1st and 2nd Congressional Districts have become obsolete.
Current composition
Maine's 1st Congressional District consists of:
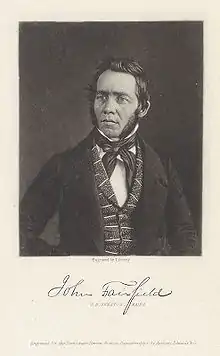
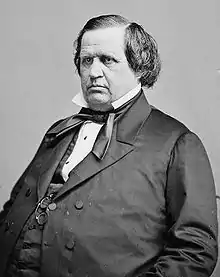
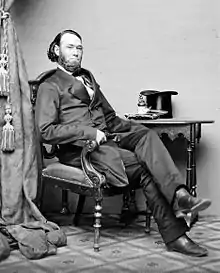
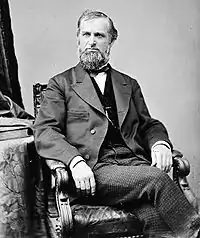
List of members representing the district
Recent election results
| Party | Candidate | Votes | % | |||
|---|---|---|---|---|---|---|
| Democratic | Joseph E. Brennan | 121,848 | 53.16% | |||
| Republican | H. Rollin Ives | 100,260 | 43.74% | |||
| Labor for Maine | Plato Truman | 7,109 | 3.10% | |||
| Majority | 21,588 | 9.42% | ||||
| Turnout | 229,217 | |||||
| Democratic gain from Republican | ||||||
| Party | Candidate | Votes | % | |
|---|---|---|---|---|
| Democratic | Joseph E. Brennan (Incumbent) | 167,623 | 60.11% | |
| Republican | Edward S. O'Meara | 111,125 | 36.78% | |
| Majority | 79,864 | 26.44% | ||
| Turnout | 278,748 | |||
| Democratic hold | ||||
| Party | Candidate | Votes | % | |
|---|---|---|---|---|
| Democratic | Thomas H. Andrews | 167,623 | 60.11% | |
| Republican | David Emery | 110,836 | 39.74% | |
| write-ins | 413 | 0.15% | ||
| Majority | 56,787 | 20.36% | ||
| Turnout | 278,872 | |||
| Democratic hold | ||||
| Party | Candidate | Votes | % | |
|---|---|---|---|---|
| Democratic | Thomas H. Andrews (Incumbent) | 232,696 | 64.97% | |
| Republican | Linda Bean | 125,236 | 34.97% | |
| write-ins | 216 | 0.06% | ||
| Majority | 107,460 | 30.00% | ||
| Turnout | 358,148 | |||
| Democratic hold | ||||
| Party | Candidate | Votes | % | |||
|---|---|---|---|---|---|---|
| Republican | James B. Longley, Jr. | 136,316 | 51.88% | |||
| Democratic | Dennis L. Dutremble | 126,373 | 48.09% | |||
| write-ins | 80 | 0.03% | ||||
| Majority | 9,943 | 3.78% | ||||
| Turnout | 262,769 | |||||
| Republican gain from Democratic | ||||||
| Party | Candidate | Votes | % | |||
|---|---|---|---|---|---|---|
| Democratic | Thomas H. Allen | 173,745 | 55.30% | |||
| Republican | James B. Longley, Jr. (Incumbent) | 140,354 | 44.68% | |||
| write-ins | 65 | 0.02% | ||||
| Majority | 33,391 | 10.63% | ||||
| Turnout | 314,164 | |||||
| Democratic gain from Republican | ||||||
| Party | Candidate | Votes | % | |
|---|---|---|---|---|
| Democratic | Thomas H. Allen (Incumbent) | 134,335 | 60.33% | |
| Republican | Ross J. Connelly | 79,160 | 35.55% | |
| Constitution | Eric R. Greiner | 9,182 | 4.12% | |
| Majority | 55,175 | 24.78% | ||
| Turnout | 222,677 | |||
| Democratic hold | ||||
| Party | Candidate | Votes | % | |
|---|---|---|---|---|
| Democratic | Thomas H. Allen (Incumbent) | 202,823 | 59.81% | |
| Republican | Jane A. Amero | 123,915 | 36.54% | |
| Libertarian | J. Frederic Staples | 12,356 | 3.64% | |
| Majority | 78,908 | 23.27% | ||
| Turnout | 339,094 | |||
| Democratic hold | ||||
| Party | Candidate | Votes | % | |
|---|---|---|---|---|
| Democratic | Tom Allen (Incumbent) | 172,646 | 63.81% | |
| Republican | Steven Joyce | 97,931 | 36.19% | |
| Total votes | 270,577 | 100.00% | ||
| Democratic hold | ||||
| Party | Candidate | Votes | % | |
|---|---|---|---|---|
| Democratic | Tom Allen (Incumbent) | 219,077 | 59.74% | |
| Republican | Charles E. Summers | 147,663 | 40.26% | |
| Total votes | 366,740 | 100.00% | ||
| Democratic hold | ||||
| Party | Candidate | Votes | % | |
|---|---|---|---|---|
| Democratic | Tom Allen (Incumbent) | 170,949 | 60.84% | |
| Republican | Darlene J. Curley | 88,009 | 31.32% | |
| Independent | Dexter Kamilewicz | 22,029 | 7.84% | |
| Total votes | 280,987 | 100.00% | ||
| Democratic hold | ||||
| Party | Candidate | Votes | % | |
|---|---|---|---|---|
| Democratic | Chellie Pingree | 205,629 | 54.90% | |
| Republican | Charles E. Summers | 168,930 | 45.10% | |
| Total votes | 374,559 | 100.00% | ||
| Democratic hold | ||||
| Party | Candidate | Votes | % | |
|---|---|---|---|---|
| Democratic | Chellie Pingree (Incumbent) | 169,114 | 56.82% | |
| Republican | Dean Scontras | 128,501 | 43.17% | |
| No party | Others | 42 | 0.01% | |
| Total votes | 297,657 | 100.00% | ||
| Democratic hold | ||||
| Party | Candidate | Votes | % | |
|---|---|---|---|---|
| Democratic | Chellie Pingree (Incumbent) | 236,363 | 64.8 | |
| Republican | Jonathan T. E. Courtney | 128,440 | 35.1% | |
| Total votes | 364,803 | 100.0% | ||
| Democratic hold | ||||
| Party | Candidate | Votes | % | |
|---|---|---|---|---|
| Democratic | Chellie Pingree (Incumbent) | 186,674 | 60.43% | |
| Republican | Isaac J. Misiuk | 94,751 | 30.67% | |
| Independent | Richard P. Murphy | 27,410 | 8.87% | |
| Others | 63 | 0.02% | ||
| Total votes | 308,898 | 100% | ||
| Democratic hold | ||||
| Party | Candidate | Votes | % | |
|---|---|---|---|---|
| Democratic | Chellie Pingree (Incumbent) | 227,546 | 57.99% | |
| Republican | Mark Holbrook | 164,569 | 41.94% | |
| Libertarian | James J. Bouchard (Declared Write-In) | 276 | 0.07% | |
| Blank ballots | 14,551 | N/A | ||
| Total votes | 406,942 | 100% | ||
| Democratic hold | ||||
| Party | Candidate | Votes | % | |
|---|---|---|---|---|
| Democratic | Chellie Pingree (Incumbent) | 201,195 | 58.8% | |
| Republican | Mark Holbrook | 111,188 | 32.5% | |
| Independent | Marty Grohman | 29,670 | 8.7% | |
| Total votes | 342,053 | 100% | ||
| Democratic hold | ||||
The 2018 election was the first to use ranked-choice voting as opposed to plurality voting since the district's creation. However, since the leading candidate had a majority of first-choice votes, no distribution of preferences was conducted.
| Party | Candidate | Votes | % | |
|---|---|---|---|---|
| Democratic | Chellie Pingree (Incumbent) | 271,004 | 62.2% | |
| Republican | Jay Allen | 165,008 | 37.8% | |
| Write-in | 15 | 0.0% | ||
| Total votes | 436,027 | 100% | ||
| Democratic hold | ||||
Recent election results from presidential races
| Year | Results |
|---|---|
| 1972 | Nixon 61 – 39% |
| 1976 | Ford 49 – 48% |
| 1980 | Reagan 45 – 42% |
| 1984 | Reagan 60 – 40% |
| 1988 | Bush 56 – 43% |
| 1992 | B Clinton 40 – 32% |
| 1996 | B Clinton 52 – 32% |
| 2000 | Gore 51 – 43% |
| 2004 | Kerry 55 – 43% |
| 2008 | Obama 61 – 38% |
| 2012 | Obama 60 – 38% |
| 2016[9] | H Clinton 54 – 39% |
| 2020 | Biden 60 – 37% |
Notes
- The service of member-elect Joseph E. Brennan began January 3, 1987[3] even though he was sworn in January 9, 1987[4] to finish his term as the outgoing Governor of Maine.
References
- https://www.census.gov/mycd/?st=23&cd=01
- "Partisan Voting Index – Districts of the 115th Congress" (PDF). The Cook Political Report. April 7, 2017. Retrieved April 7, 2017.
- http://bioguide.congress.gov/scripts/biodisplay.pl?index=B000798
- Congressional record, 1987
- "Bureau of Corporations, Elections & Commissions, Elections Division". Main Bureau of Corporations, Elections & Commission, Elections. Archived from the original on August 1, 2012. Retrieved March 30, 2012.
- "Maine General Election 2014". Maine Secretary of State. November 4, 2014. Retrieved 2014-12-19.
- "Tabulations for Elections held in 2016". Maine Secretary of State. Retrieved December 12, 2016.
- "Maine's 1st Congressional District election, 2018 Maine's 1st Congressional District election". Ballotpedia. Retrieved November 21, 2018.
- 2016 Election Results The Press Herald
Bibliography
- Martis, Kenneth C. (1989). The Historical Atlas of Political Parties in the United States Congress. New York: Macmillan Publishing Company.
- Martis, Kenneth C. (1982). The Historical Atlas of United States Congressional Districts. New York: Macmillan Publishing Company.
- Congressional Biographical Directory of the United States 1774–present
External links
| U.S. House of Representatives | ||
|---|---|---|
| Preceded by Kentucky's 6th congressional district |
Home district of the Speaker of the House December 4, 1889 – March 3, 1891 |
Succeeded by Georgia's 3rd congressional district |
| Preceded by Georgia's 3rd congressional district |
Home district of the Speaker of the House December 2, 1895 – March 3, 1899 |
Succeeded by Iowa's 3rd congressional district |
.jpg.webp)

.jpg.webp)


.jpg.webp)


.jpg.webp)
.jpg.webp)
.jpg.webp)
.jpg.webp)
.jpg.webp)


.jpg.webp)



.tif.png.webp)
