Oxford County, Maine
Oxford County is a county in the state of Maine, United States. As of the 2010 Census, the county had a population of 57,833.[1] Its county seat is the town of Paris.[2] The county was formed on March 4, 1805, from northerly portions of York and Cumberland counties. It borders the Canadian province of Quebec.
Oxford County | |
|---|---|
 | |
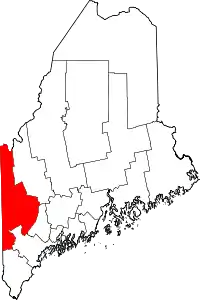 Location within the U.S. state of Maine | |
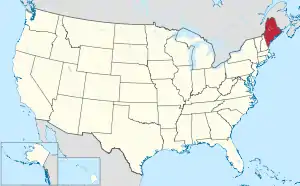 Maine's location within the U.S. | |
| Coordinates: 44°19′28″N 70°42′19″W | |
| Country | |
| State | |
| Founded | 1805 |
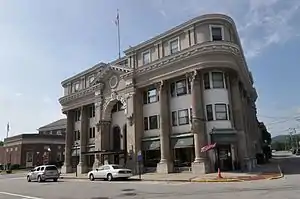
| Seat | Paris |
| Largest town | Rumford |
| Area | |
| • Total | 2,176 sq mi (5,640 km2) |
| • Land | 2,077 sq mi (5,380 km2) |
| • Water | 99 sq mi (260 km2) 4.5%% |
| Population (2010) | |
| • Total | 57,833 |
| • Estimate (2019) | 57,975 |
| • Density | 27/sq mi (10/km2) |
| Time zone | UTC−5 (Eastern) |
| • Summer (DST) | UTC−4 (EDT) |
| Congressional district | 2nd |
| Website | www |
Part of Oxford County is included in the Lewiston-Auburn, Maine metropolitan New England City and Town Area while a different part of Oxford County is included in the Portland-South Portland-Biddeford, Maine metropolitan New England City and Town Area.
Geography

According to the U.S. Census Bureau, the county has a total area of 2,176 square miles (5,640 km2), of which 2,077 square miles (5,380 km2) is land and 99 square miles (260 km2) (4.5%) is water.[3]
Adjacent counties and municipalities
- Franklin County – northeast
- Androscoggin County – east
- Cumberland County – southeast
- York County – south
- Carroll County, New Hampshire – southwest
- Coös County, New Hampshire – west
- Le Granit Regional County Municipality, Quebec – north
National protected areas
Demographics
| Historical population | |||
|---|---|---|---|
| Census | Pop. | %± | |
| 1810 | 17,630 | — | |
| 1820 | 27,104 | 53.7% | |
| 1830 | 35,219 | 29.9% | |
| 1840 | 38,351 | 8.9% | |
| 1850 | 39,763 | 3.7% | |
| 1860 | 36,698 | −7.7% | |
| 1870 | 33,488 | −8.7% | |
| 1880 | 32,627 | −2.6% | |
| 1890 | 30,586 | −6.3% | |
| 1900 | 32,238 | 5.4% | |
| 1910 | 36,256 | 12.5% | |
| 1920 | 37,700 | 4.0% | |
| 1930 | 41,483 | 10.0% | |
| 1940 | 42,662 | 2.8% | |
| 1950 | 44,221 | 3.7% | |
| 1960 | 44,345 | 0.3% | |
| 1970 | 43,457 | −2.0% | |
| 1980 | 48,968 | 12.7% | |
| 1990 | 52,602 | 7.4% | |
| 2000 | 54,755 | 4.1% | |
| 2010 | 57,833 | 5.6% | |
| 2019 (est.) | 57,975 | 0.2% | |
| U.S. Decennial Census[4] 1790–1960[5] 1900–1990[6] 1990–2000[7] 2010–2016[1] 2018[8] | |||
2015
As of 2015 the largest self-reported ancestry groups in Oxford County, Maine are:[9]
| Largest ancestries (2015) | Percent |
|---|---|
| English | 22.6% |
| French or French Canadian | 20.9% |
| Irish | 15.7% |
| "American" | 8.9% |
| German | 6.5% |
| Scottish | 5.6% |
| Italian | 4.9% |
| Polish | 1.9% |
2000 census
At the 2000 census there were 54,755 people, 22,314 households, and 15,173 families living in the county. The population density was 26 people per square mile (10/km2). There were 32,295 housing units at an average density of 16 per square mile (6/km2). The racial makeup of the county was 98.25% White, 0.17% Black or African American, 0.28% Native American, 0.37% Asian, 0.02% Pacific Islander, 0.11% from other races, and 0.80% from two or more races. 0.53% of the population were Hispanic or Latino of any race. 23.6% were of English, 13.9% French, 13.7% United States or American, 10.1% Irish and 8.4% French Canadian ancestry according to Census 2000. 95.9% spoke English and 2.6% French as their first language.[10] Of the 22,314 households 30.40% had children under the age of 18 living with them, 54.10% were married couples living together, 9.50% had a female householder with no husband present, and 32.00% were non-families. 25.60% of households were one person and 11.00% were one person aged 65 or older. The average household size was 2.42 and the average family size was 2.87.
The age distribution was 24.20% under the age of 18, 6.50% from 18 to 24, 27.80% from 25 to 44, 25.50% from 45 to 64, and 16.10% 65 or older. The median age was 40 years. For every 100 females there were 95.40 males. For every 100 females age 18 and over, there were 93.70 males.
The median household income was $33,435 and the median family income was $39,794. Males had a median income of $30,641 versus $21,233 for females. The per capita income for the county was $16,945. About 8.30% of families and 11.80% of the population were below the poverty line, including 14.80% of those under age 18 and 10.10% of those age 65 or over.
2010 census
At the 2010 census, there were 57,833 people, 24,300 households, and 15,781 families living in the county.[11] The population density was 27.8 inhabitants per square mile (10.7/km2). There were 36,055 housing units at an average density of 17.4 per square mile (6.7/km2).[12] The racial makeup of the county was 96.8% white, 0.6% Asian, 0.4% American Indian, 0.4% black or African American, 0.3% from other races, and 1.5% from two or more races. Those of Hispanic or Latino origin made up 1.0% of the population.[11] In terms of ancestry, 23.6% were English, 14.8% were Irish, 8.2% were American, 6.4% were German, and 5.6% were French Canadian.[13]
Of the 24,300 households, 28.1% had children under the age of 18 living with them, 49.0% were married couples living together, 10.4% had a female householder with no husband present, 35.1% were non-families, and 27.1% of households were made up of individuals. The average household size was 2.35 and the average family size was 2.81. The median age was 44.6 years.[11]
The median household income was $39,748 and the median family income was $48,000. Males had a median income of $37,892 versus $30,187 for females. The per capita income for the county was $21,254. About 9.6% of families and 13.2% of the population were below the poverty line, including 17.6% of those under age 18 and 12.2% of those age 65 or over.[14]
Politics
Voter registration
| Voter registration and party enrollment as of May 2019 [15] | |||||
|---|---|---|---|---|---|
| Unenrolled | 18,209 | 40.93% | |||
| Republican | 12,285 | 27.62% | |||
| Democratic | 11,833 | 26.6% | |||
| Green Independent | 2,147 | 4.83% | |||
| Libertarian | 10 | 0.02% | |||
| Total | 44,485 | 100% | |||
From 1908 to 1988, Oxford County was dominated by the Republican Party in presidential elections, only failing to back a Republican candidate in 1908, 1964, & 1968. The county flipped in 1992 to become consistently Democratic like the rest of Maine, & stayed that way until 2012. However, it made a 27.8 point swing[16] (the largest statewide) to back Republican Donald Trump in 2016 as he won Maine's second congressional district containing the county.
| Year | Republican | Democratic | Third parties |
|---|---|---|---|
| 2020 | 52.8% 17,698 | 44.0% 14,743 | 4.0% 1,357 |
| 2016 | 52.0% 16,210 | 39.0% 12,172 | 9.0% 2,819 |
| 2012 | 40.8% 11,996 | 55.5% 16,330 | 3.7% 1,094 |
| 2008 | 40.6% 12,863 | 56.7% 17,940 | 2.7% 847 |
| 2004 | 45.0% 14,196 | 52.7% 16,618 | 2.3% 732 |
| 2000 | 43.1% 11,835 | 49.7% 13,649 | 7.3% 2,009 |
| 1996 | 27.7% 7,238 | 52.1% 13,580 | 20.2% 5,273 |
| 1992 | 27.9% 8,194 | 38.2% 11,202 | 33.9% 9,960 |
| 1988 | 55.9% 13,568 | 43.4% 10,523 | 0.7% 175 |
| 1984 | 64.3% 15,408 | 35.2% 8,430 | 0.5% 110 |
| 1980 | 47.0% 11,041 | 42.2% 9,914 | 10.7% 2,519 |
| 1976 | 49.0% 10,551 | 48.1% 10,340 | 2.9% 625 |
| 1972 | 64.4% 12,114 | 35.4% 6,661 | 0.3% 48 |
| 1968 | 41.7% 8,030 | 56.4% 10,870 | 2.0% 375 |
| 1964 | 28.1% 5,340 | 71.8% 13,616 | 0.1% 19 |
| 1960 | 56.7% 11,715 | 43.3% 8,951 | 0.0% 0 |
| 1956 | 73.0% 12,607 | 27.0% 4,653 | 0.0% 0 |
| 1952 | 66.6% 11,575 | 33.1% 5,757 | 0.3% 43 |
| 1948 | 58.2% 7,444 | 40.6% 5,183 | 1.2% 155 |
| 1944 | 55.8% 8,053 | 44.2% 6,377 | 0.1% 12 |
| 1940 | 53.5% 8,656 | 46.4% 7,502 | 0.2% 25 |
| 1936 | 57.1% 8,778 | 38.0% 5,836 | 4.9% 752 |
| 1932 | 52.7% 8,264 | 45.8% 7,179 | 1.5% 230 |
| 1928 | 69.8% 9,409 | 29.8% 4,015 | 0.5% 66 |
| 1924 | 69.9% 7,062 | 25.4% 2,563 | 4.7% 478 |
| 1920 | 64.6% 7,301 | 34.6% 3,906 | 0.9% 97 |
| 1916 | 51.7% 4,026 | 46.6% 3,625 | 1.7% 131 |
| 1912 | 16.7% 1,234 | 39.8% 2,941 | 43.5% 3,217 |
| 1908 | 64.5% 4,179 | 32.3% 2,093 | 3.2% 204 |
Recreation
Oxford county is home to many summer camps. Some of these camps are Camp Wekeela, Kamp Kohut, Camp Wyonegonic, Forest Acres Camp for Girls and Maine Teen Camp.
Communities

Towns
- Andover
- Bethel
- Brownfield
- Buckfield
- Byron
- Canton
- Denmark
- Dixfield
- Fryeburg
- Gilead
- Greenwood
- Hanover
- Hartford
- Hebron
- Hiram
- Lincoln Plantation
- Lovell
- Magalloway Plantation
- Mexico
- Milton
- Newry
- Norway
- Otisfield
- Oxford
- Paris (county seat)
- Peru
- Porter
- Roxbury
- Rumford
- Stoneham
- Stow
- Sumner
- Sweden
- Upton
- Waterford
- West Paris
- Woodstock
Unorganized territories
Other unincorporated communities
References
- "State & County QuickFacts". United States Census Bureau. Archived from the original on June 6, 2011. Retrieved August 19, 2013.
- "Find a County". National Association of Counties. Retrieved 2011-06-07.
- "2010 Census Gazetteer Files". United States Census Bureau. August 22, 2012. Archived from the original on September 9, 2014. Retrieved September 7, 2014.
- "U.S. Decennial Census". United States Census Bureau. Retrieved September 7, 2014.
- "Historical Census Browser". University of Virginia Library. Retrieved September 7, 2014.
- "Population of Counties by Decennial Census: 1900 to 1990". United States Census Bureau. Retrieved September 7, 2014.
- "Census 2000 PHC-T-4. Ranking Tables for Counties: 1990 and 2000" (PDF). United States Census Bureau. Retrieved September 7, 2014.
- "QuickFacts. Oxford County, Maine". United States Census Bureau. Retrieved July 26, 2019.
- "Archived copy". Archived from the original on 2020-02-13. Retrieved 2017-01-31.CS1 maint: archived copy as title (link)
- "U.S. Census website". United States Census Bureau. Retrieved 2008-01-31.
- "DP-1 Profile of General Population and Housing Characteristics: 2010 Demographic Profile Data". United States Census Bureau. Archived from the original on 2020-02-13. Retrieved 2016-01-21.
- "Population, Housing Units, Area, and Density: 2010 - County". United States Census Bureau. Archived from the original on 2020-02-13. Retrieved 2016-01-21.
- "DP02 SELECTED SOCIAL CHARACTERISTICS IN THE UNITED STATES – 2006-2010 American Community Survey 5-Year Estimates". United States Census Bureau. Archived from the original on 2020-02-13. Retrieved 2016-01-21.
- "DP03 SELECTED ECONOMIC CHARACTERISTICS – 2006-2010 American Community Survey 5-Year Estimates". United States Census Bureau. Archived from the original on 2020-02-13. Retrieved 2016-01-21.
- Bureau of Corporations, Elections & Commissions (5 May 2019). "Registered & Enrolled Voters - Statewide" (PDF). Department of the Secretary of State, State of Maine. p. 19. Retrieved 13 November 2019.
- "Here's a map of the US counties that flipped to Trump from Democrats". www.cnbc.com. Retrieved 2019-06-18.
- Leip, David. "Dave Leip's Atlas of U.S. Presidential Elections". uselectionatlas.org. Retrieved 2018-08-26.
External links
| Wikimedia Commons has media related to Oxford County, Maine. |
Places adjacent to Oxford County, Maine | |
|---|---|
Municipalities and communities of Oxford County, Maine, United States | ||
|---|---|---|
| Towns | Oxford County map | |
| Plantations | ||
| Unorganized territories | ||
| CDPs | ||
| Other villages | ||
| Footnotes | ‡This populated place also has portions in an adjacent county | |
| ||
Augusta (capital) | ||
| Topics |
| |
| Society | ||
| Regions | ||
| Counties | ||
| Cities | ||
| Largest towns | ||

| Authority control |
|---|