Meagher County, Montana
Meagher County (pronounced Marr) is a county located in the U.S. state of Montana. As of the 2010 United States Census, the population was 1,891.[1] Its county seat is White Sulphur Springs.[2]
Meagher County | |
|---|---|
 | |
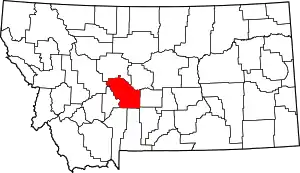 Location within the U.S. state of Montana | |
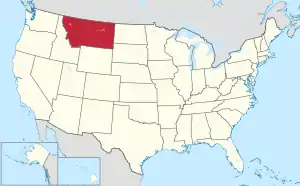 Montana's location within the U.S. | |
| Coordinates: 46°48′47″N 111°12′36″W | |
| Country | |
| State | |
| Founded | November 16, 1867 |
| Named for | Thomas Francis Meagher |
| Seat | White Sulphur Springs |
| Largest city | White Sulphur Springs |
| Area | |
| • Total | 2,395 sq mi (6,200 km2) |
| • Land | 2,392 sq mi (6,200 km2) |
| • Water | 2.8 sq mi (7 km2) 0.1% |
| Population (2010) | |
| • Total | 1,891 |
| • Estimate (2019) | 1,862 |
| • Density | 0.79/sq mi (0.30/km2) |
| Time zone | UTC−7 (Mountain) |
| • Summer (DST) | UTC−6 (MDT) |
| Congressional district | At-large |
| Website | www |
| |
According to the U.S. Census Bureau, the 2010 center of population of Montana is located in Meagher County at 46.78°N 111.3°W[3]
History
Meagher County was named for Thomas Francis Meagher, territorial governor of Montana.[4]
The first county seat was Diamond City, the main city of the Confederate Gulch mining district. This entire area is no longer part of Meagher County, but today lies in neighboring Broadwater County.
Geography
According to the U.S. Census Bureau, the county has a total area of 2,395 square miles (6,200 km2), of which 2,392 square miles (6,200 km2) is land and 2.8 square miles (7.3 km2) (0.1%) is water.[5]
Major highways
Adjacent counties
- Cascade County - north
- Judith Basin County - northeast
- Wheatland County - east
- Sweet Grass County - southeast
- Park County - south
- Gallatin County - south
- Broadwater County - west
- Lewis and Clark County - northwest
National protected areas
- Gallatin National Forest (part)
- Helena National Forest (part)
- Lewis and Clark National Forest (part)
Politics
This county has a strong Republican lean. This was one of 12 counties in MT that Barry Goldwater won in 1964. A Democrat has not won since Franklin D. Roosevelt in 1940.
| Year | Republican | Democratic | Third parties |
|---|---|---|---|
| 2016 | 74.6% 729 | 19.8% 193 | 5.6% 55 |
| 2012 | 68.9% 670 | 27.7% 269 | 3.4% 33 |
| 2008 | 64.6% 624 | 30.9% 298 | 4.6% 44 |
| 2004 | 71.7% 698 | 25.4% 247 | 2.9% 28 |
| 2000 | 74.7% 698 | 18.8% 176 | 6.5% 61 |
| 1996 | 54.0% 505 | 30.0% 281 | 16.0% 150 |
| 1992 | 42.1% 422 | 26.0% 260 | 31.9% 320 |
| 1988 | 65.0% 656 | 33.4% 337 | 1.6% 16 |
| 1984 | 72.1% 771 | 26.5% 283 | 1.4% 15 |
| 1980 | 69.6% 689 | 25.0% 247 | 5.5% 54 |
| 1976 | 60.2% 565 | 38.8% 364 | 1.1% 10 |
| 1972 | 71.6% 674 | 24.4% 230 | 4.0% 38 |
| 1968 | 62.9% 543 | 25.3% 218 | 11.8% 102 |
| 1964 | 55.4% 506 | 44.4% 405 | 0.2% 2 |
| 1960 | 58.5% 613 | 41.1% 431 | 0.4% 4 |
| 1956 | 66.7% 712 | 33.3% 355 | 0.0% 0 |
| 1952 | 70.7% 792 | 29.1% 326 | 0.2% 2 |
| 1948 | 50.1% 518 | 48.0% 497 | 1.9% 20 |
| 1944 | 51.3% 509 | 48.5% 482 | 0.2% 2 |
| 1940 | 44.9% 520 | 53.7% 621 | 1.4% 16 |
| 1936 | 38.7% 495 | 59.9% 767 | 1.4% 18 |
| 1932 | 42.0% 462 | 56.4% 621 | 1.6% 18 |
| 1928 | 67.9% 714 | 31.9% 335 | 0.2% 2 |
| 1924 | 59.6% 624 | 24.6% 257 | 15.9% 166 |
| 1920 | 69.1% 744 | 29.2% 314 | 1.8% 19 |
| 1916 | 43.1% 1,158 | 55.2% 1,482 | 1.8% 47 |
| 1912 | 26.8% 321 | 39.5% 473 | 33.8% 405 |
| 1908 | 59.6% 495 | 37.8% 314 | 2.7% 22 |
| 1904 | 66.9% 485 | 31.7% 230 | 1.4% 10 |
Demographics
| Historical population | |||
|---|---|---|---|
| Census | Pop. | %± | |
| 1870 | 1,387 | — | |
| 1880 | 2,743 | 97.8% | |
| 1890 | 4,749 | 73.1% | |
| 1900 | 2,526 | −46.8% | |
| 1910 | 4,190 | 65.9% | |
| 1920 | 2,622 | −37.4% | |
| 1930 | 2,272 | −13.3% | |
| 1940 | 2,237 | −1.5% | |
| 1950 | 2,079 | −7.1% | |
| 1960 | 2,616 | 25.8% | |
| 1970 | 2,122 | −18.9% | |
| 1980 | 2,154 | 1.5% | |
| 1990 | 1,819 | −15.6% | |
| 2000 | 1,932 | 6.2% | |
| 2010 | 1,891 | −2.1% | |
| 2019 (est.) | 1,862 | [7] | −1.5% |
| US Decennial Census[8] 1790-1960[9] 1900-1990[10] 1990-2000[11] 2010-2019[1] | |||
2000 census
As of the 2000 United States Census,[12] there were 1,932 people, 803 households, and 529 families in the county. The population density was <1/km2 (1/sq mi). There were 1,363 housing units at an average density of <1/km2 (1/sq mi). The racial makeup of the county was 97.20% White, 1.04% Native American, 0.16% Asian, 0.05% Pacific Islander, 0.57% from other races, and 0.98% from two or more races. 1.50% of the population were Hispanic or Latino of any race. 28.8% were of German, 14.5% Norwegian, 13.3% English, 12.4% Irish and 7.8% American ancestry.
There were 803 households, out of which 27.30% had children under the age of 18 living with them, 56.80% were married couples living together, 6.10% had a female householder with no husband present, and 34.10% were non-families. 31.00% of all households were made up of individuals, and 13.70% had someone living alone who was 65 years of age or older. The average household size was 2.37 and the average family size was 3.00.
The county population contained 25.00% under the age of 18, 6.10% from 18 to 24, 22.70% from 25 to 44, 28.10% from 45 to 64, and 18.20% who were 65 years of age or older. The median age was 43 years. For every 100 females there were 100.40 males. For every 100 females age 18 and over, there were 100.40 males.
The median income for a household in the county was $29,375, and the median income for a family was $33,879. Males had a median income of $22,083 versus $15,417 for females. The per capita income for the county was $15,019. About 16.40% of families and 18.90% of the population were below the poverty line, including 27.40% of those under age 18 and 13.00% of those age 65 or over.
2010 census
As of the 2010 United States Census, there were 1,891 people, 806 households, and 509 families in the county.[13] The population density was 0.8 inhabitants per square mile (0.31/km2). There were 1,432 housing units at an average density of 0.6 per square mile (0.23/km2).[14] The racial makeup of the county was 97.9% white, 0.3% Asian, 0.3% American Indian, 0.1% black or African American, 0.1% from other races, and 1.3% from two or more races. Those of Hispanic or Latino origin made up 1.5% of the population.[13] In terms of ancestry, 38.6% were German, 14.3% were Norwegian, 13.6% were Irish, 11.0% were English, 5.9% were Scotch-Irish, and 3.2% were American.[15]
Of the 806 households, 20.8% had children under the age of 18 living with them, 54.6% were married couples living together, 6.2% had a female householder with no husband present, 36.8% were non-families, and 33.3% of all households were made up of individuals. The average household size was 2.13 and the average family size was 2.67. The median age was 50.1 years.[13]
The median income for a household in the county was $31,577 and the median income for a family was $40,057. Males had a median income of $30,556 versus $16,414 for females. The per capita income for the county was $17,318. About 14.1% of families and 19.0% of the population were below the poverty line, including 21.7% of those under age 18 and 13.0% of those age 65 or over.[16]
Communities
City
- White Sulphur Springs (county seat)
Census-designated place
Unincorporated communities
Individual residences (identified on aerial map)
- Ford Place[25]
See also
- List of lakes in Meagher County, Montana
- Confederate Gulch and Diamond City (historically in Meagher County, but now in Broadwater County)
- List of mountains in Meagher County, Montana
- National Register of Historic Places listings in Meagher County, Montana
References
- "State & County QuickFacts". US Census Bureau. Archived from the original on June 6, 2011. Retrieved September 15, 2013.
- "Find a County". National Association of Counties. Retrieved June 7, 2011.
- "Centers of Population by State: 2010" (txt). US Census Bureau. Retrieved March 29, 2014.
- Gannett, Henry (1905). The Origin of Certain Place Names in the United States. U.S. Government Printing Office. p. 204.
- "2010 Census Gazetteer Files". US Census Bureau. August 22, 2012. Archived from the original on December 5, 2014. Retrieved November 29, 2014.
- Leip, David. "Atlas of US Presidential Elections". uselectionatlas.org. Retrieved April 3, 2018.
- "Population and Housing Unit Estimates". Retrieved October 26, 2020.
- "US Decennial Census". US Census Bureau. Retrieved November 29, 2014.
- "Historical Census Browser". University of Virginia Library. Retrieved November 29, 2014.
- "Population of Counties by Decennial Census: 1900 to 1990". US Census Bureau. Retrieved November 29, 2014.
- "Census 2000 PHC-T-4. Ranking Tables for Counties: 1990 and 2000" (PDF). US Census Bureau. Retrieved November 29, 2014.
- "U.S. Census website". US Census Bureau]]. Retrieved January 31, 2008.
- "Profile of General Population and Housing Characteristics: 2010 Demographic Profile Data". US Census Bureau. Archived from the original on February 13, 2020. Retrieved January 10, 2016.
- "Population, Housing Units, Area, and Density: 2010 - County". US Census Bureau. Archived from the original on February 13, 2020. Retrieved January 10, 2016.
- "Selected Social Characteristics in the US – 2006-2010 American Community Survey 5-Year Estimates". US Census Bureau. Archived from the original on February 13, 2020. Retrieved January 10, 2016.
- "Selected Economic Characteristics – 2006-2010 American Community Survey 5-Year Estimates". US Census Bureau. Archived from the original on February 13, 2020. Retrieved January 10, 2016.
- Castle Town MT Google Maps (accessed January 3, 2019)
- Checkerboard MT Google Maps (accessed January 3, 2019)
- Fort Logan MT Google Maps (accessed January 3, 2019)
- Hamen MT Google Maps (accessed January 3, 2019)
- Loweth MT Google Maps (accessed January 3, 2019)
- Moss Agate MT Google Maps (accessed January 3, 2019)
- Moyne MT Google Maps (accessed January 3, 2019)
- Springdale Colony MT Google Maps (accessed January 3, 2019)
- Ford Place MT Google Maps (accessed January 3, 2019)
Places adjacent to Meagher County, Montana | |
|---|---|
Municipalities and communities of Meagher County, Montana, United States | ||
|---|---|---|
| City | Meagher County map | |
| CDP | ||
| Other unincorporated communities |
| |
| Ghost town | ||
| ||
| Authority control |
|---|